all experiments
Inclusive jet production at the LHC
high-pT Z production at the LHC
ttbar production at the LHC
Charge lepton asymmetry in W boson production at the LHC
LHeC DIS pseudo-data
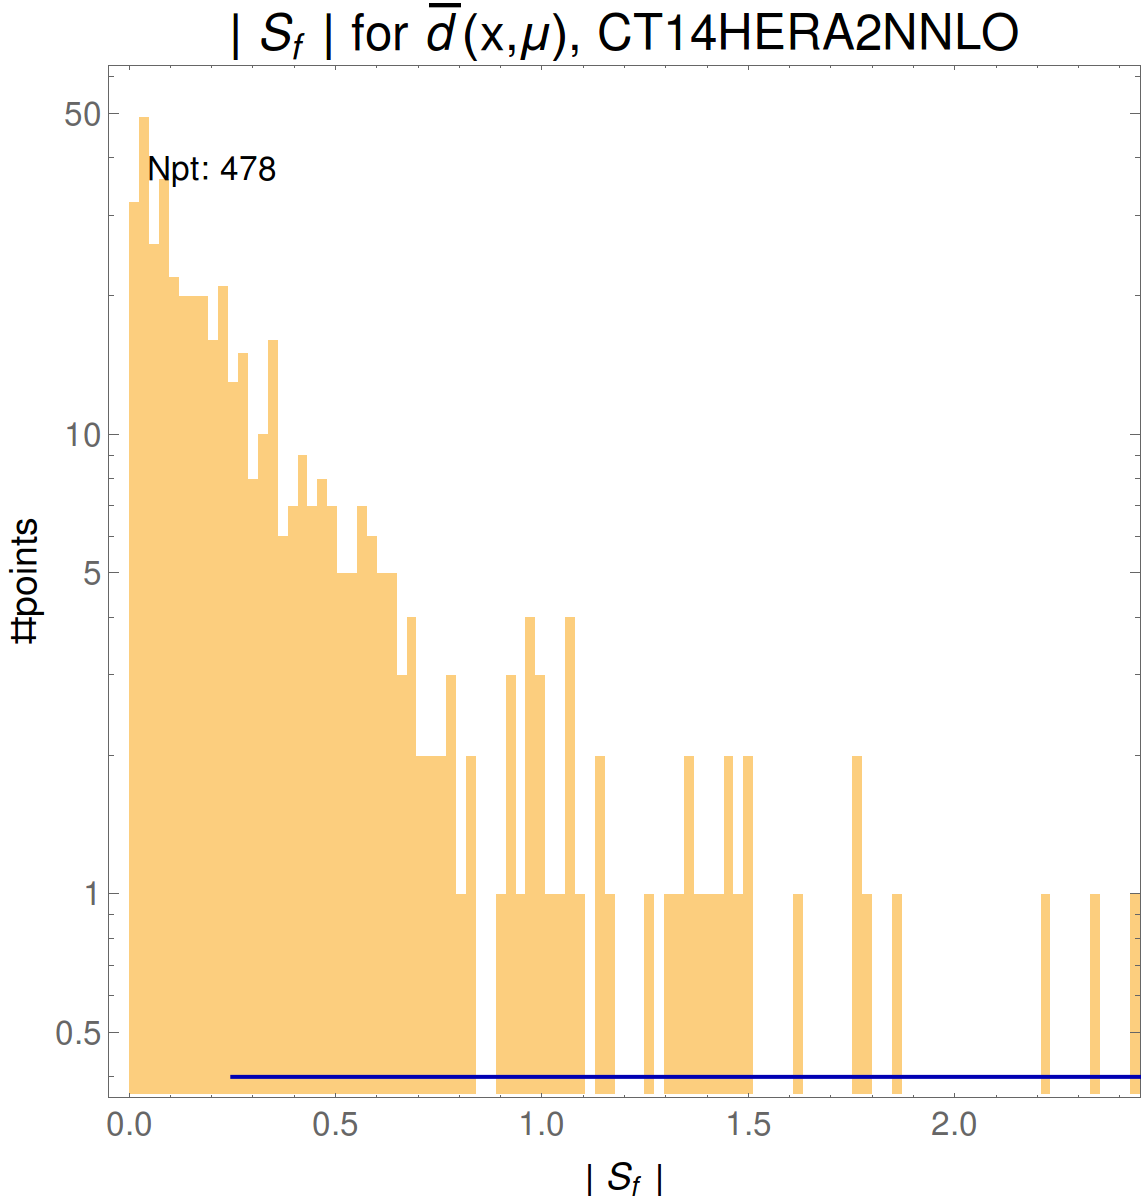
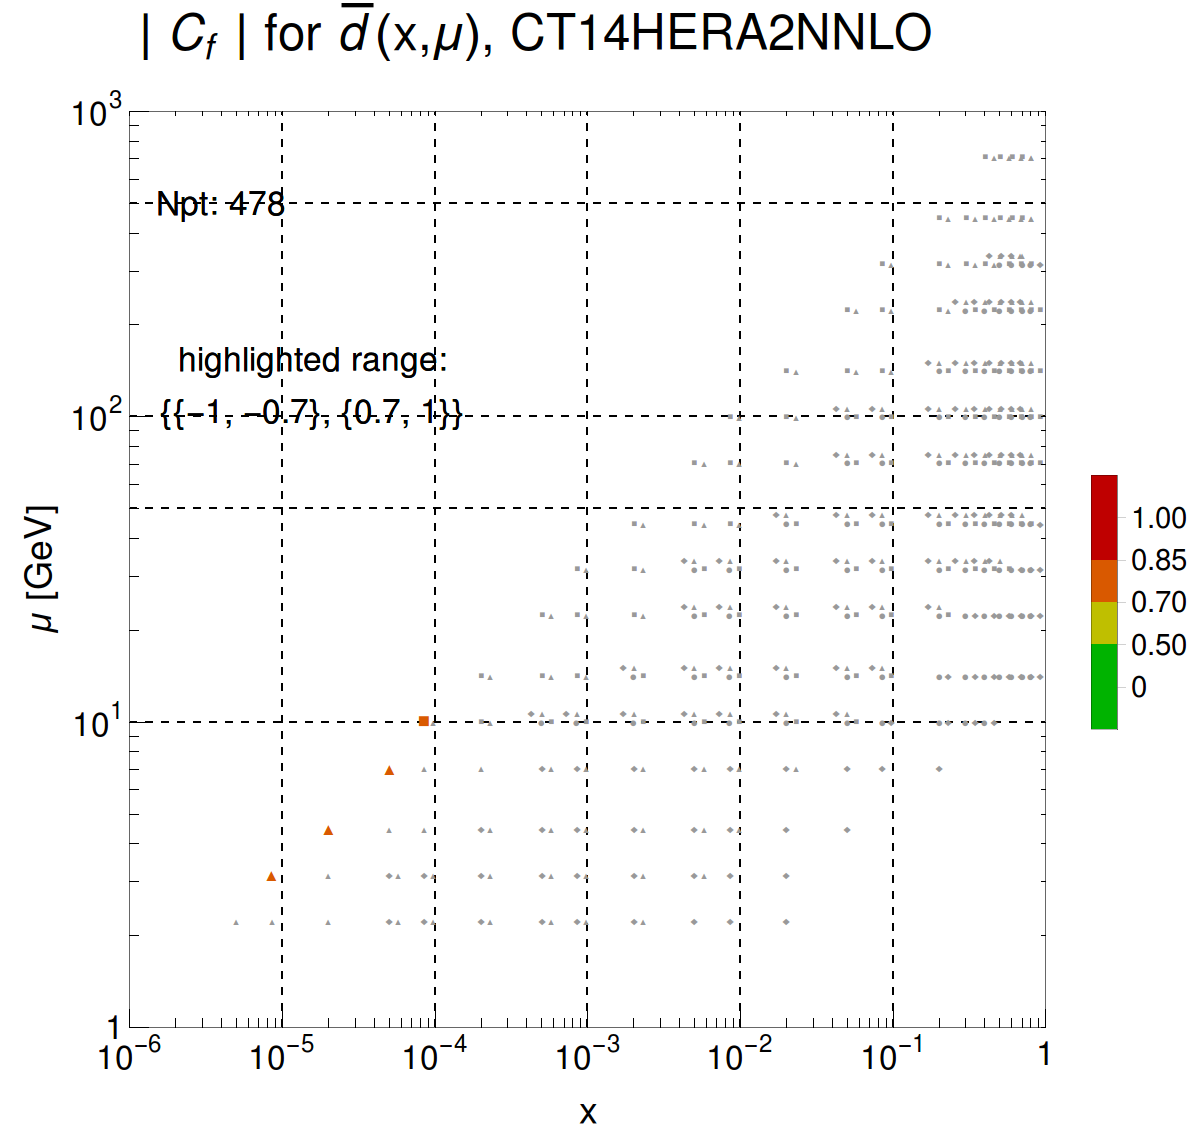
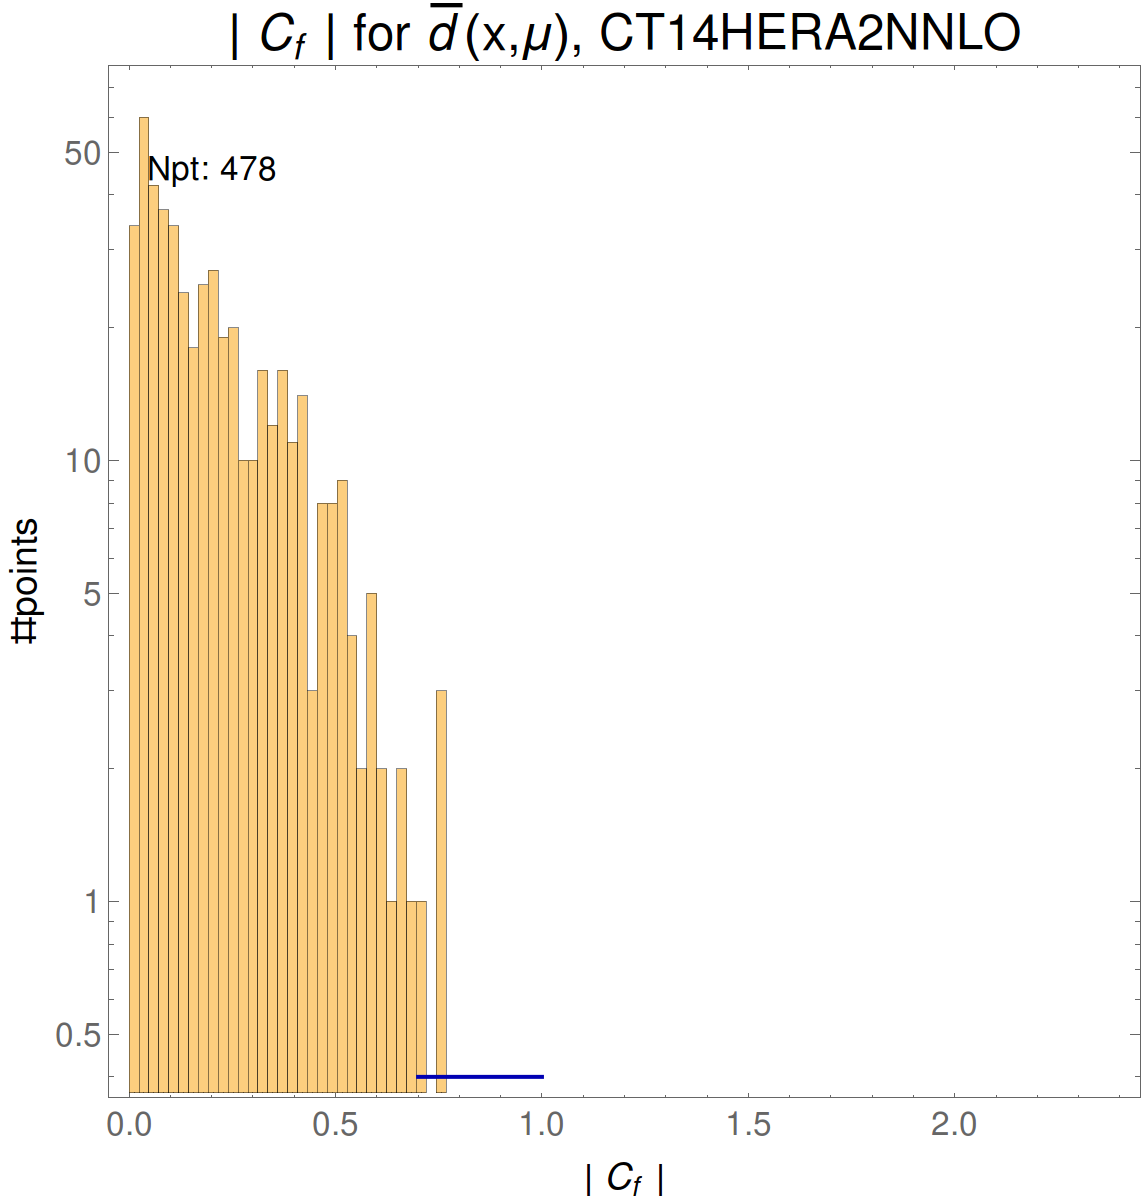
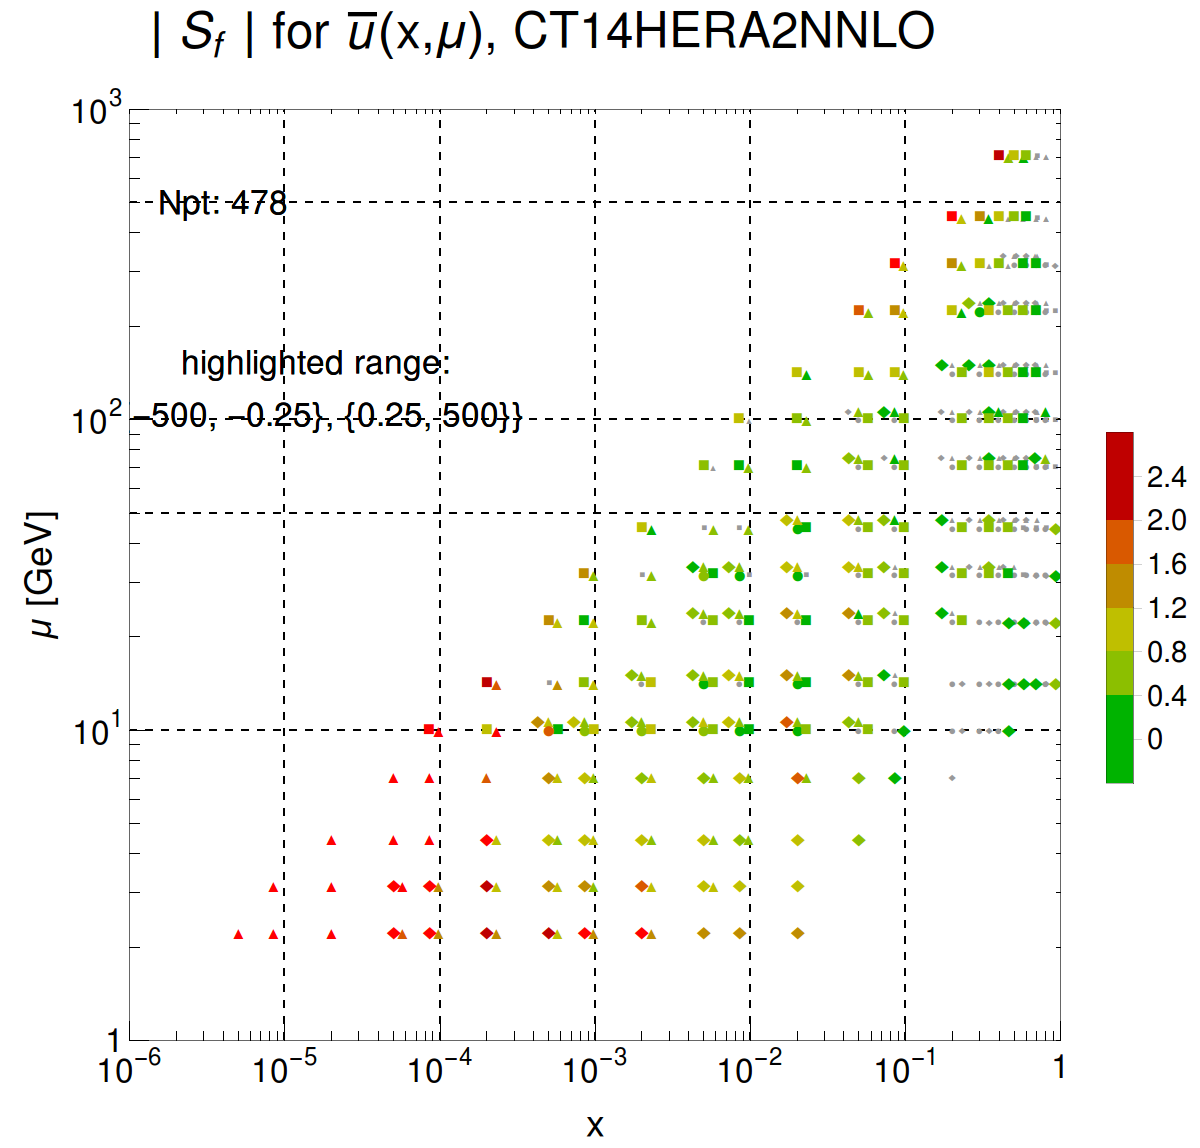
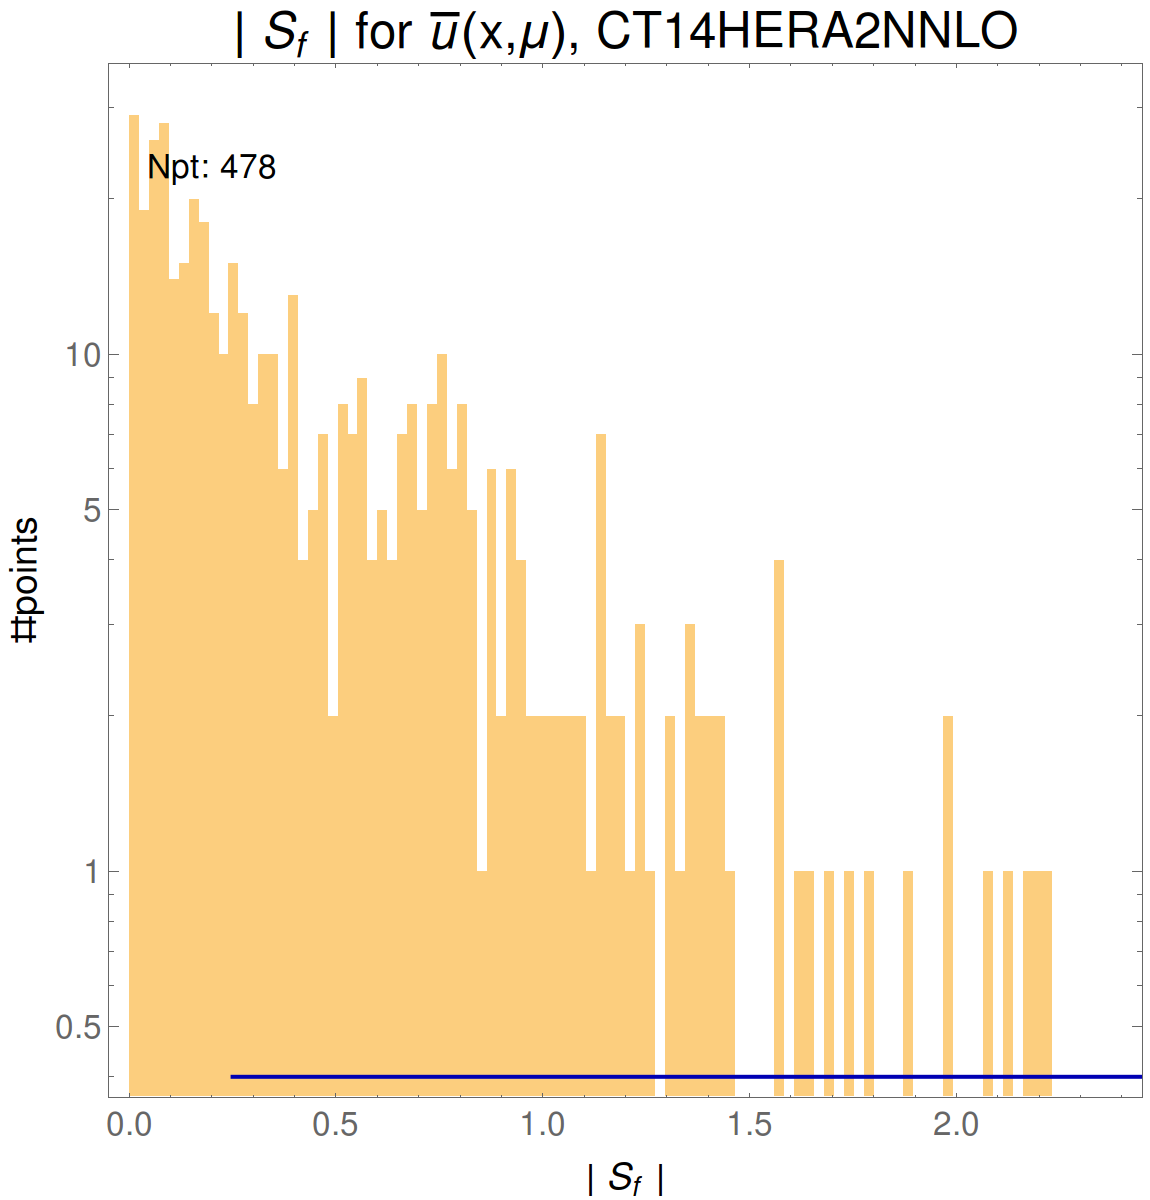
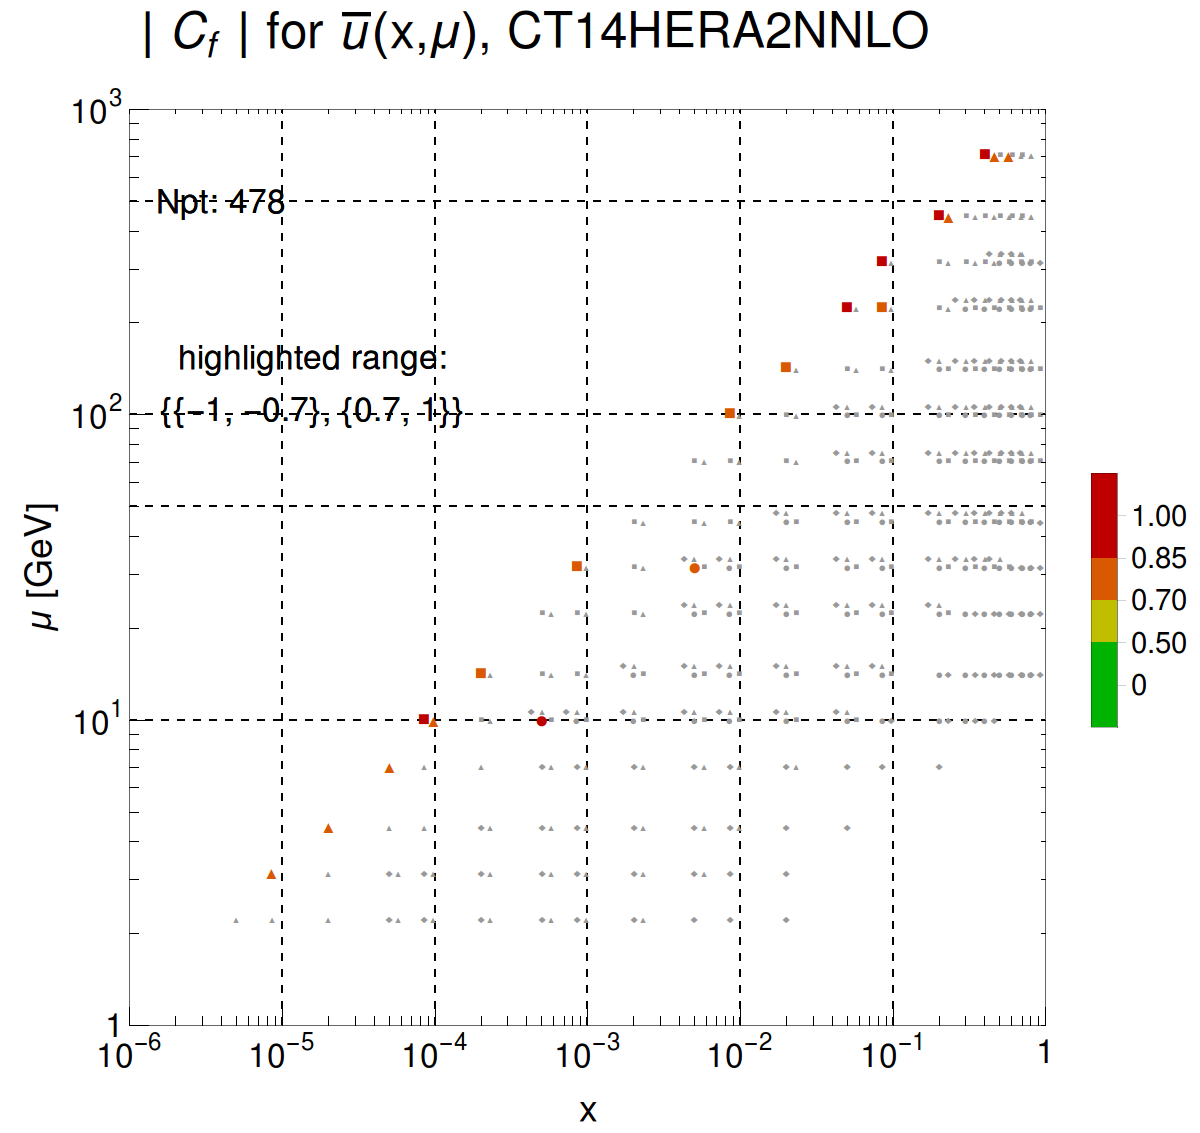
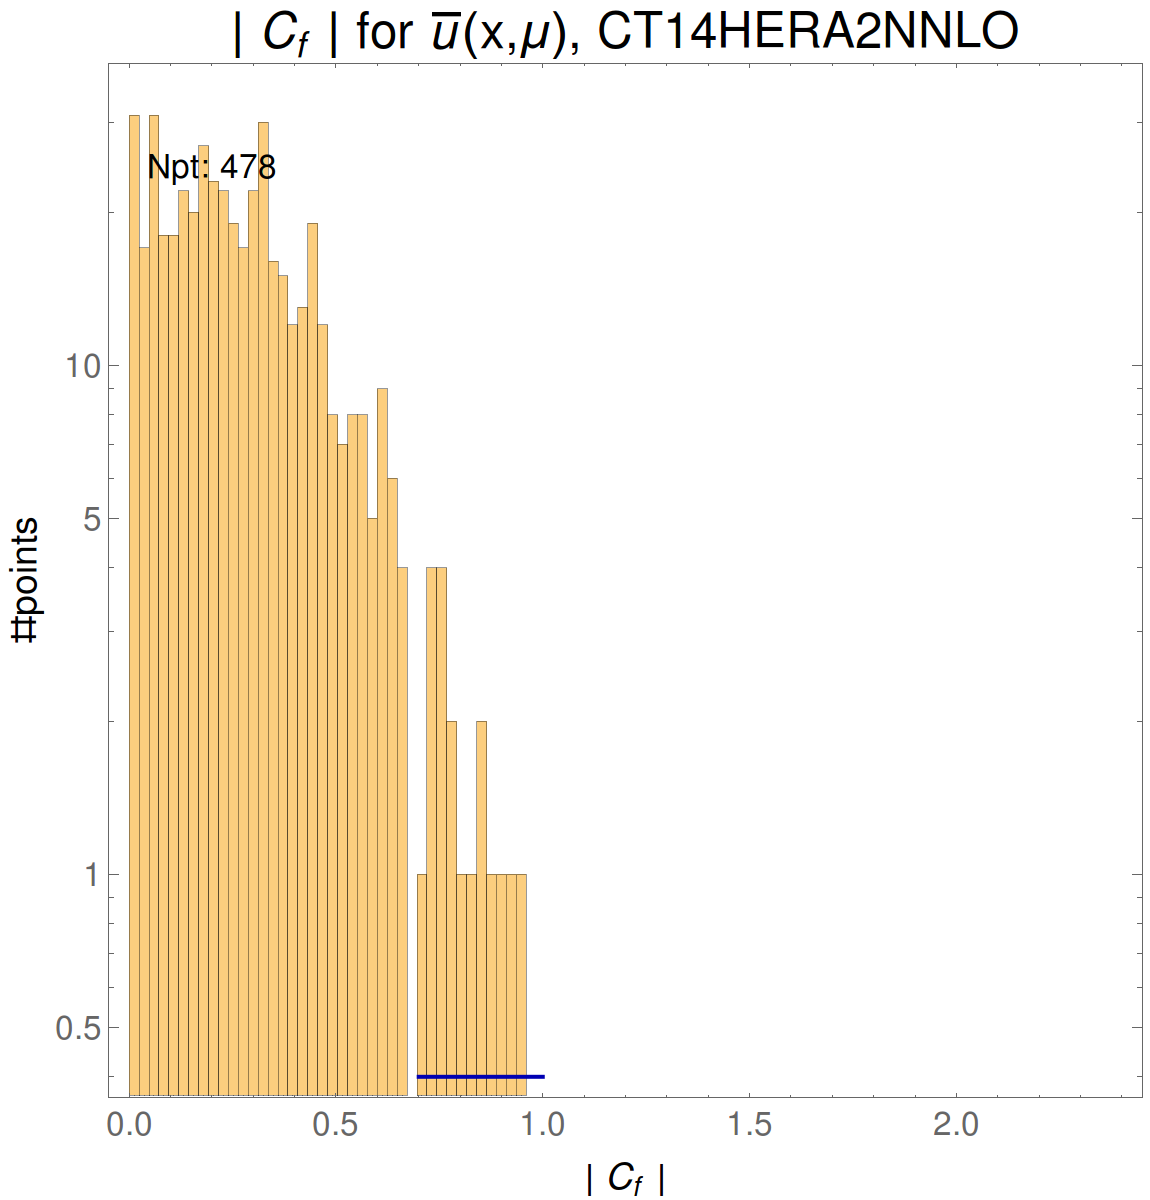
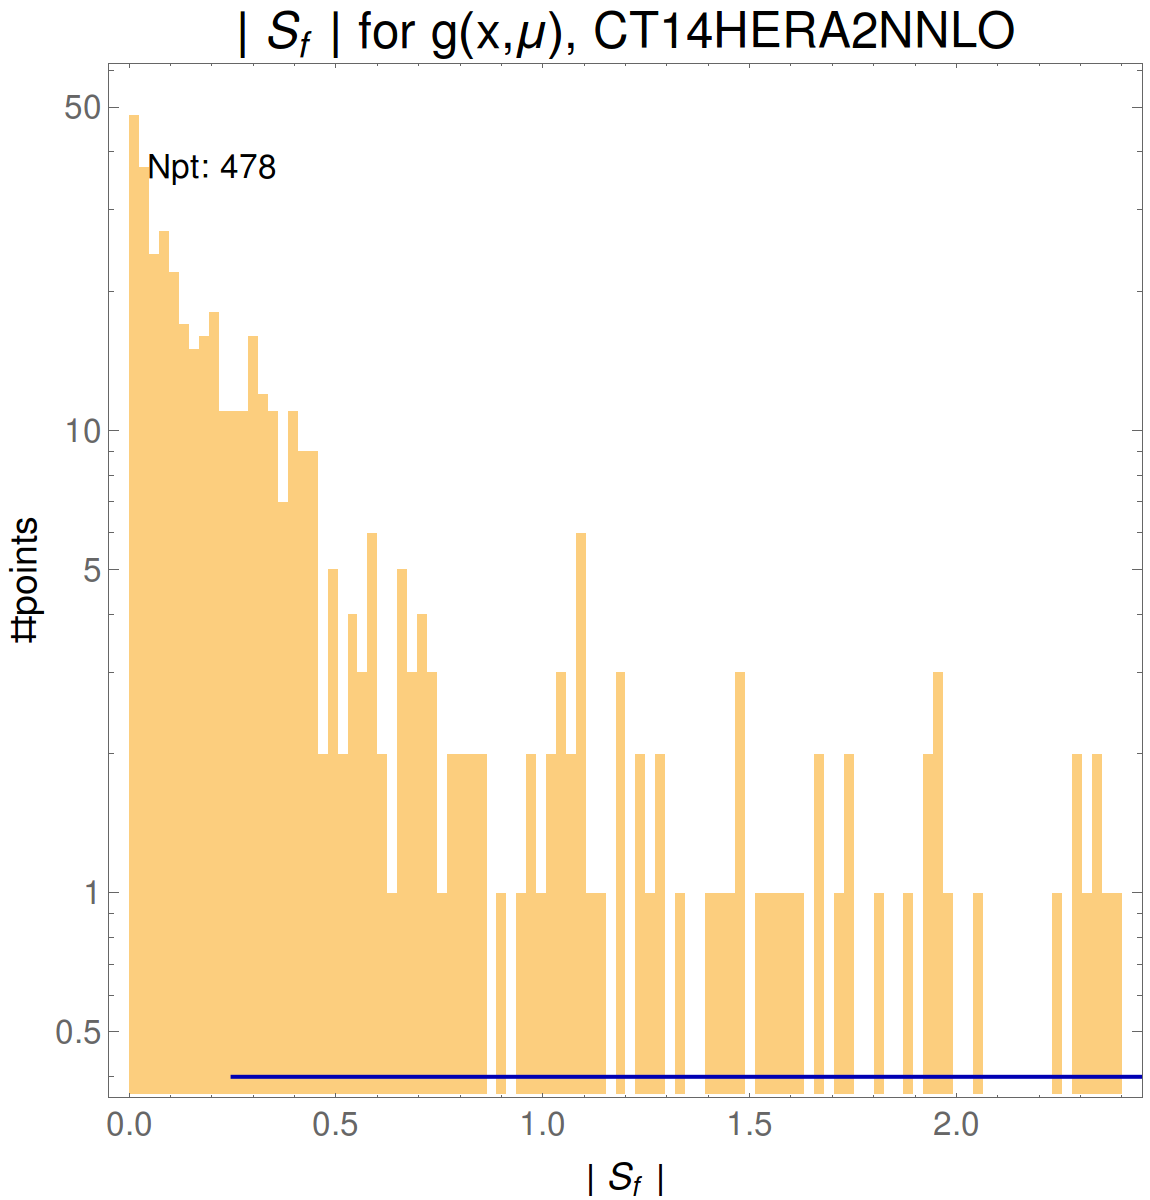
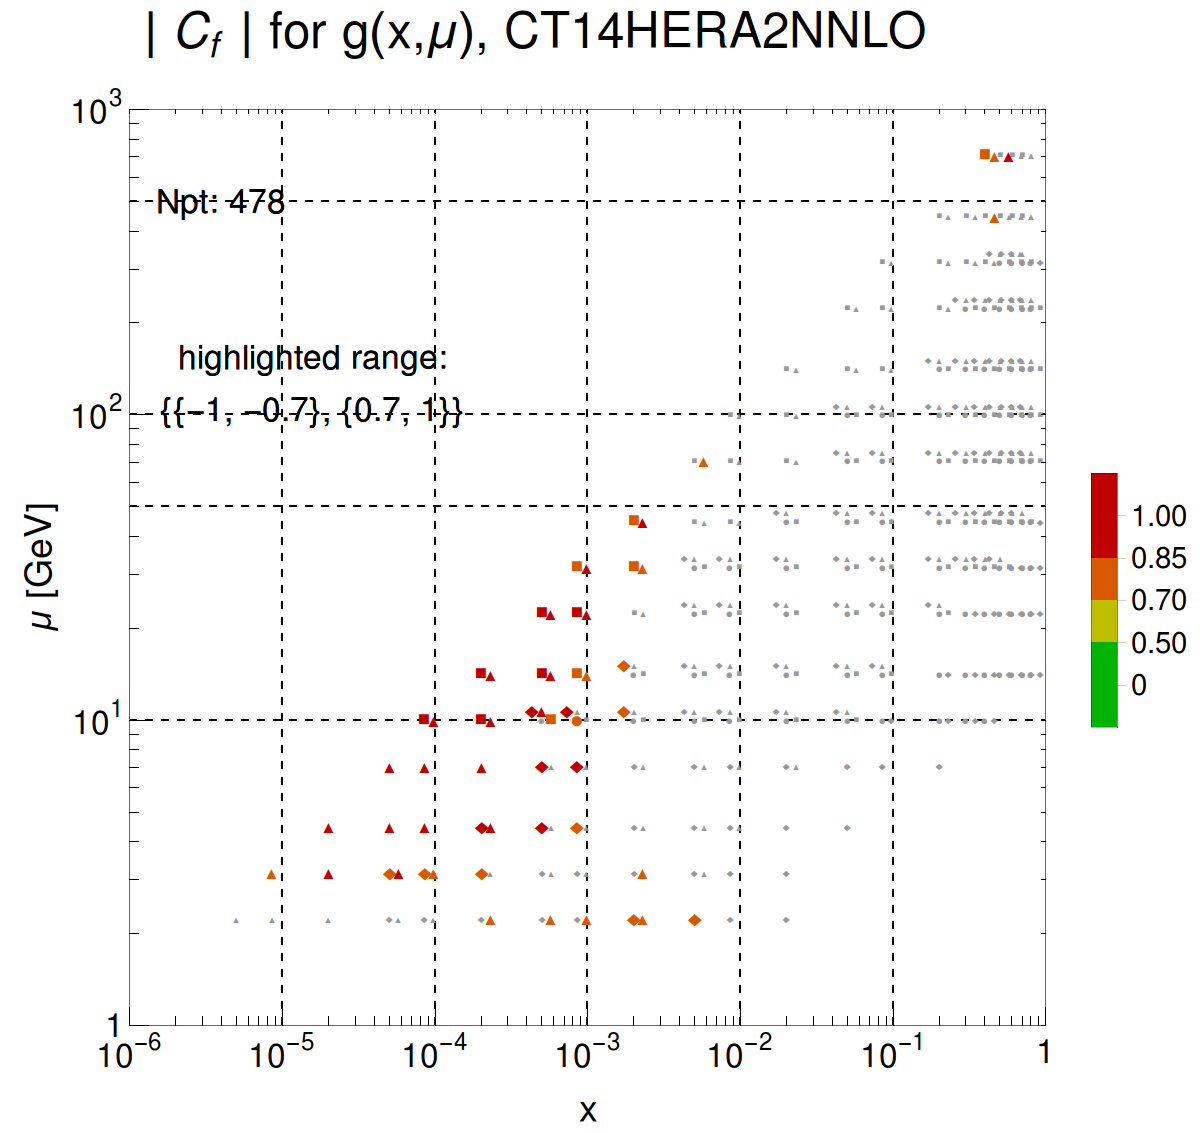
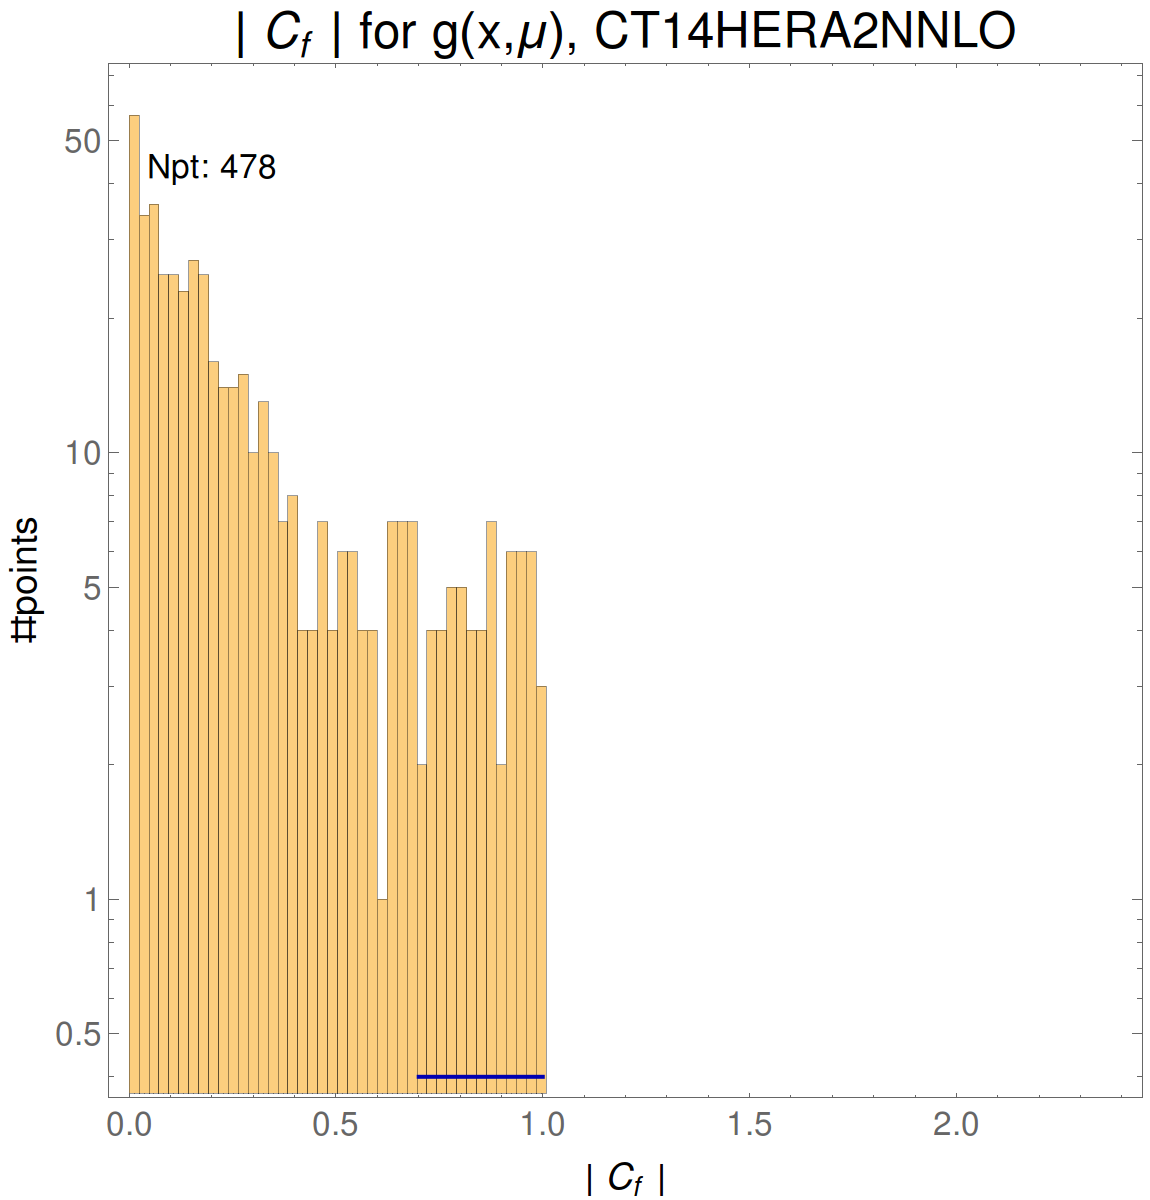
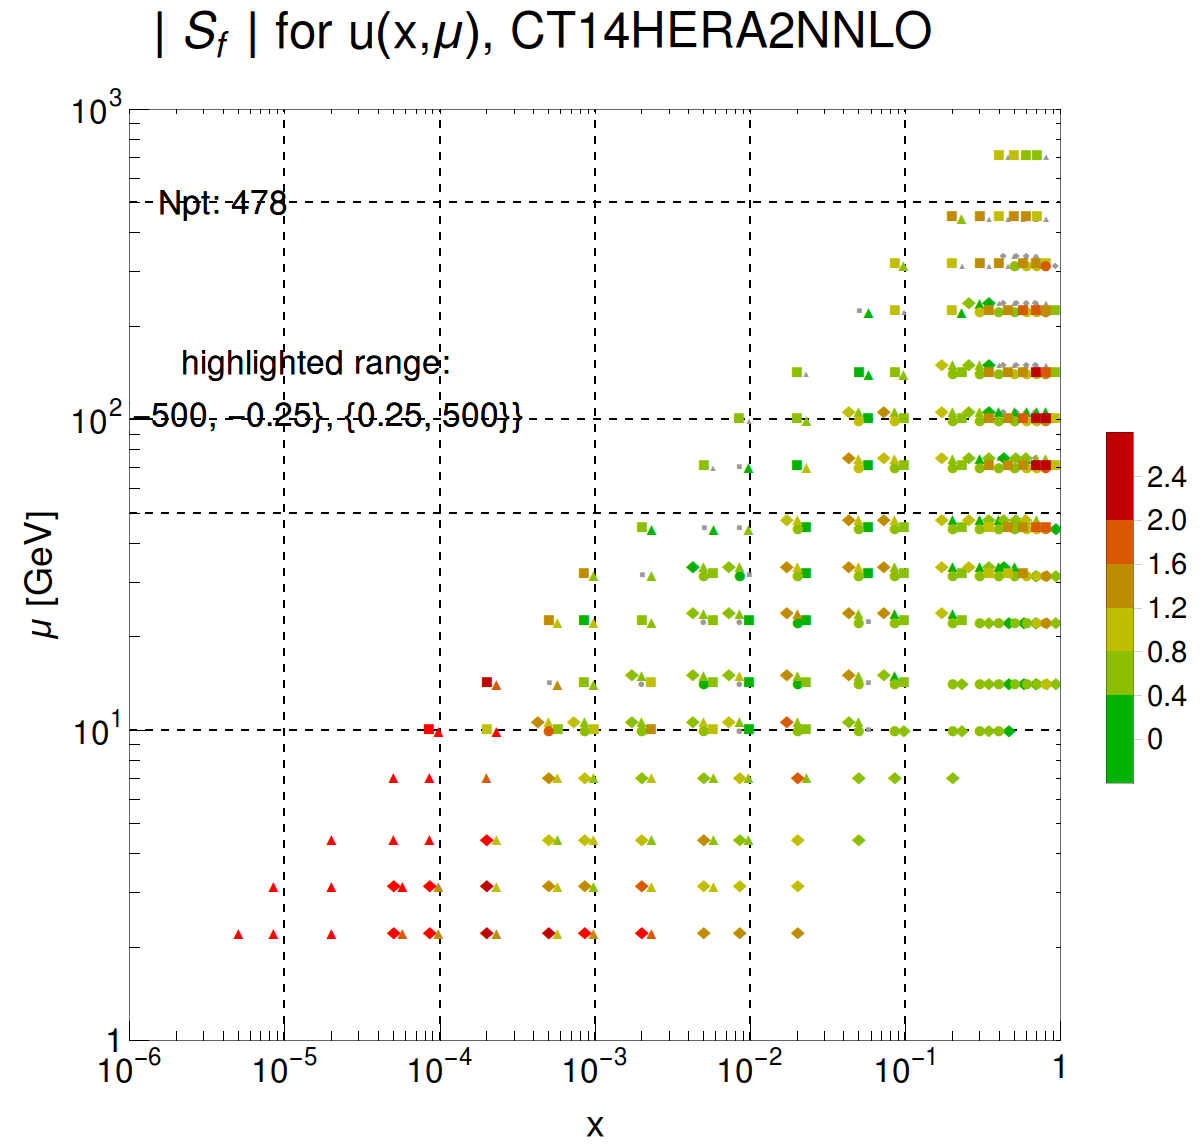
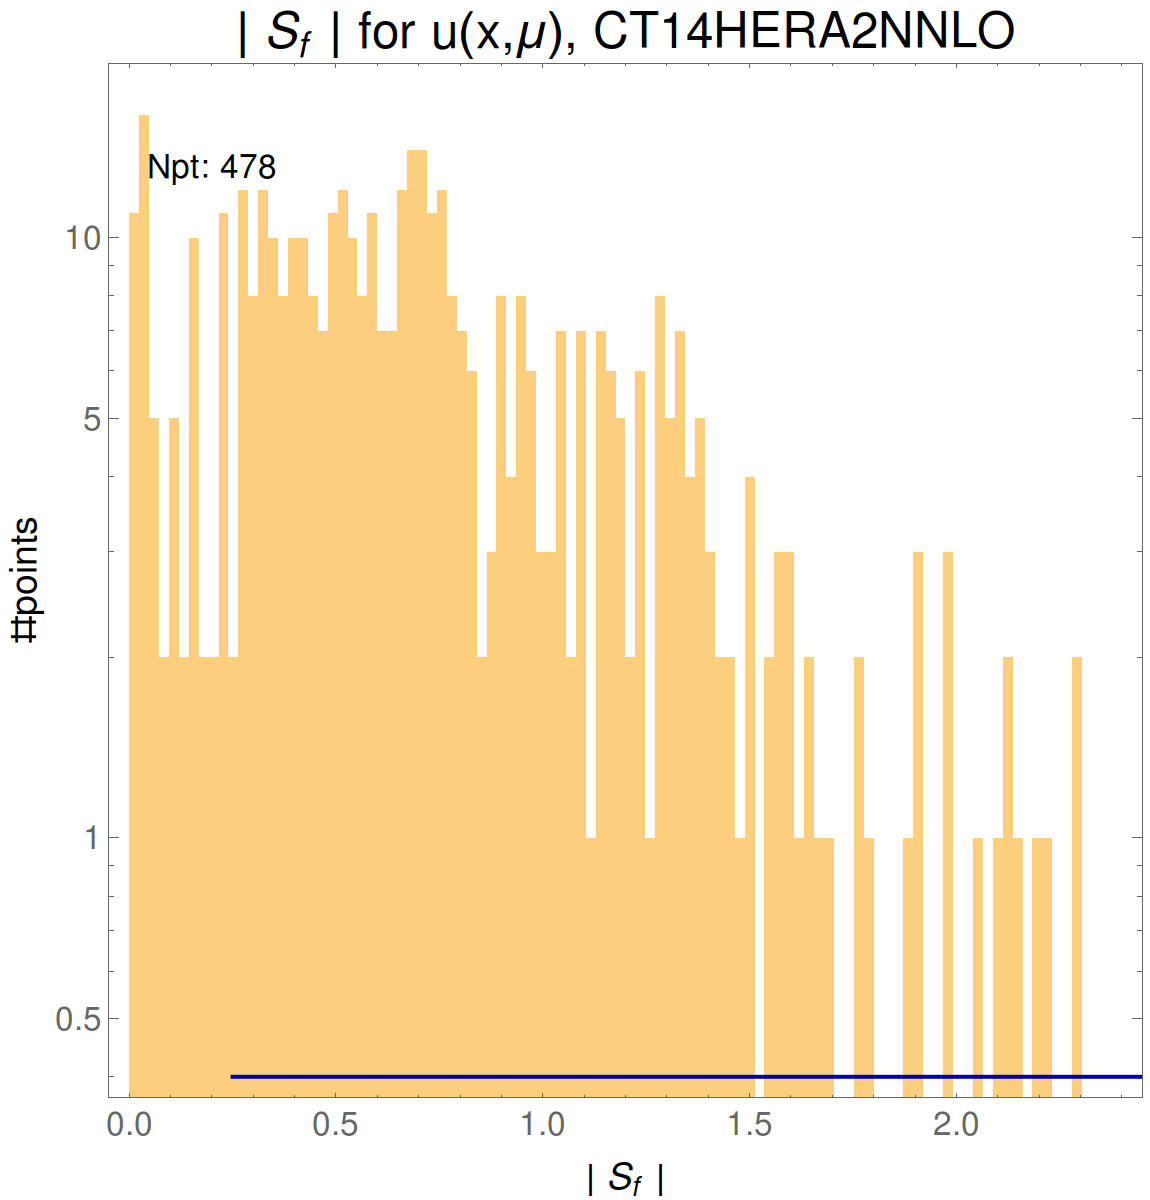
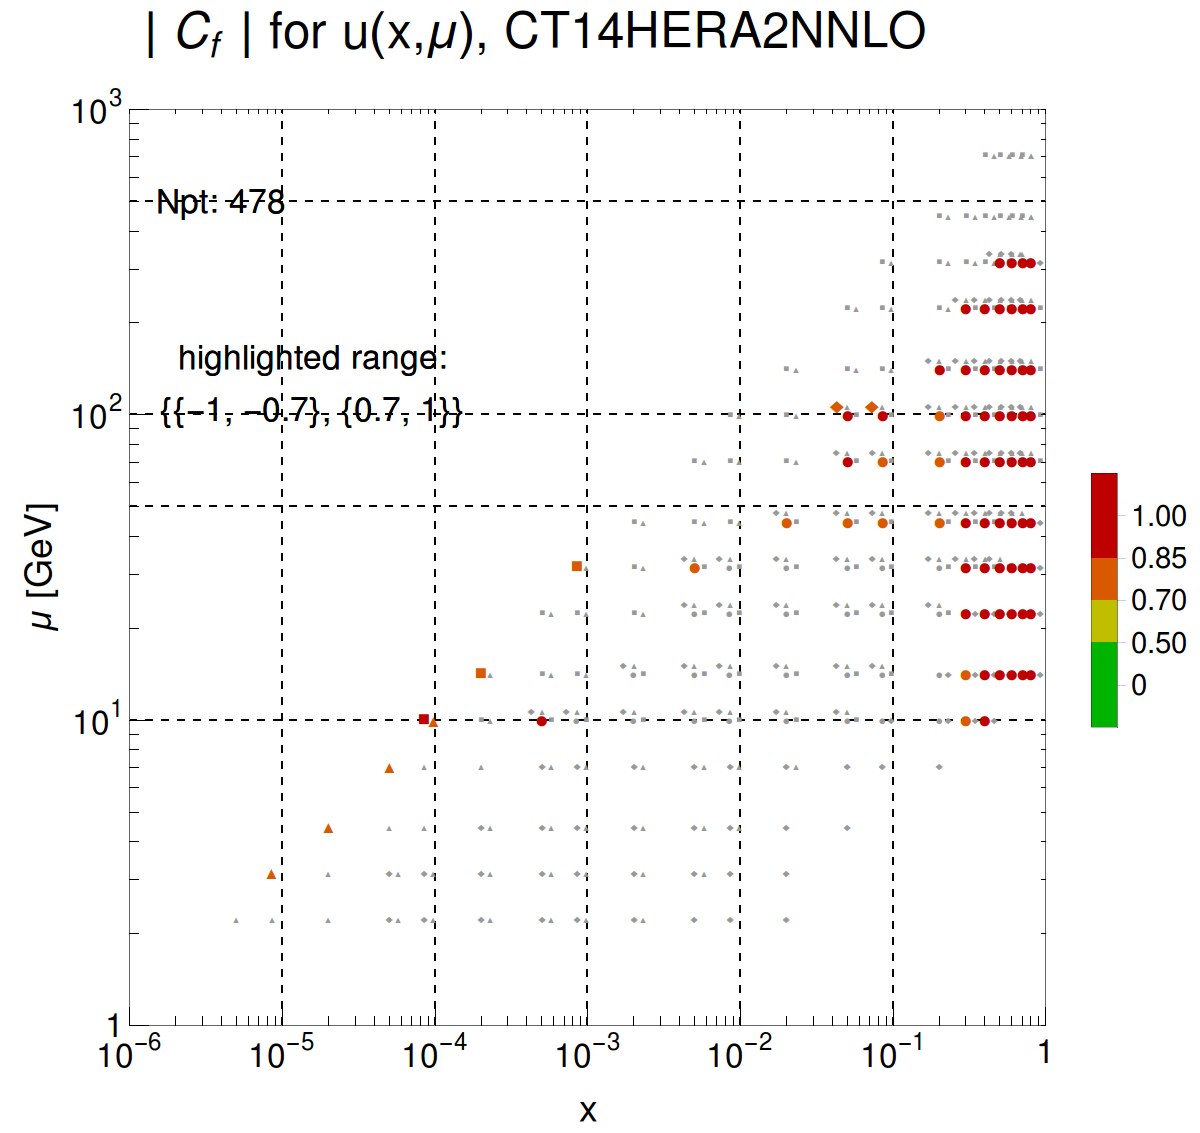
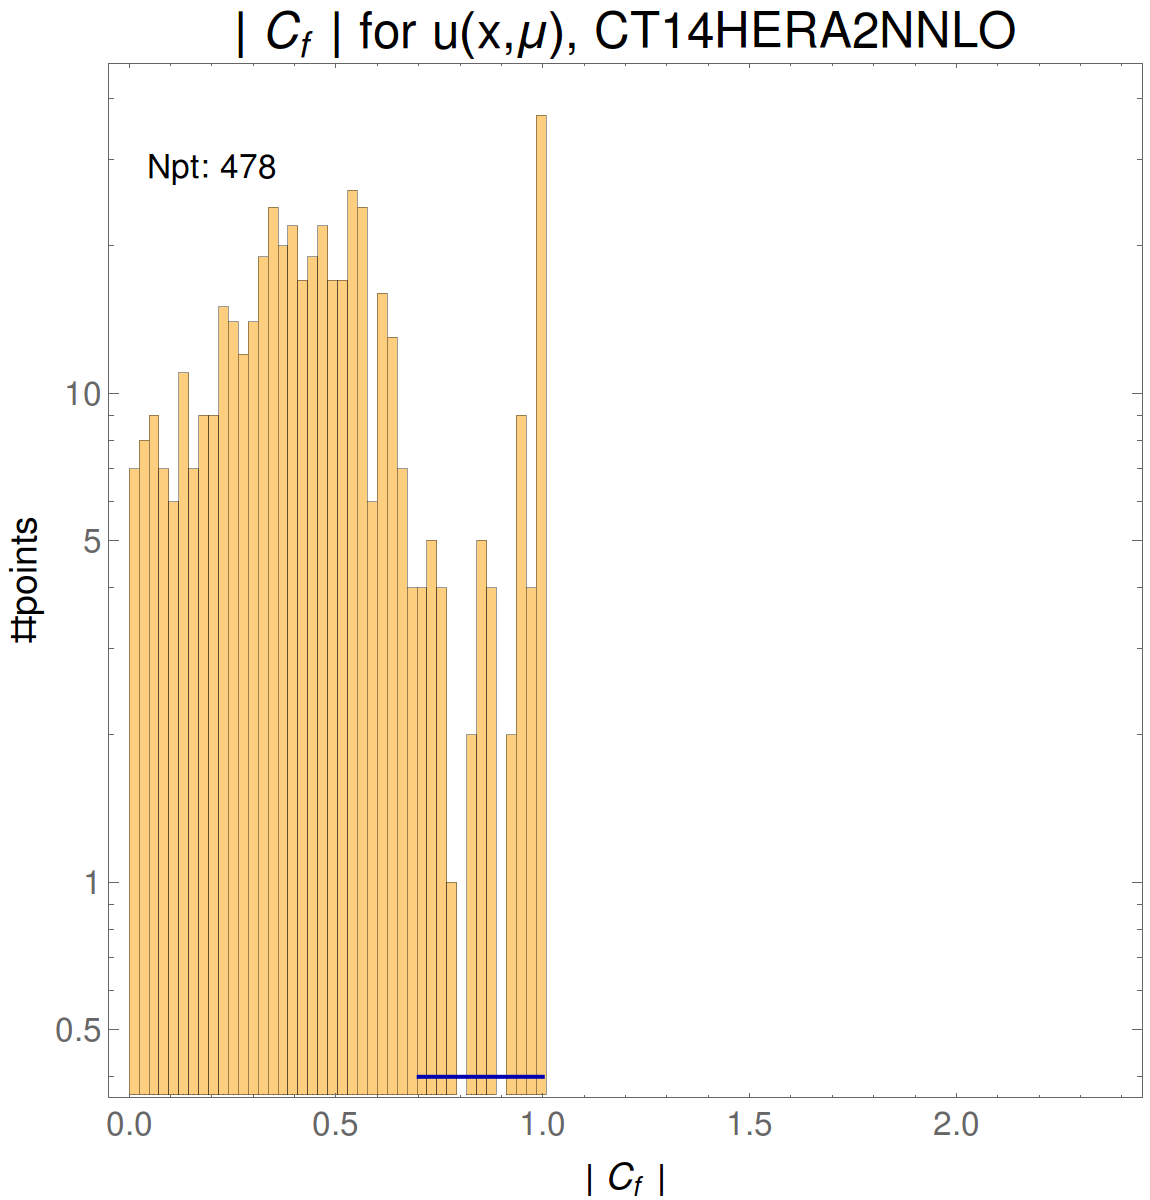
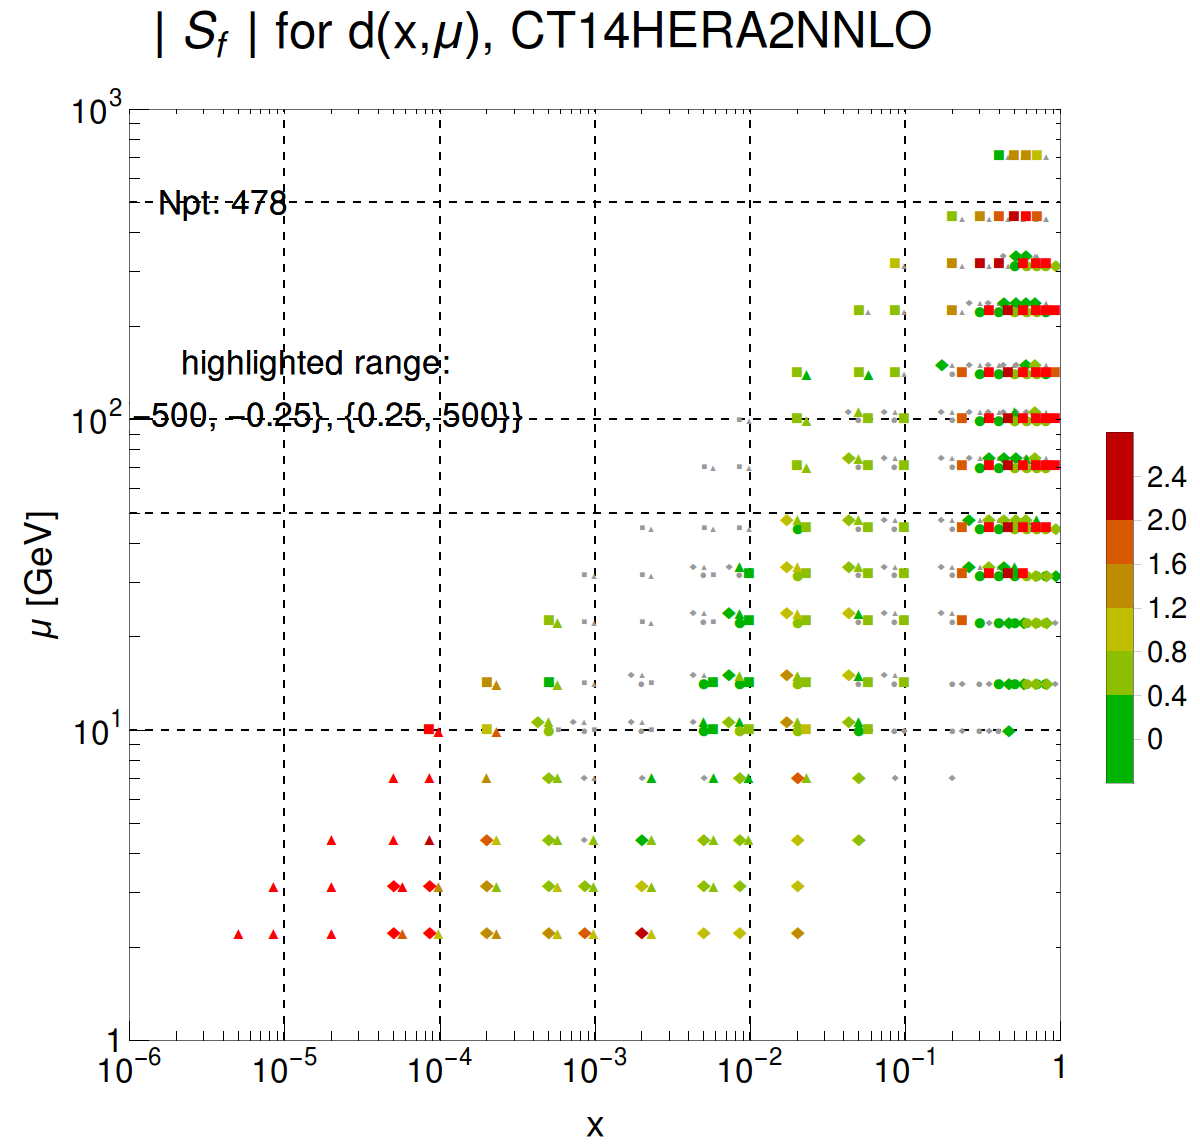
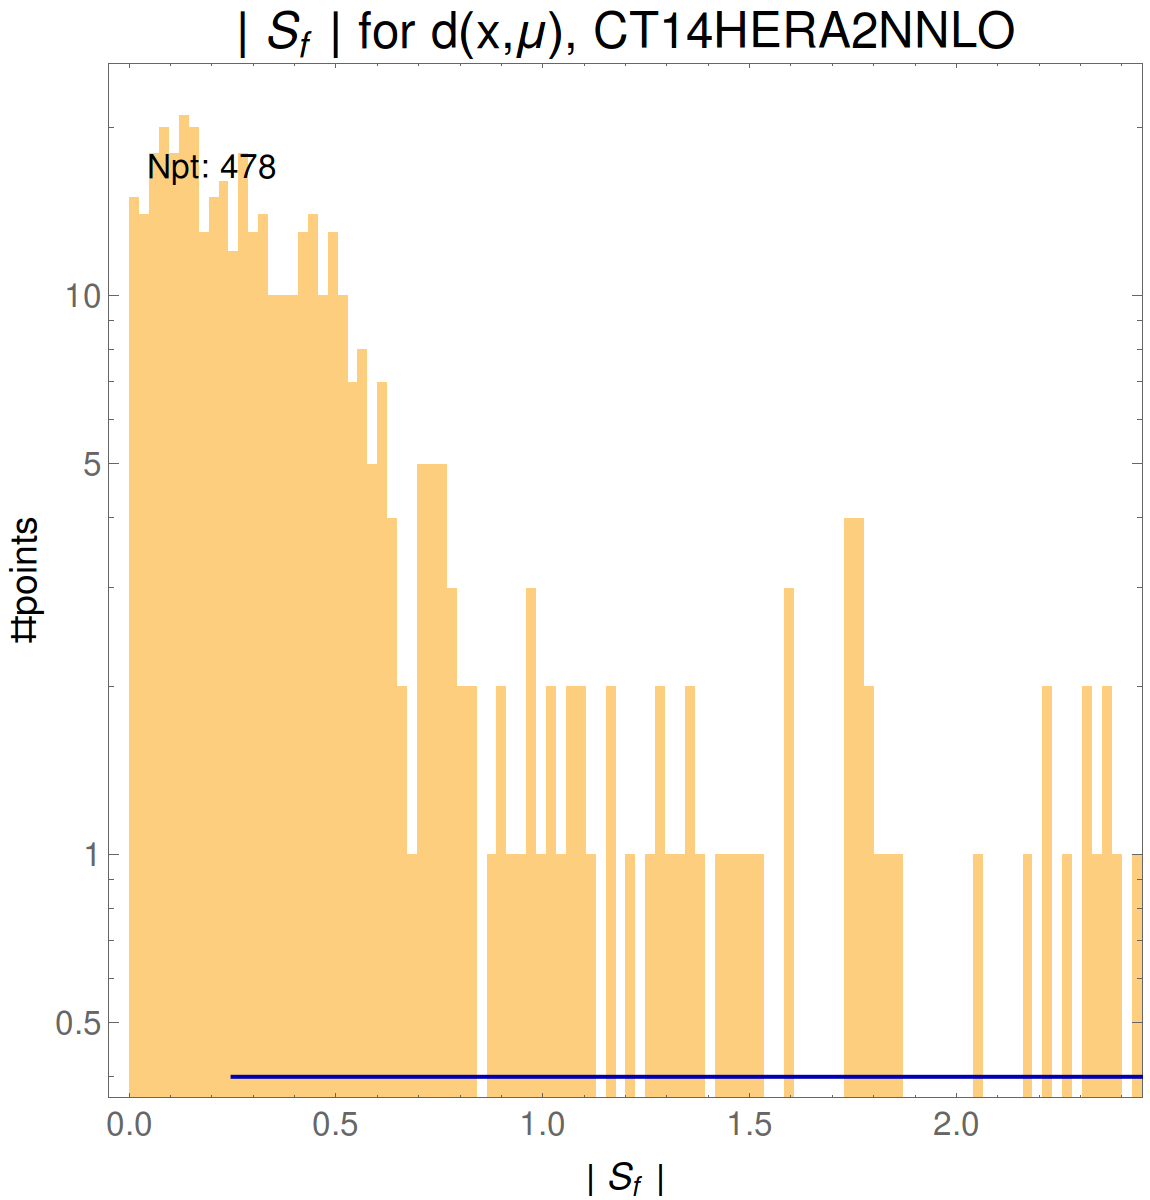
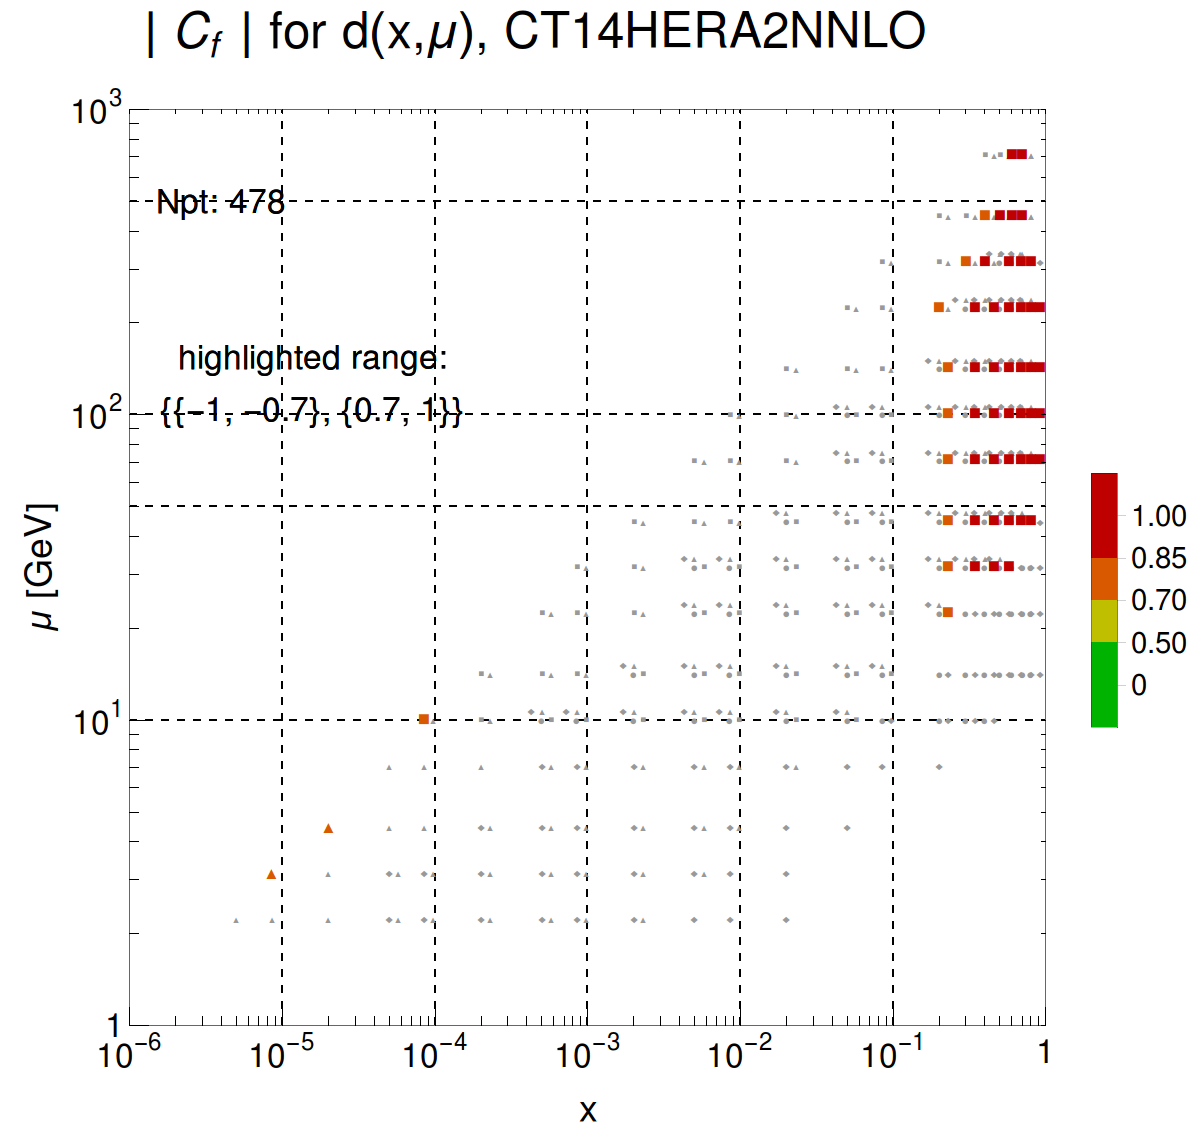
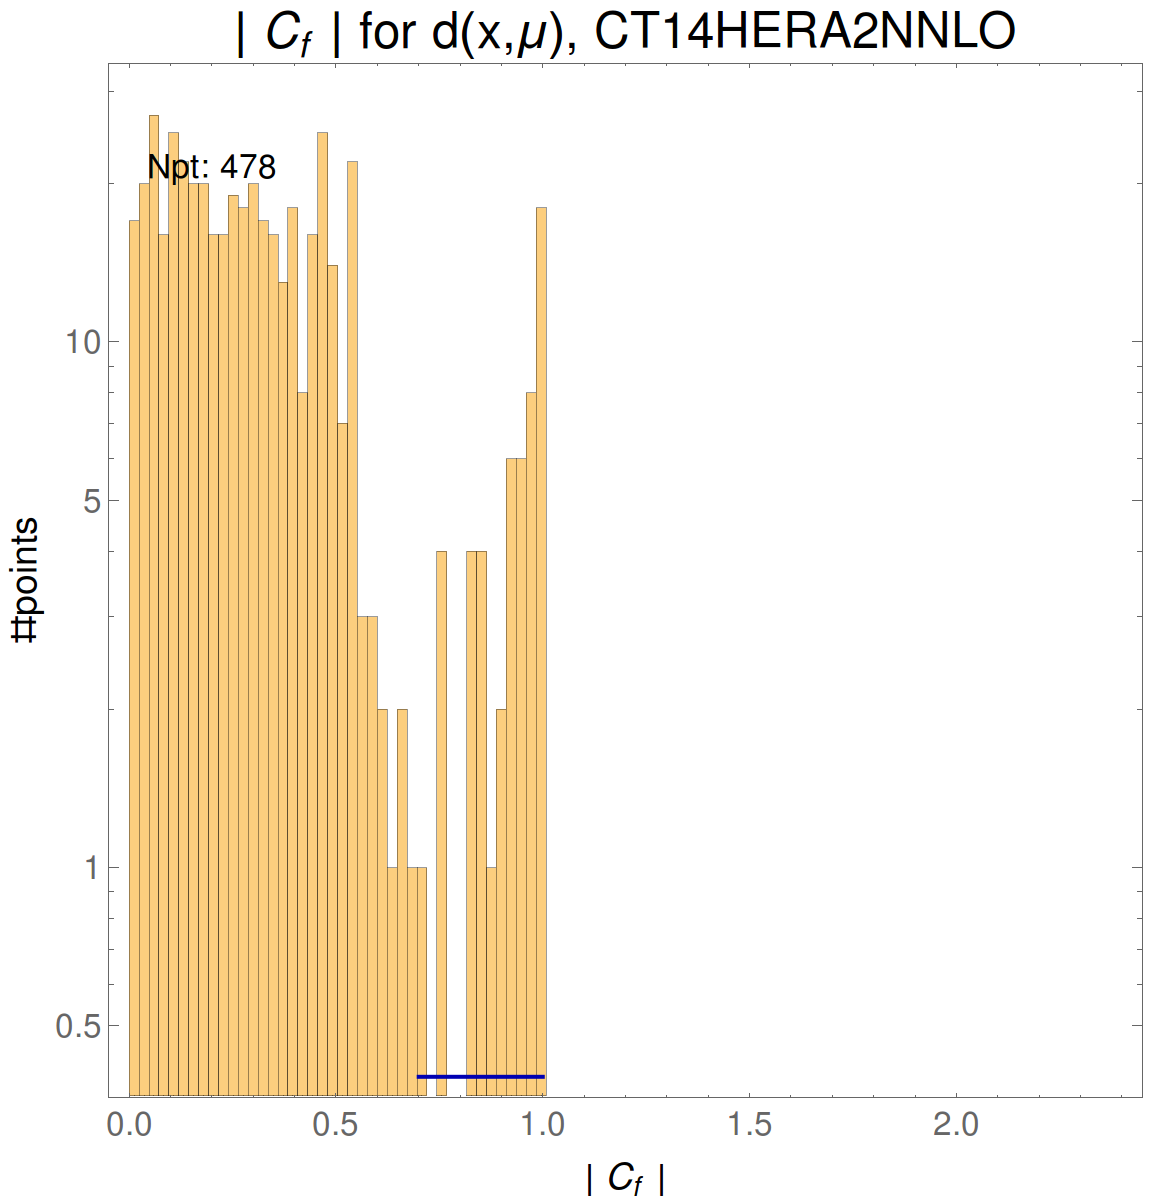
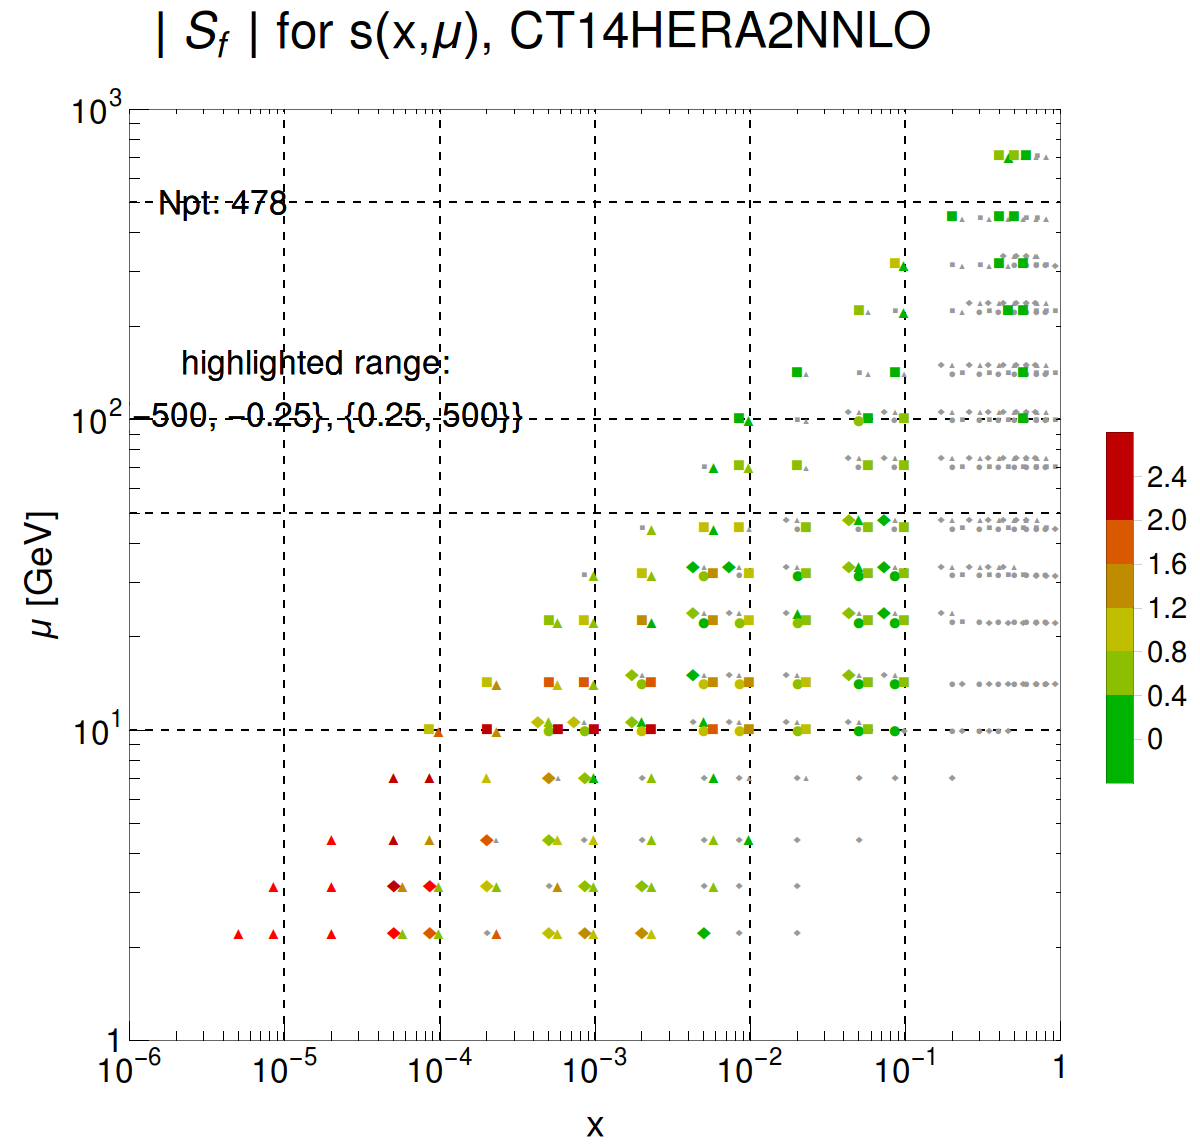
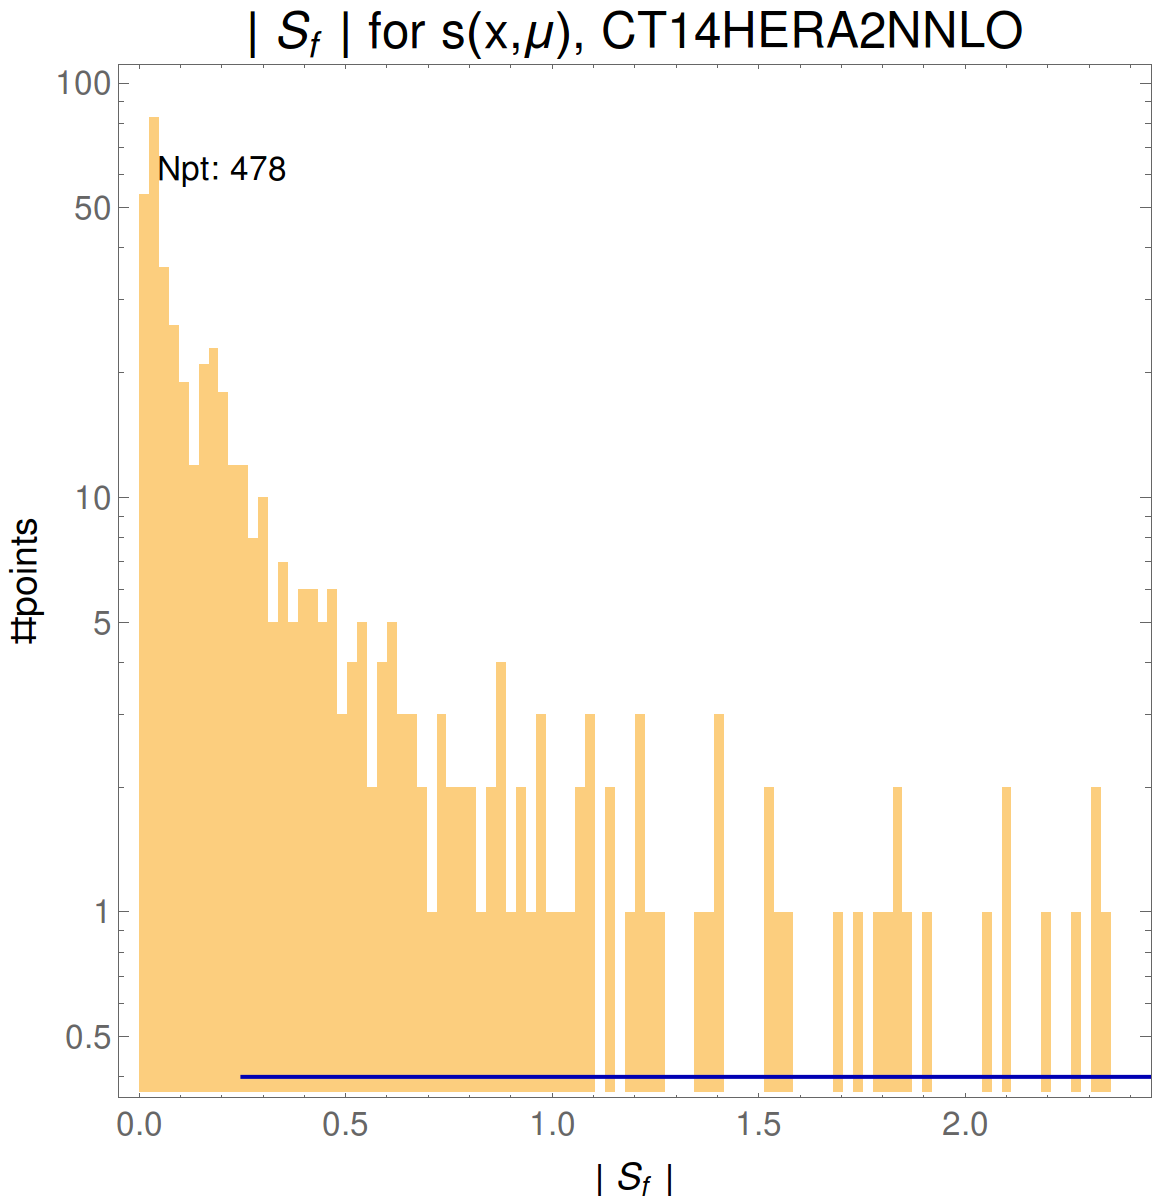
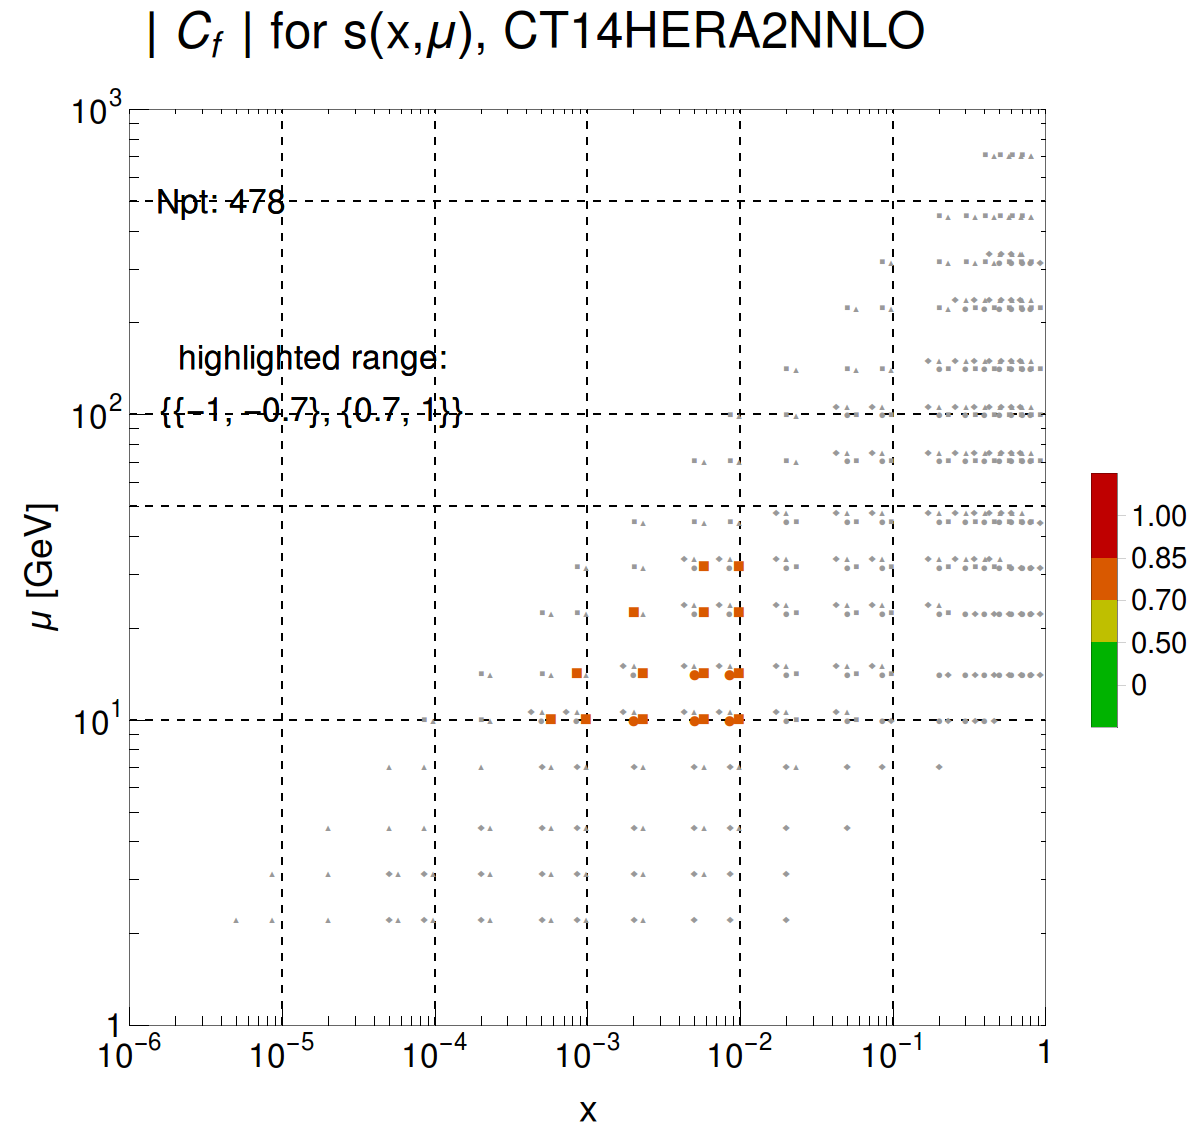
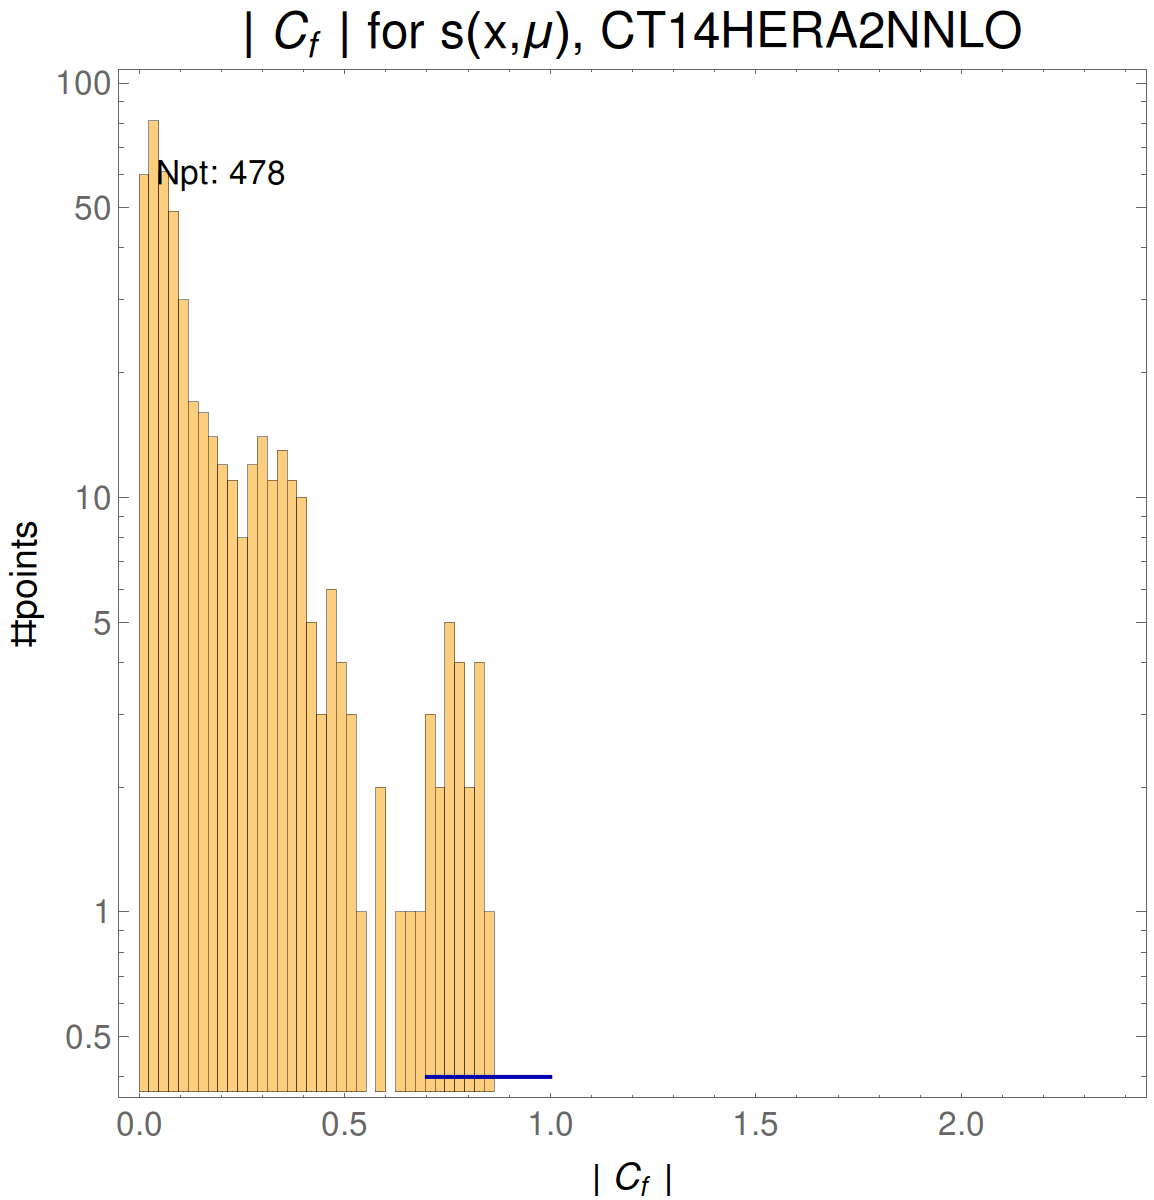
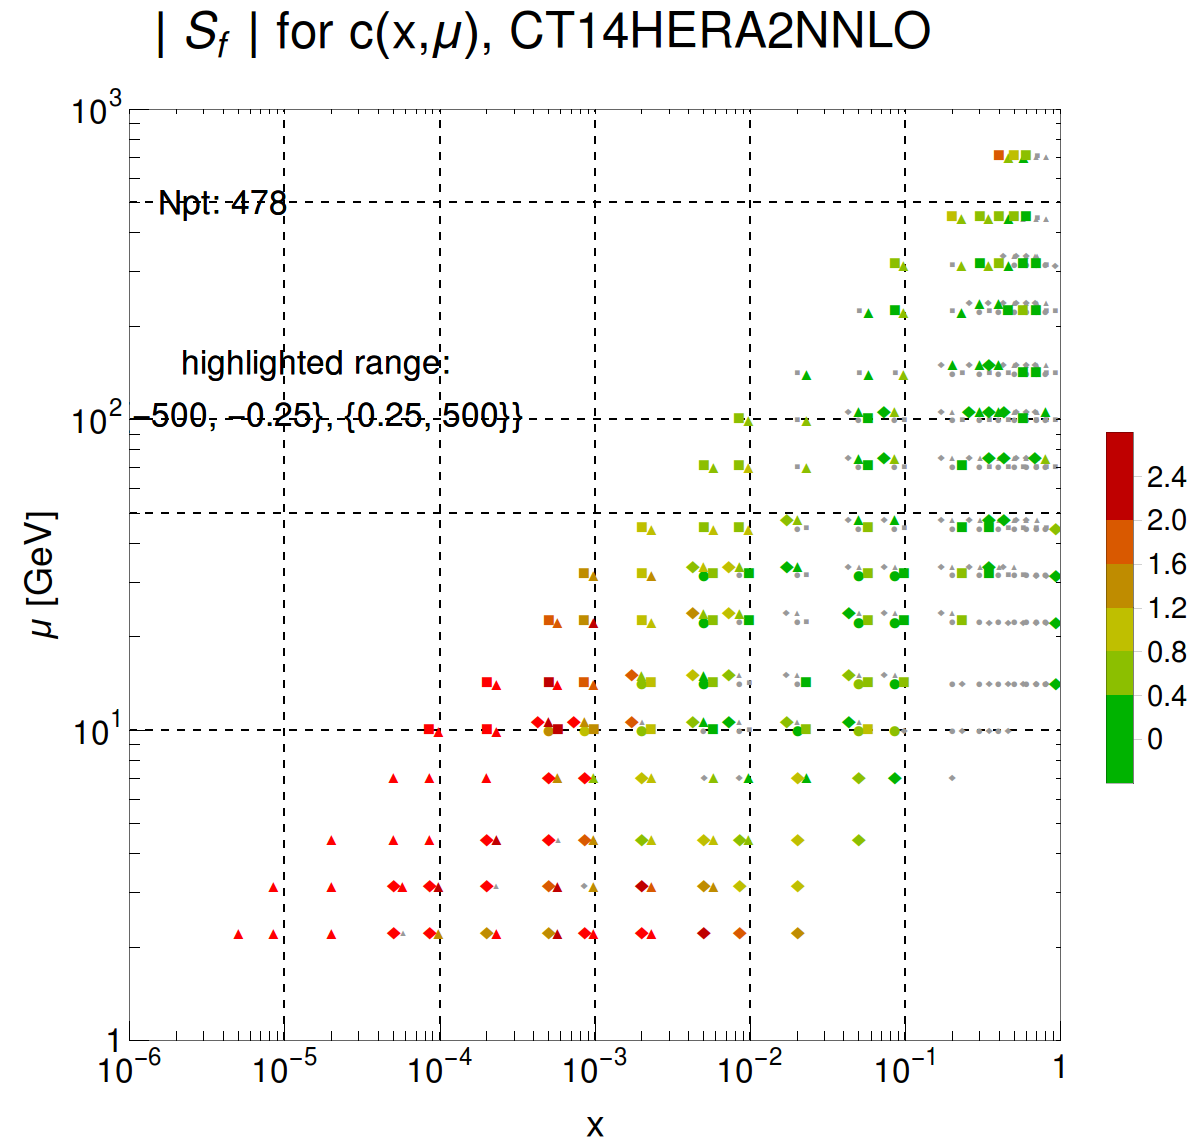
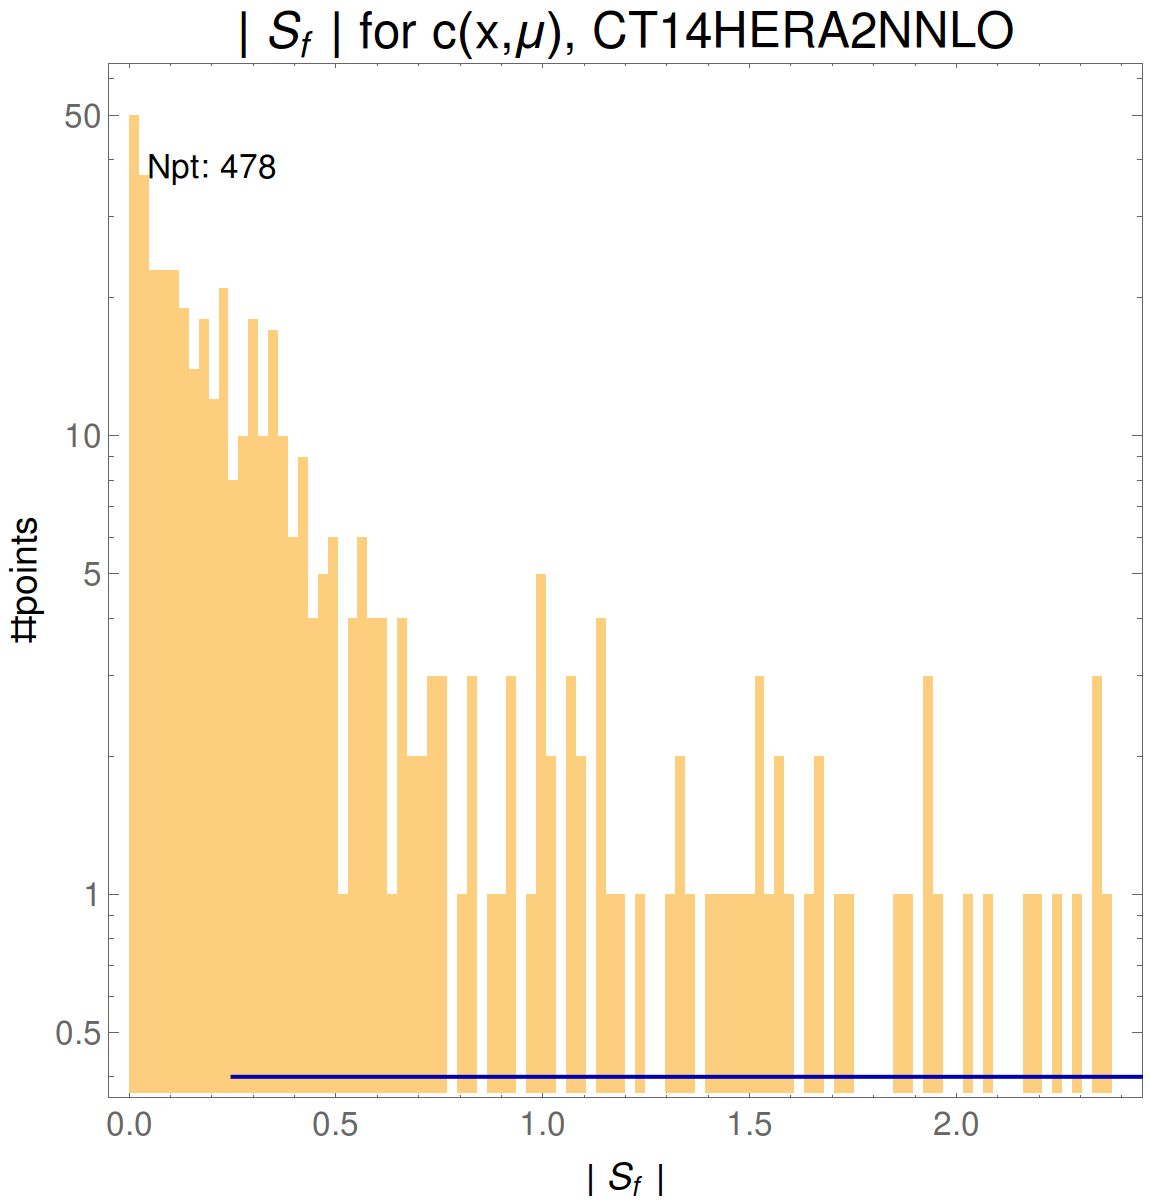
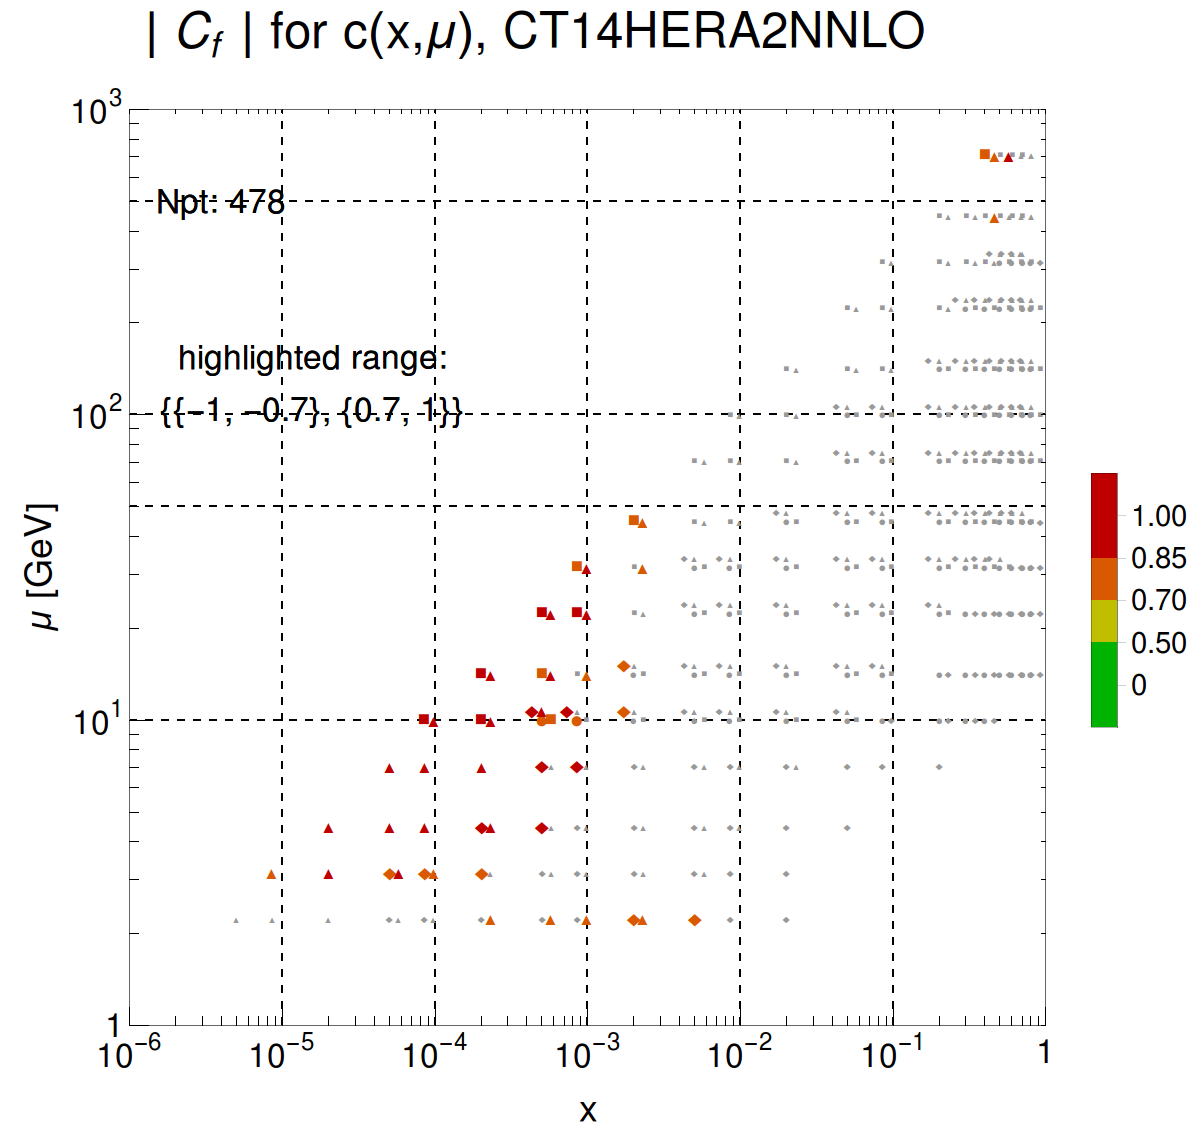
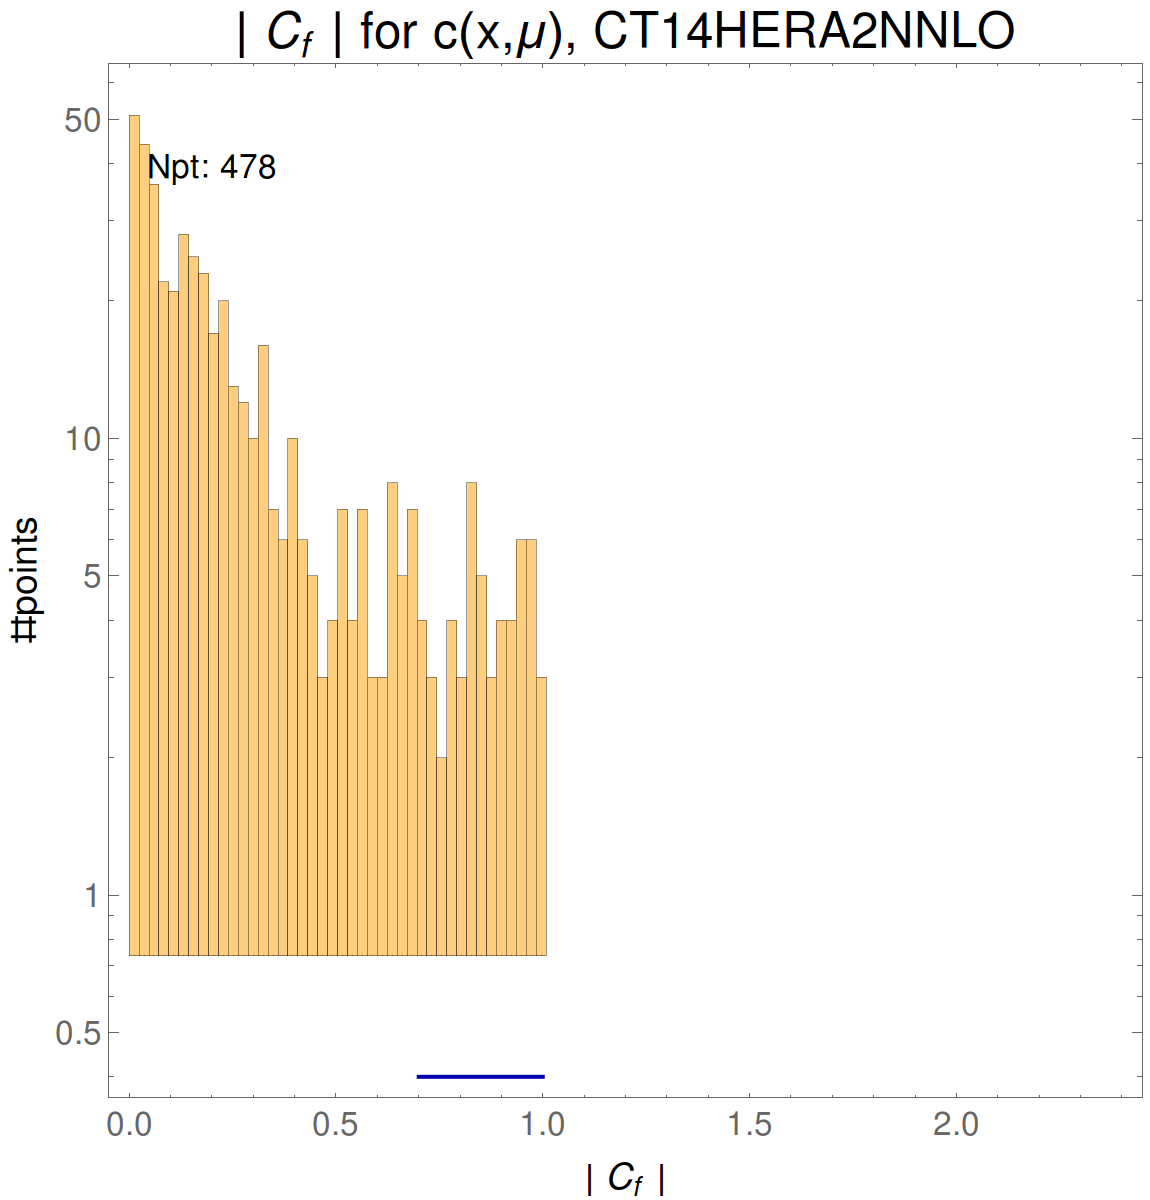
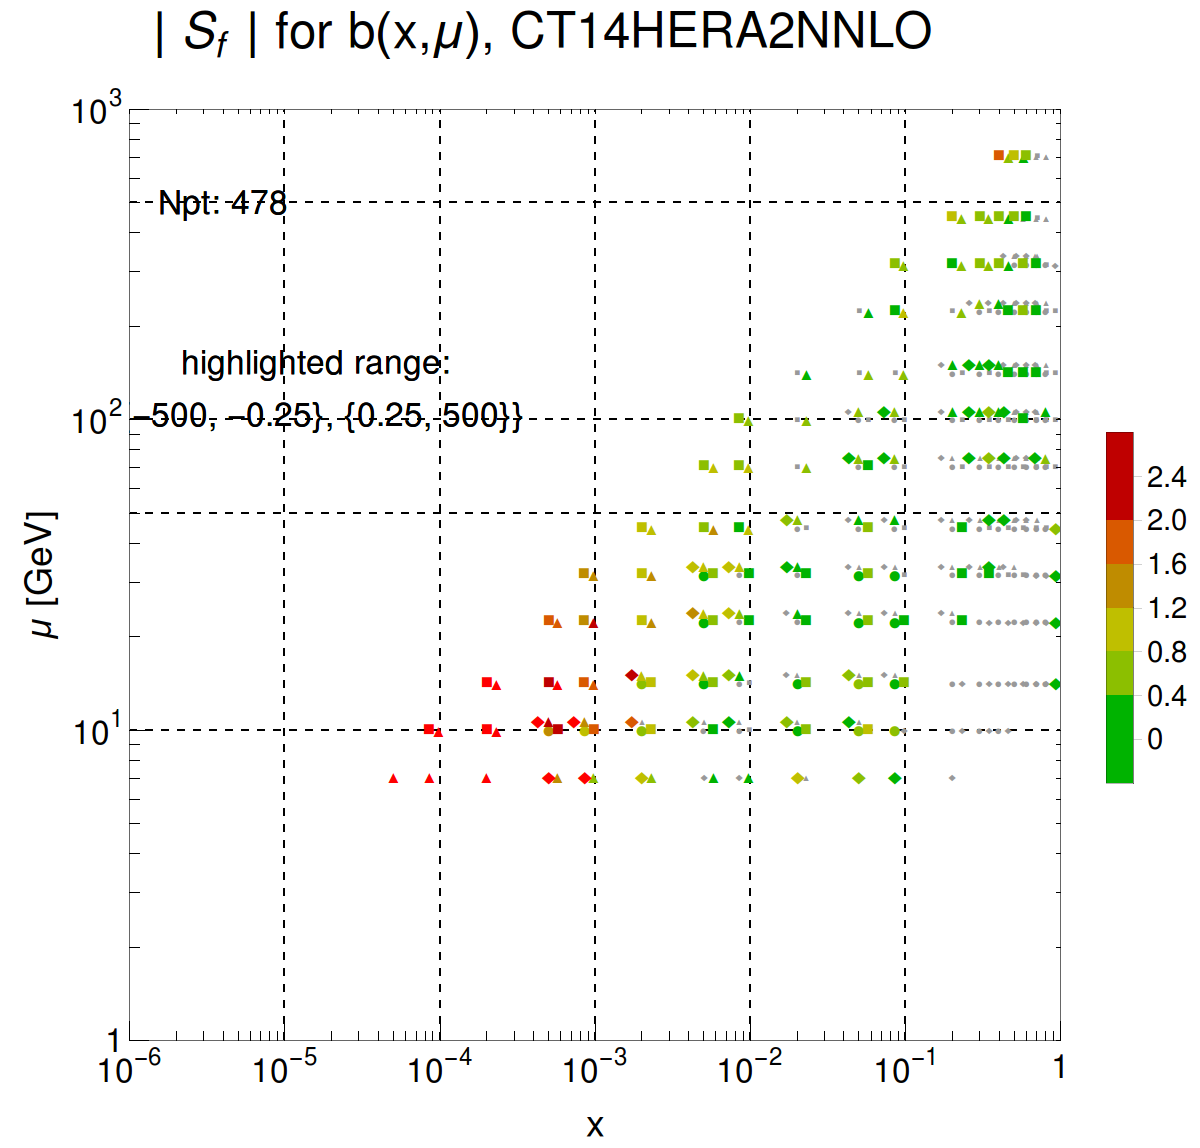
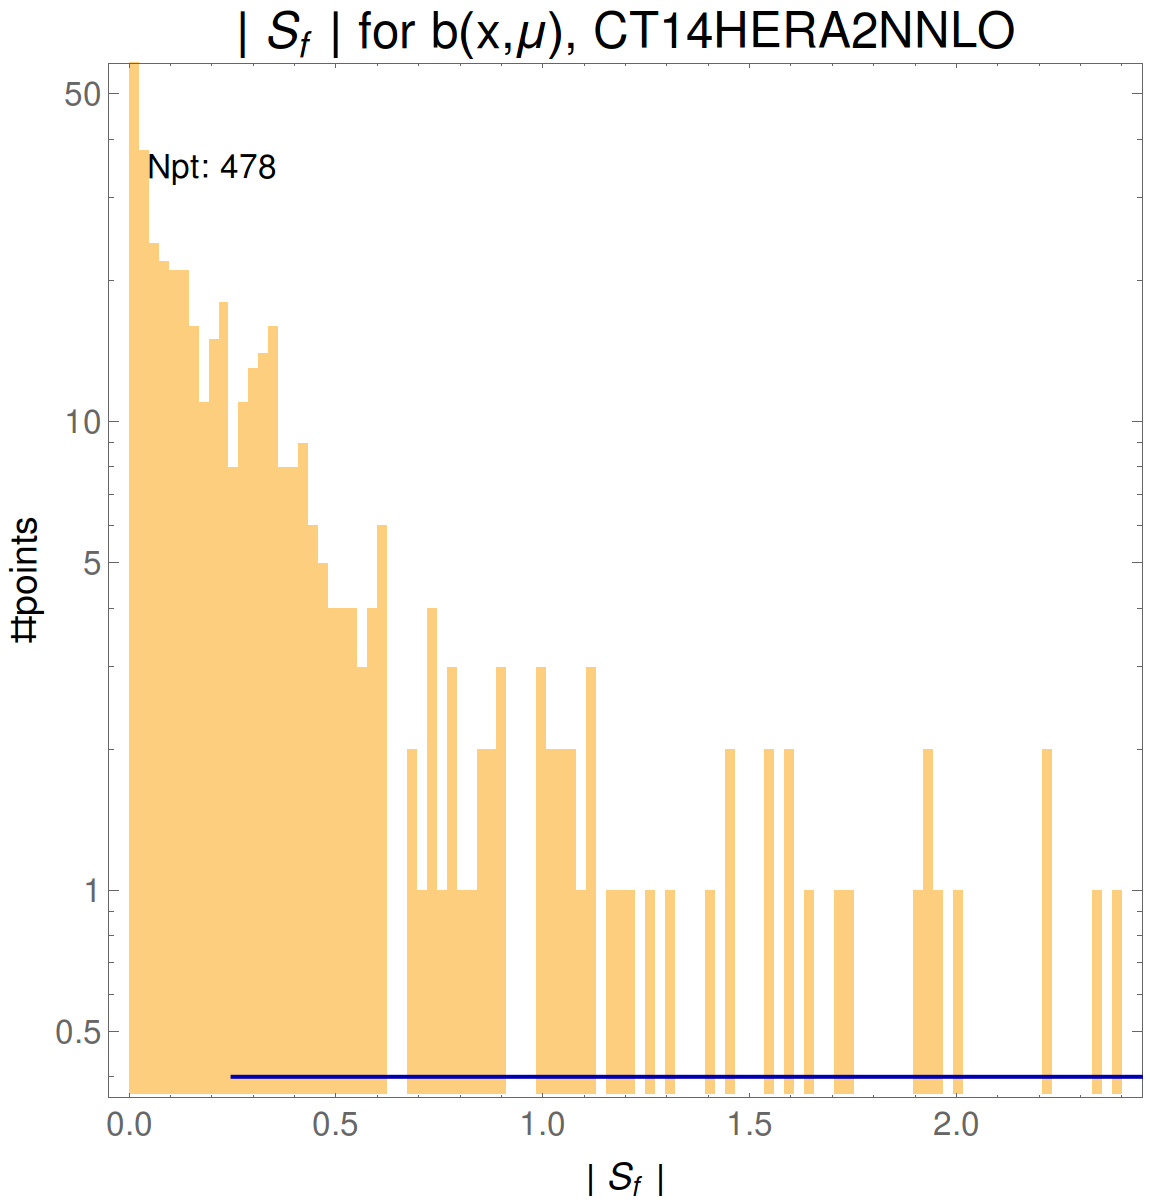
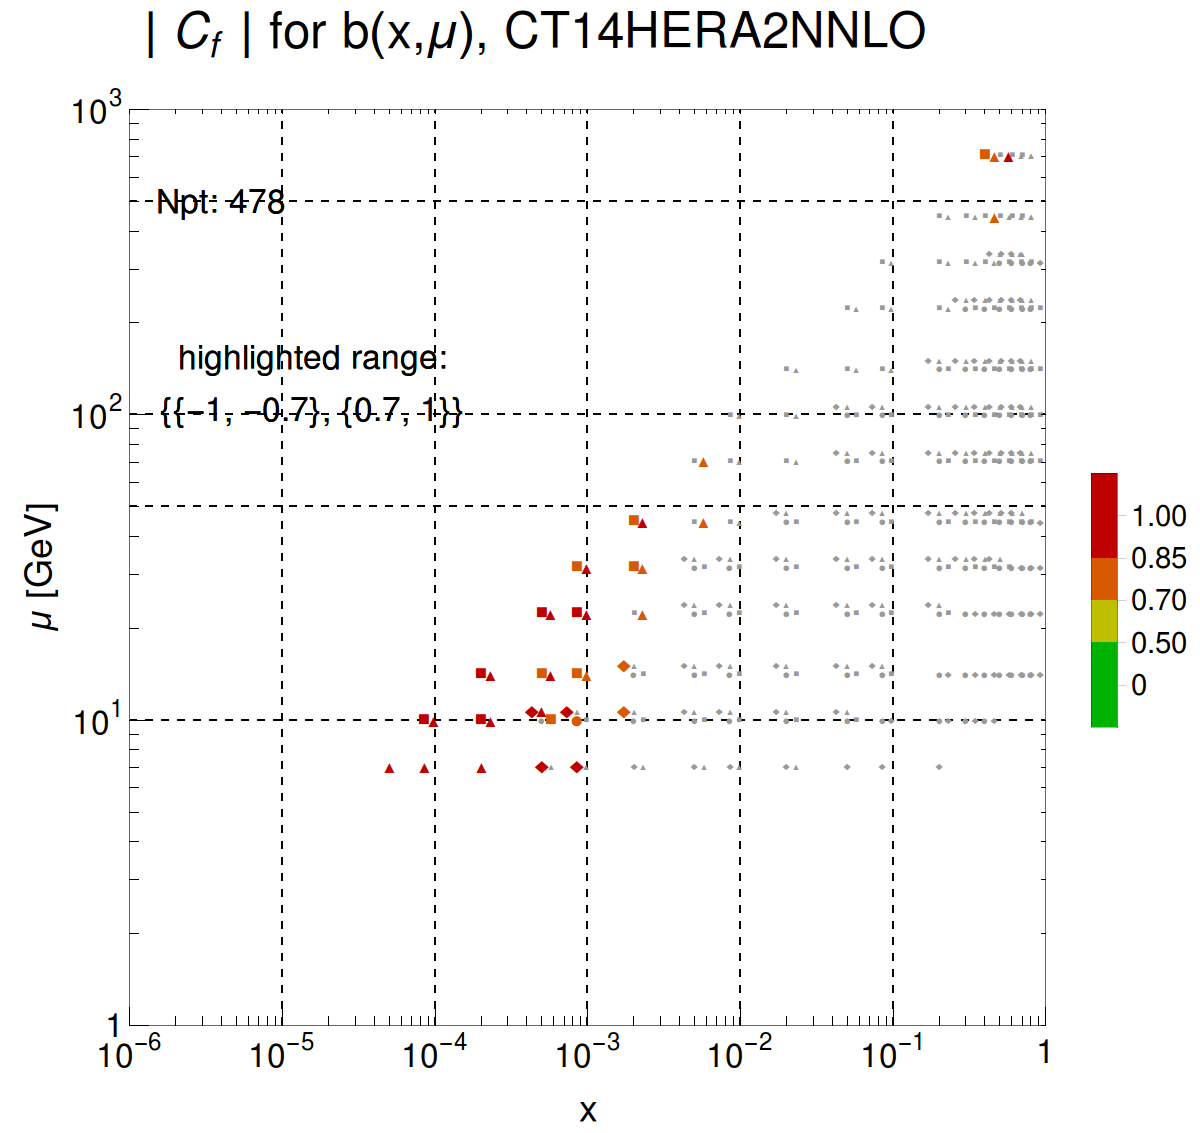
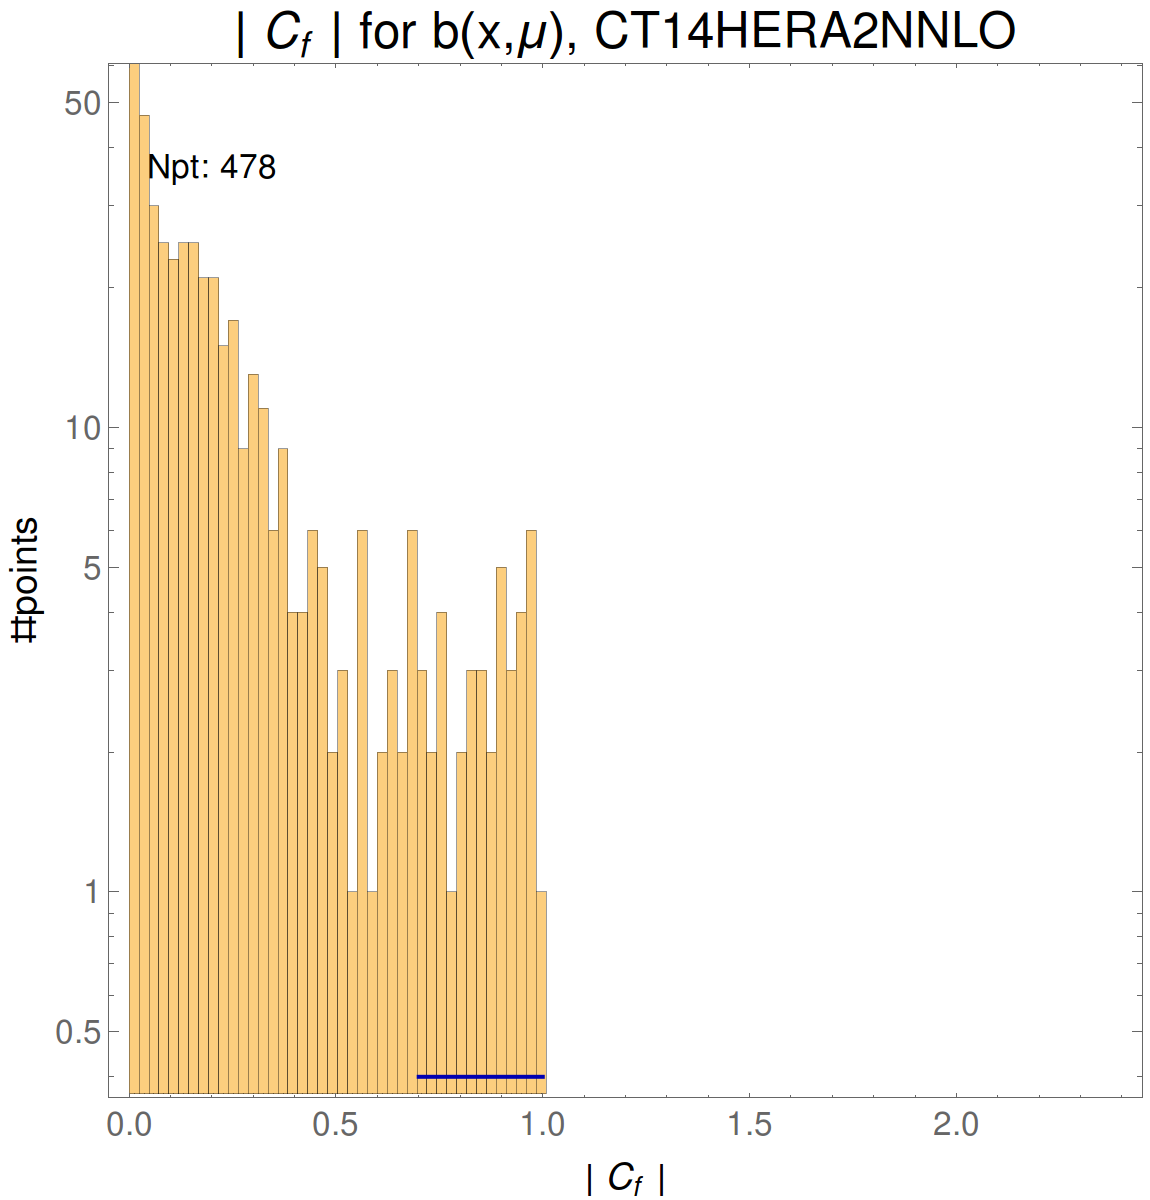
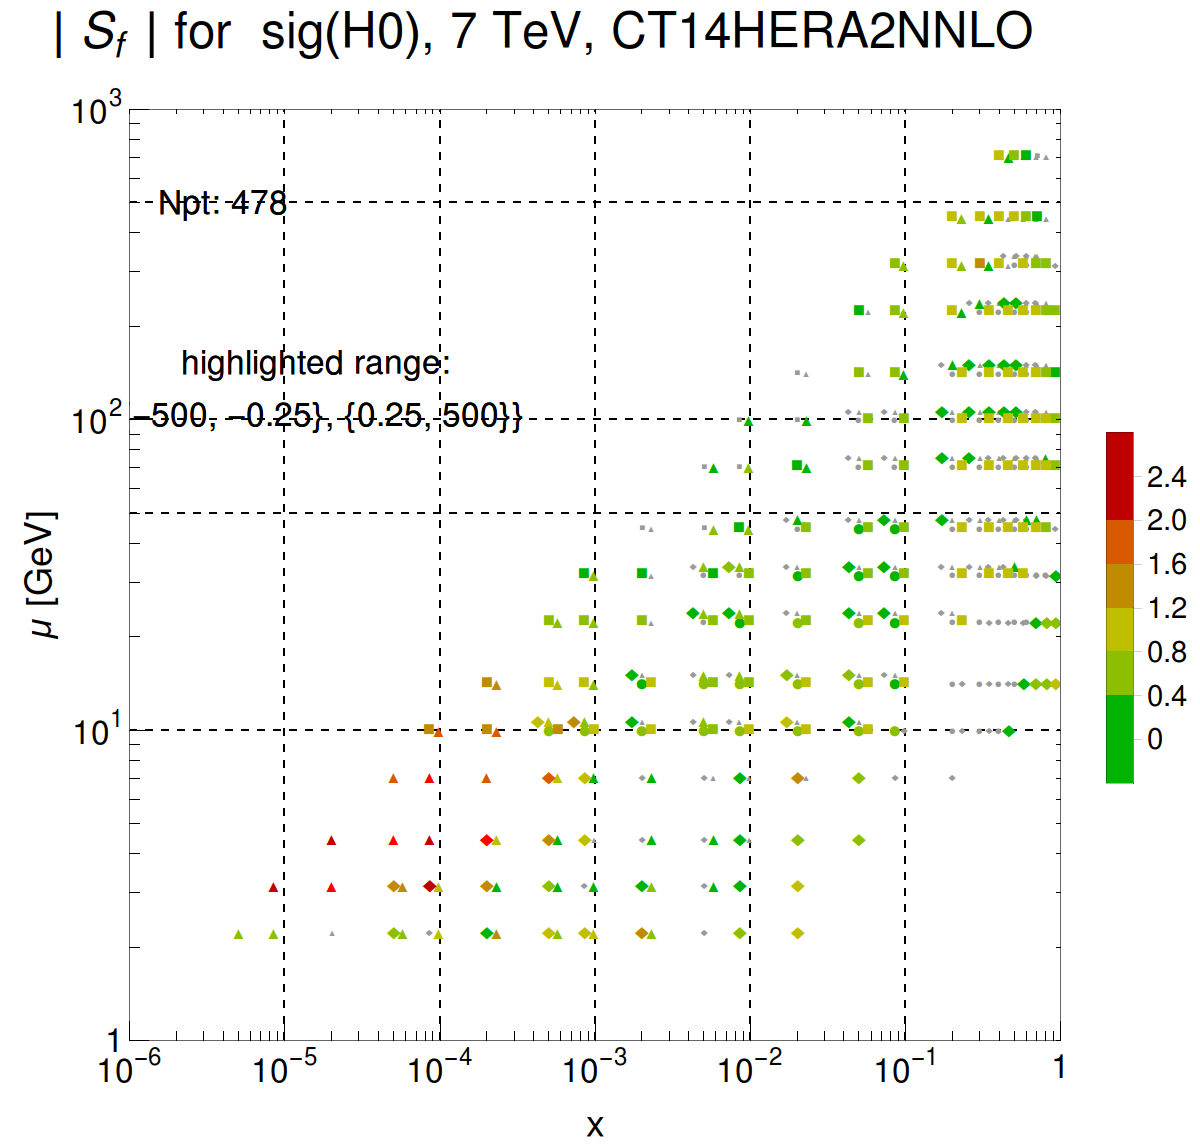
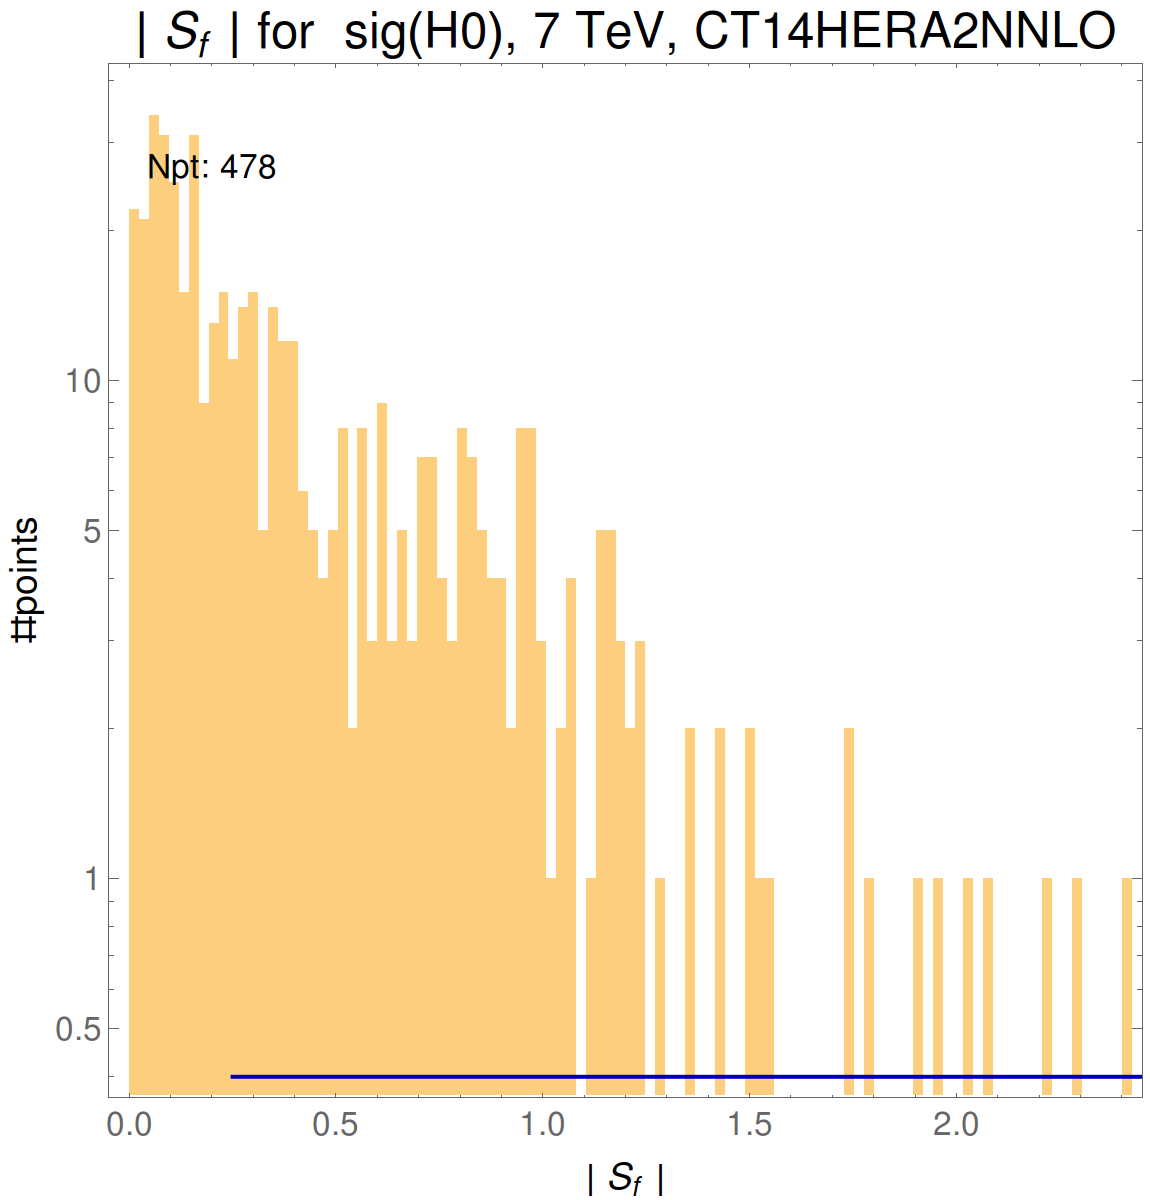
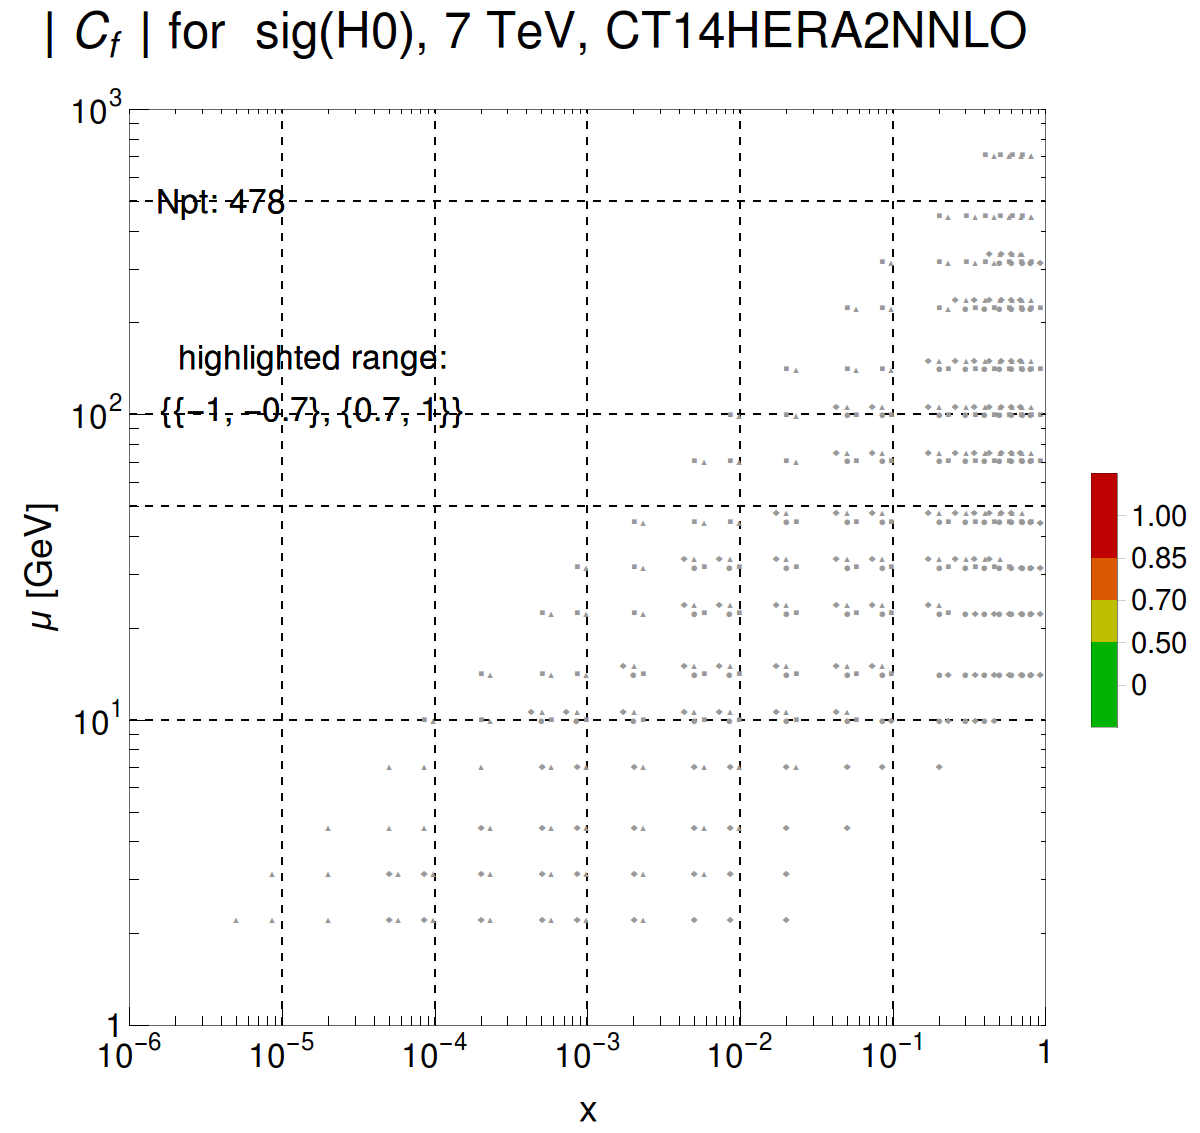
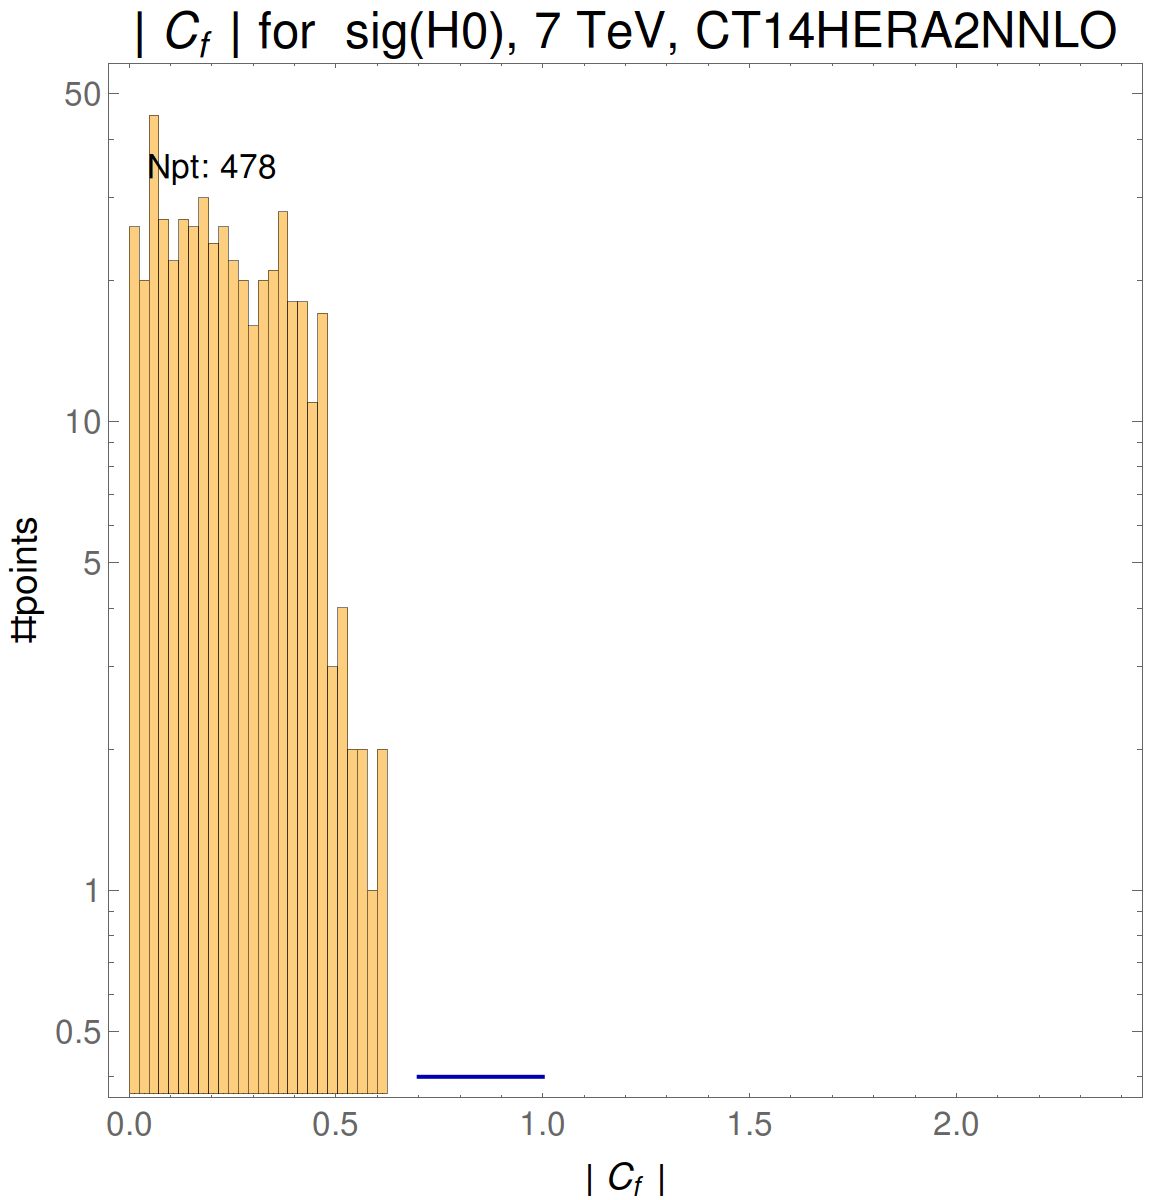
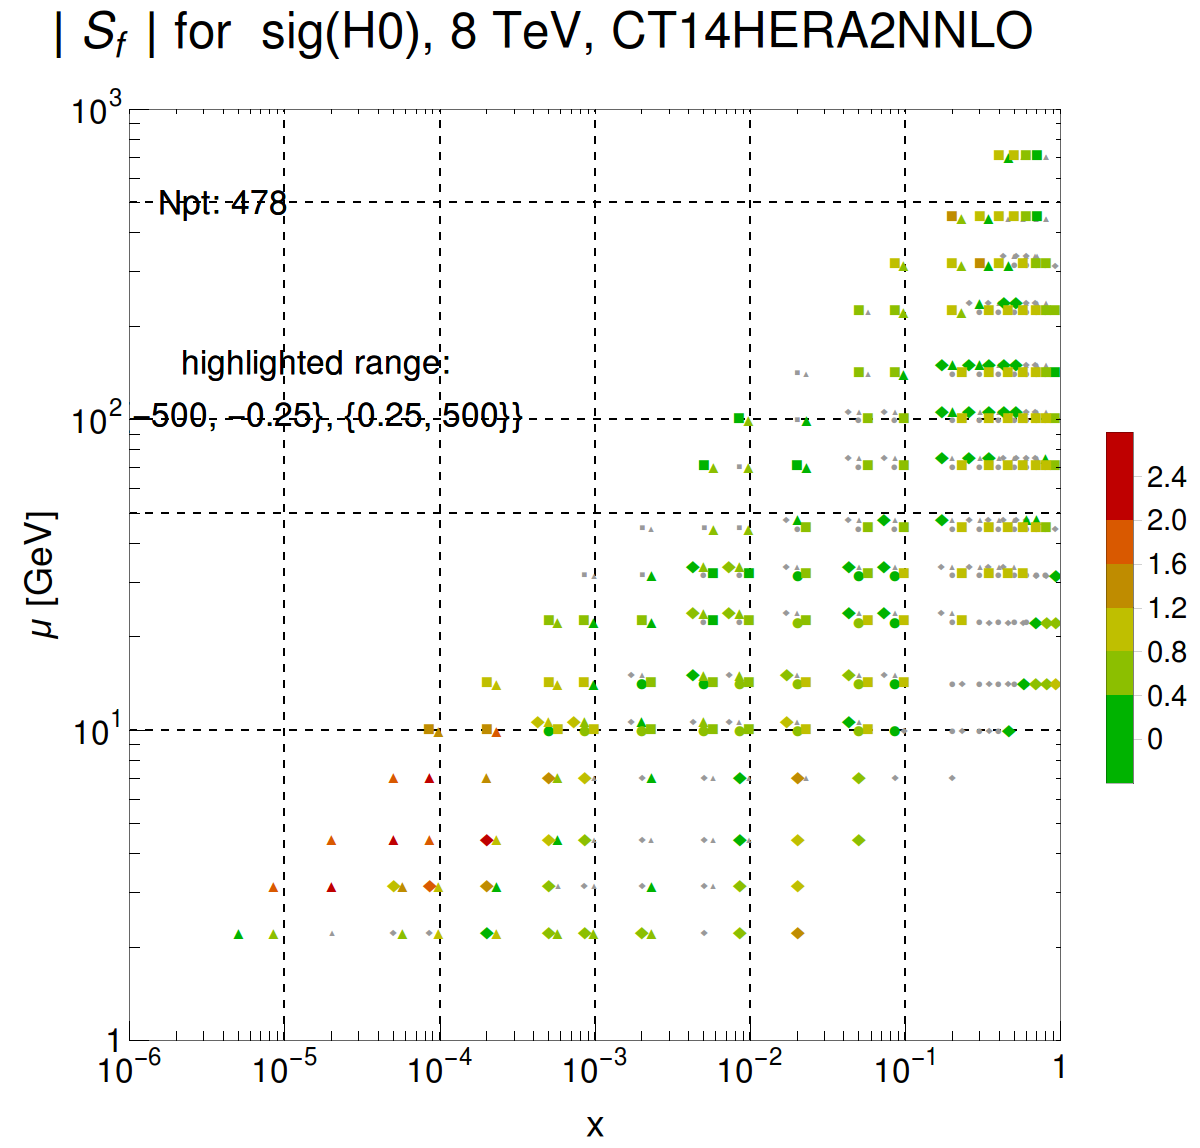
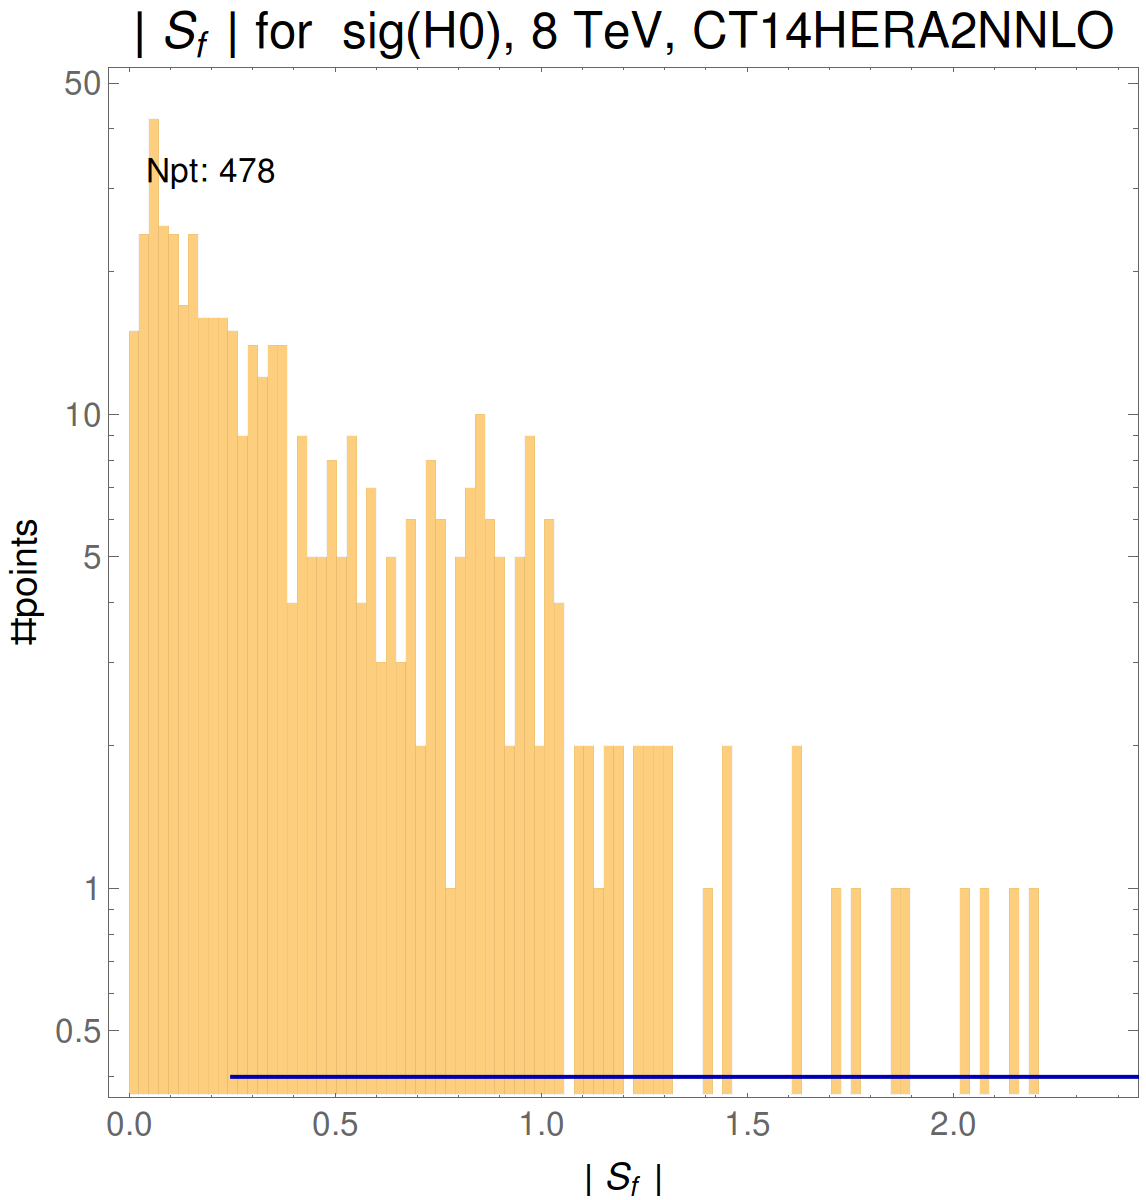
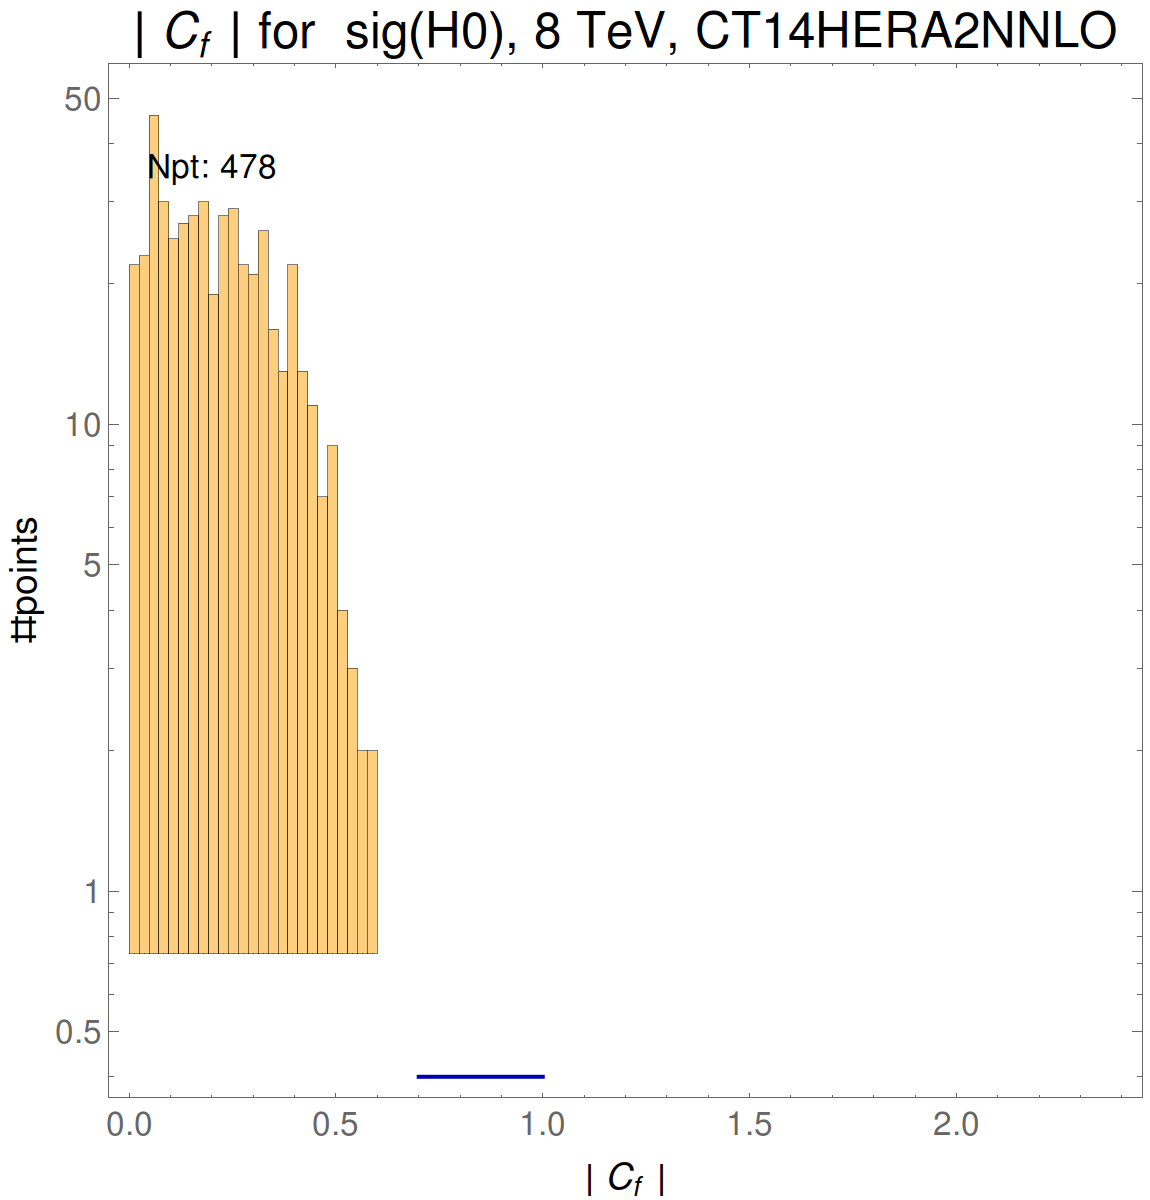
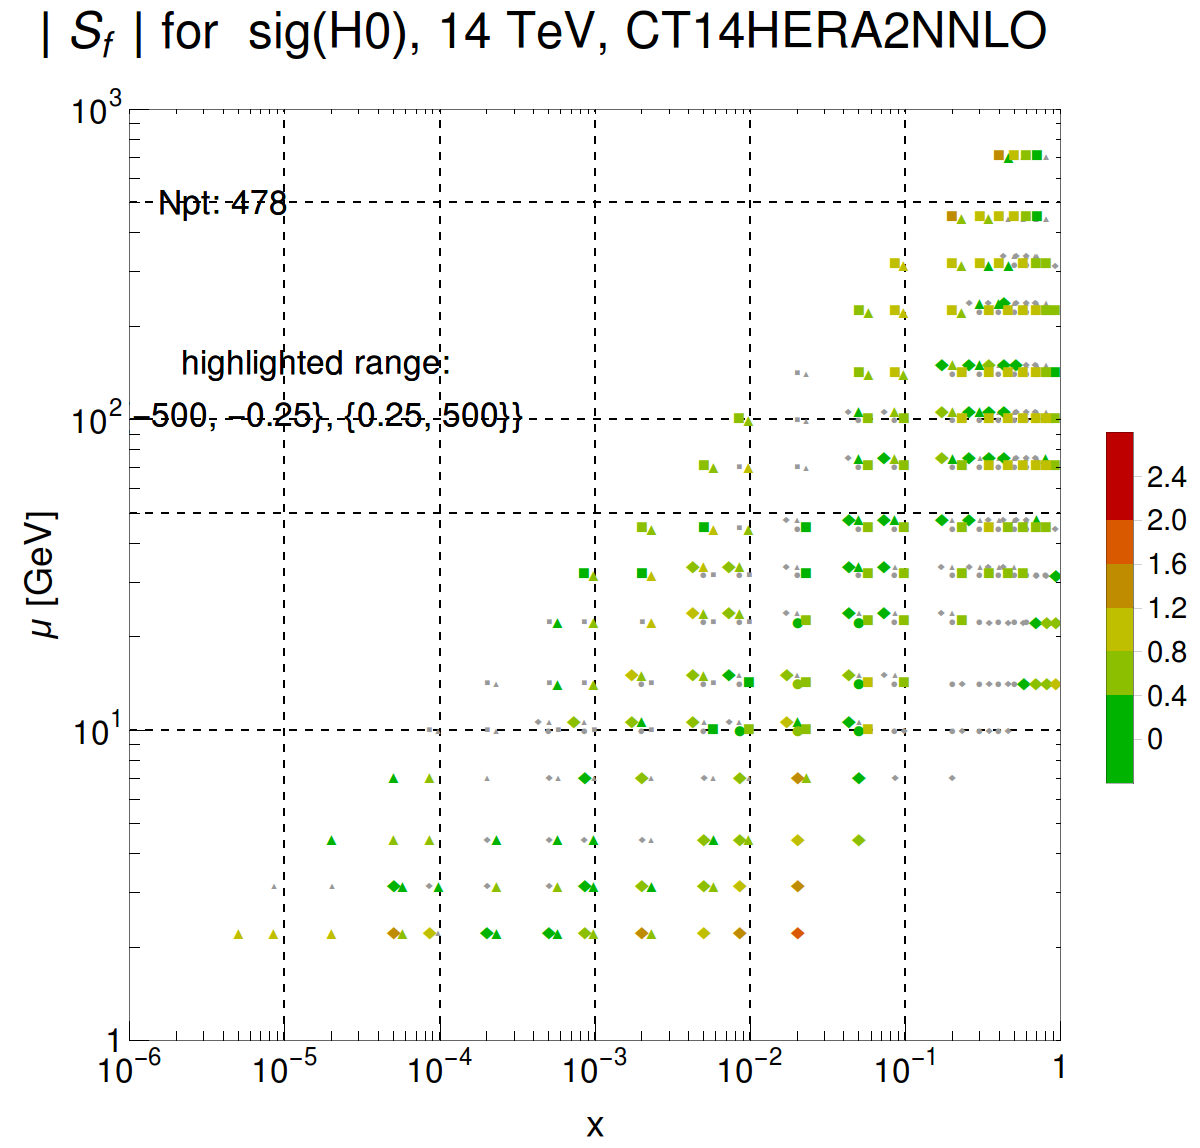
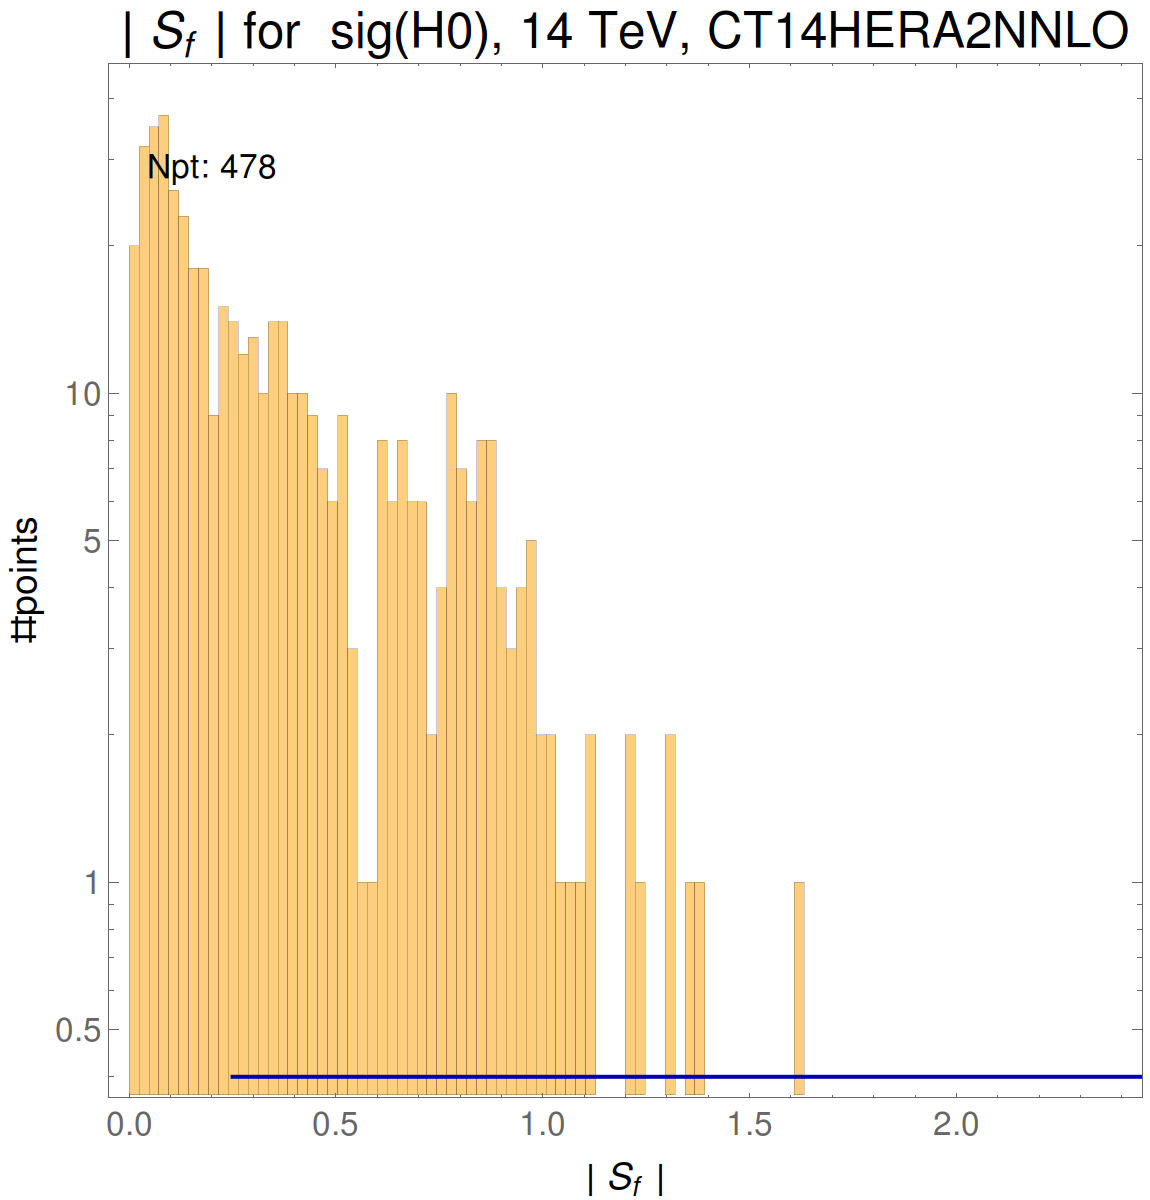
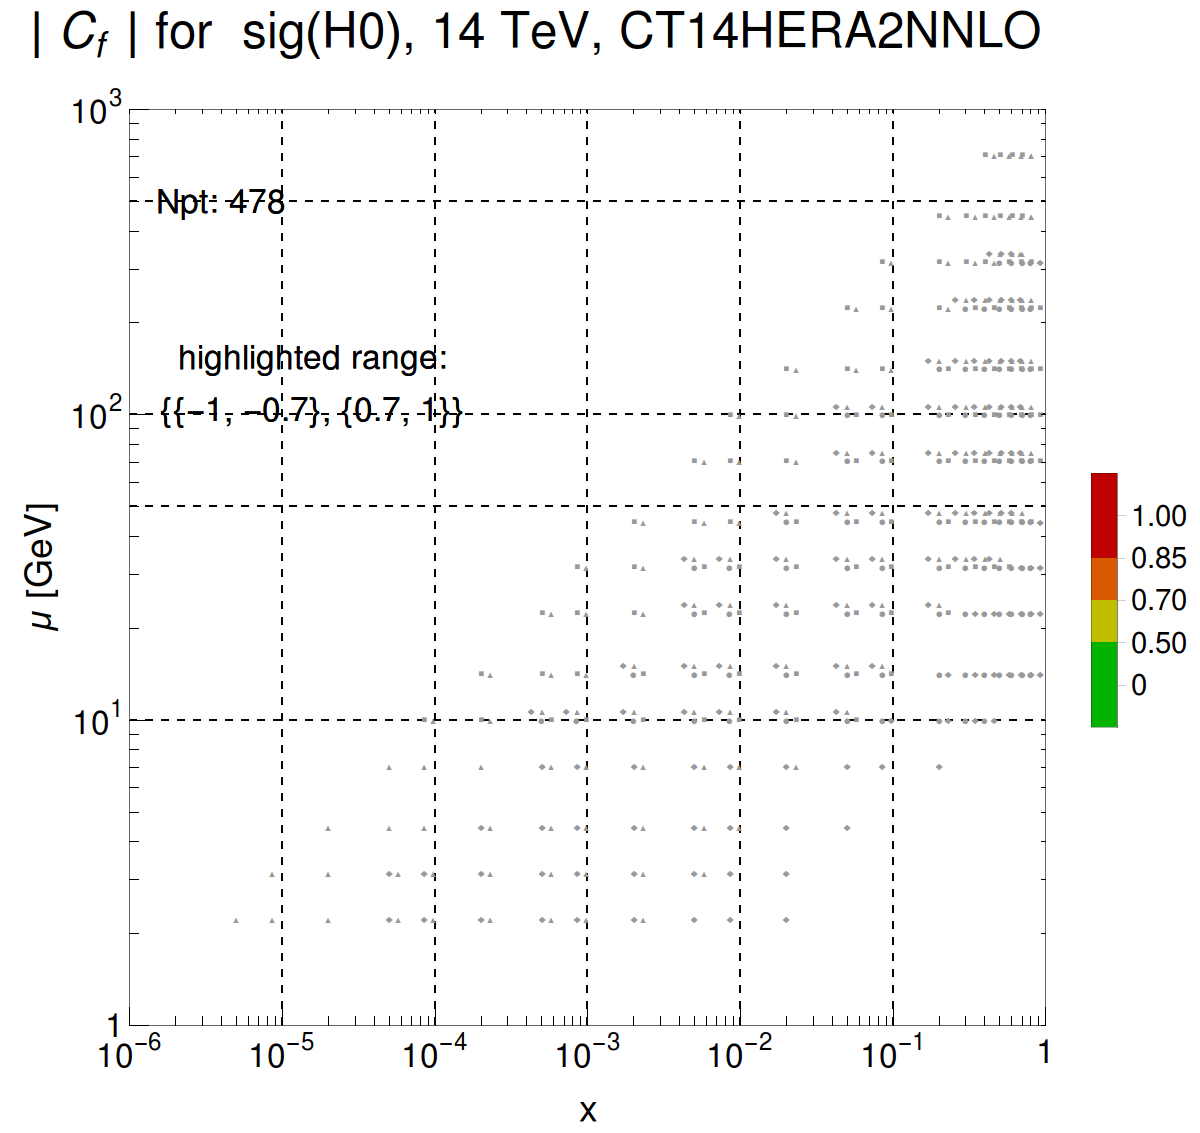
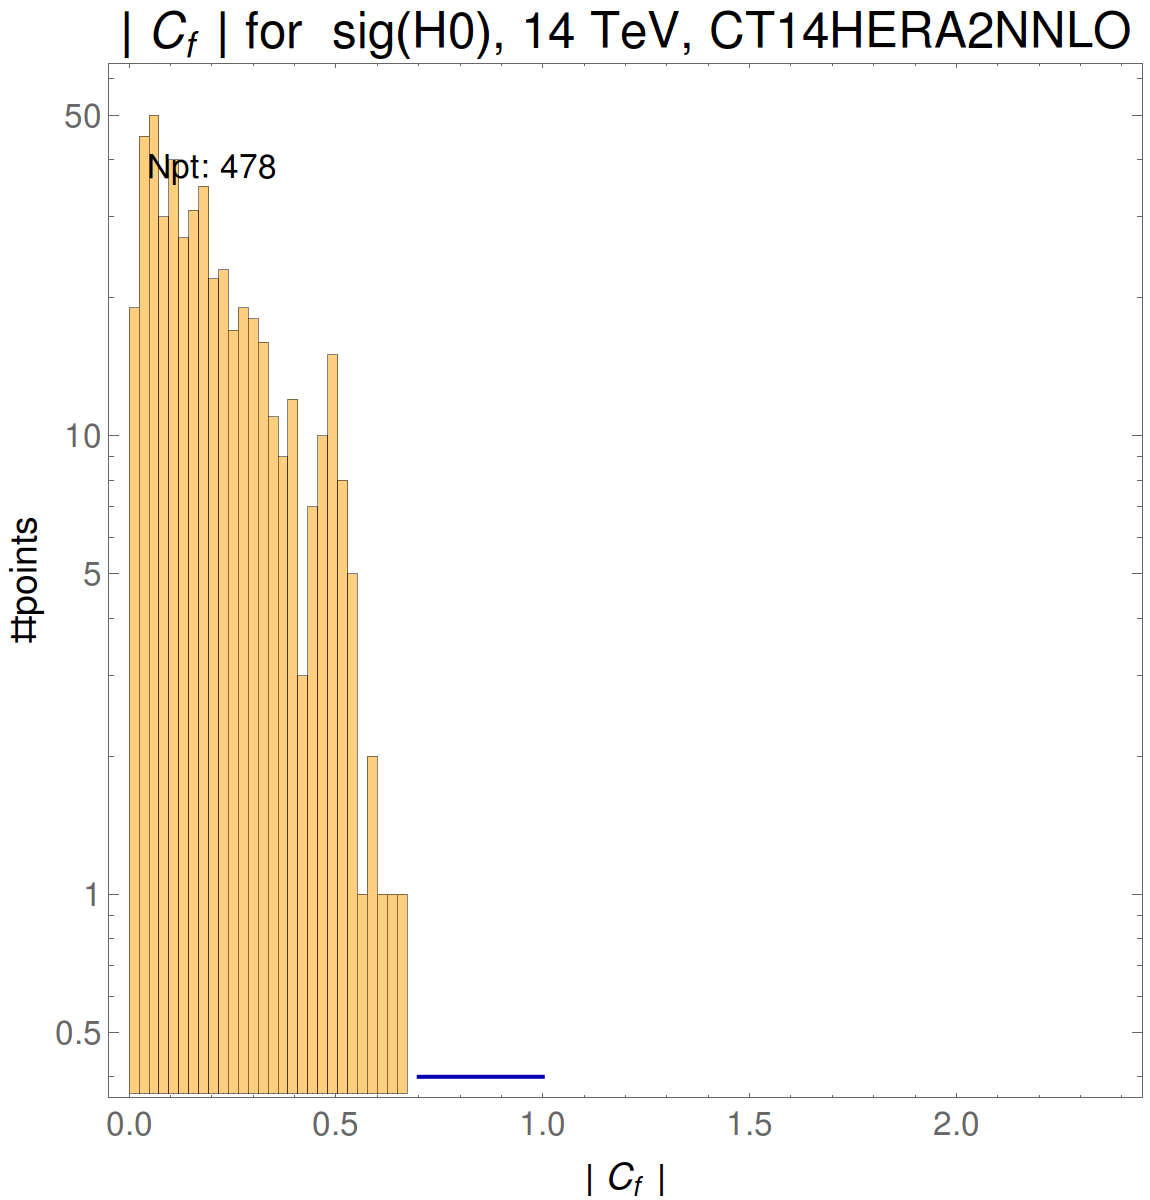
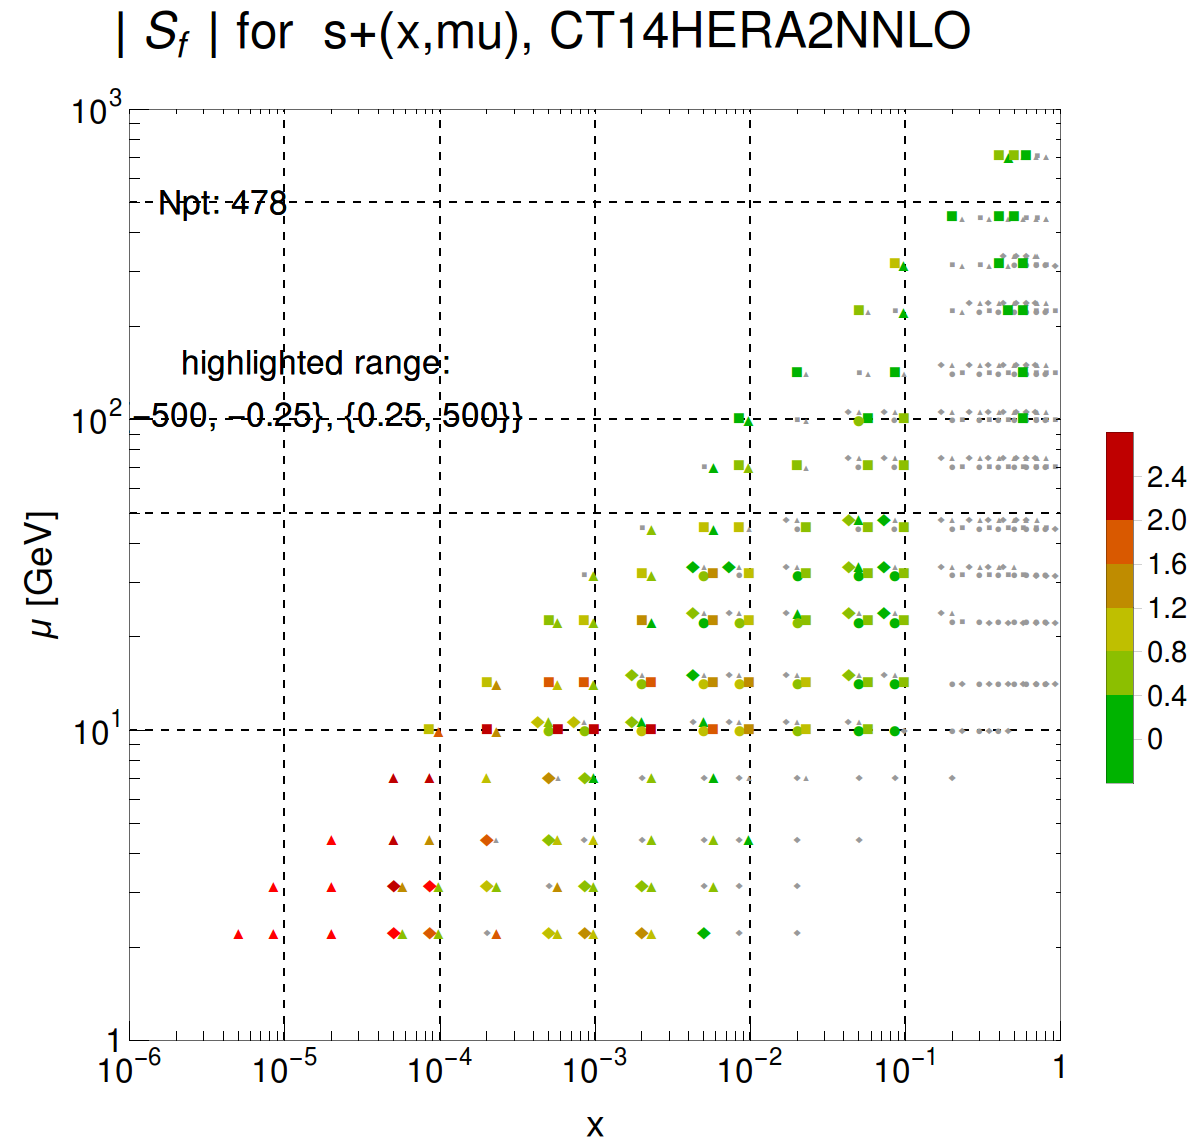
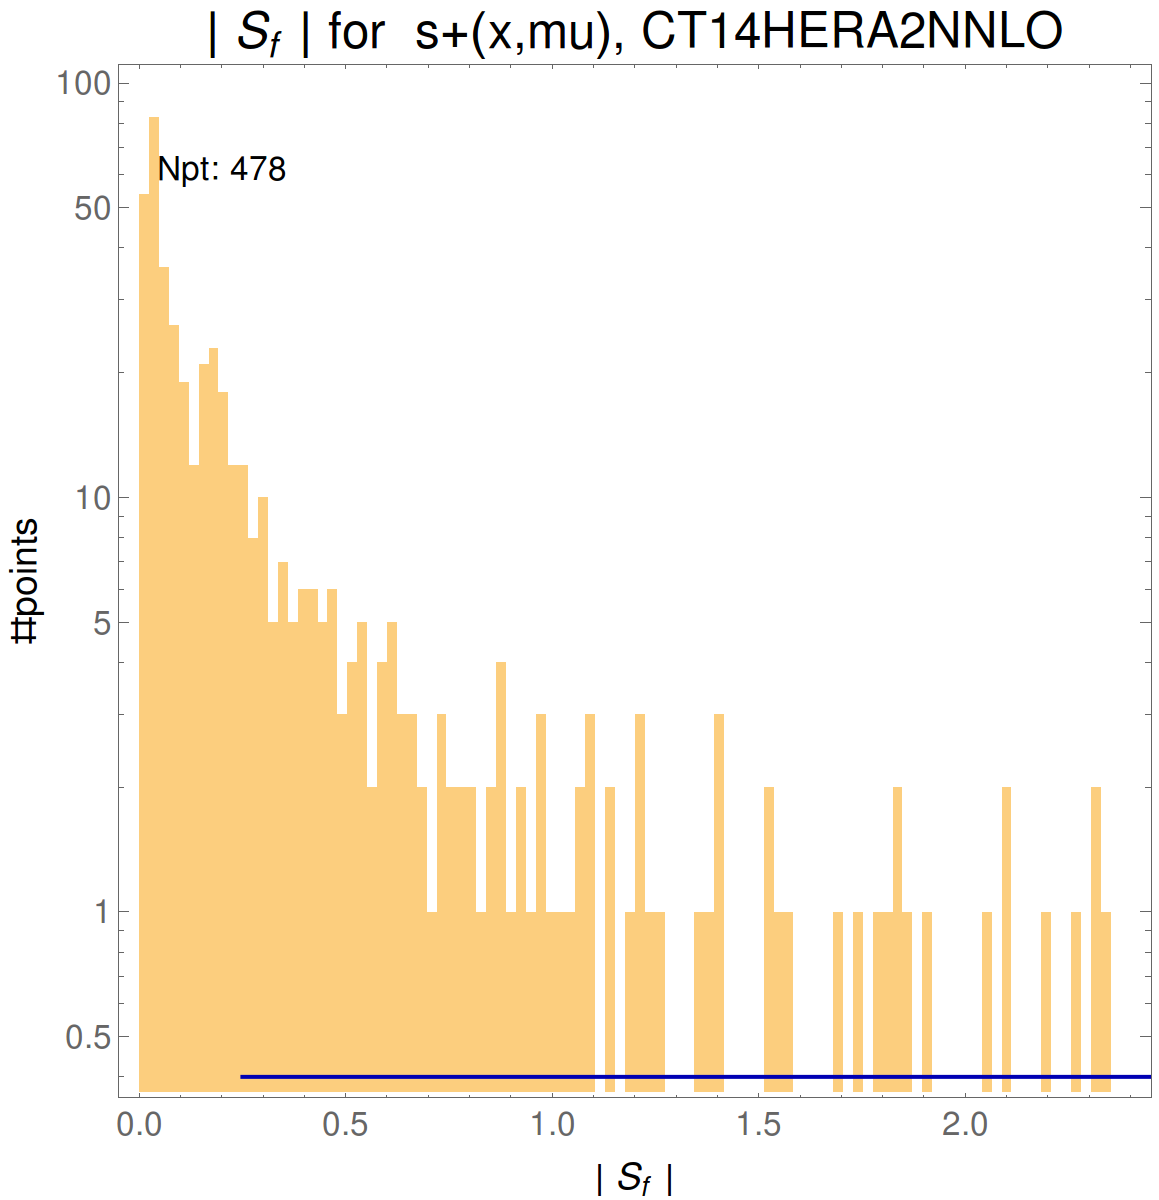
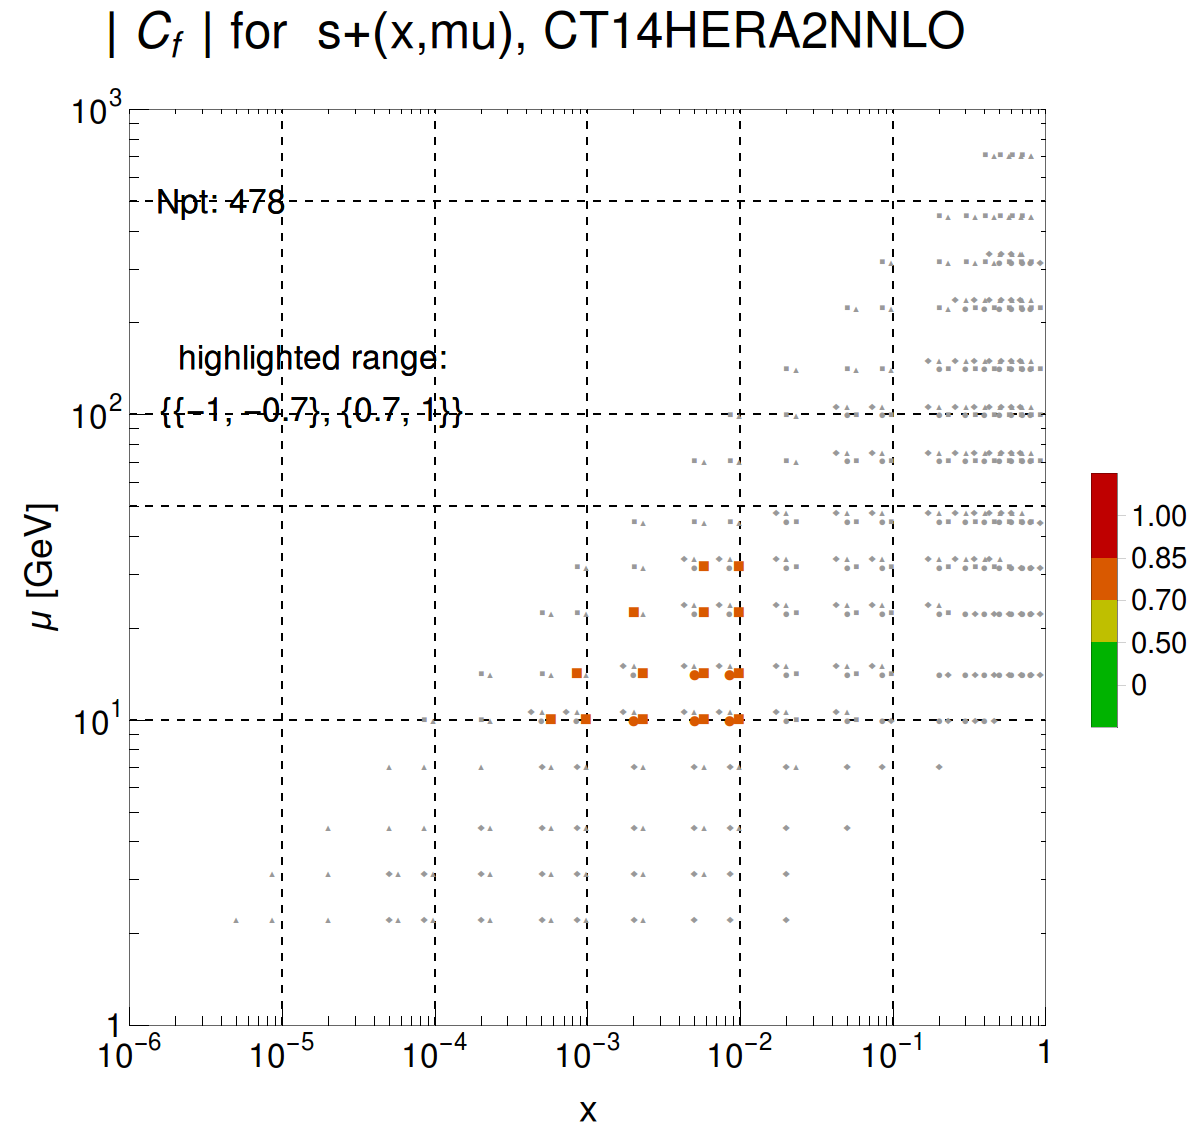
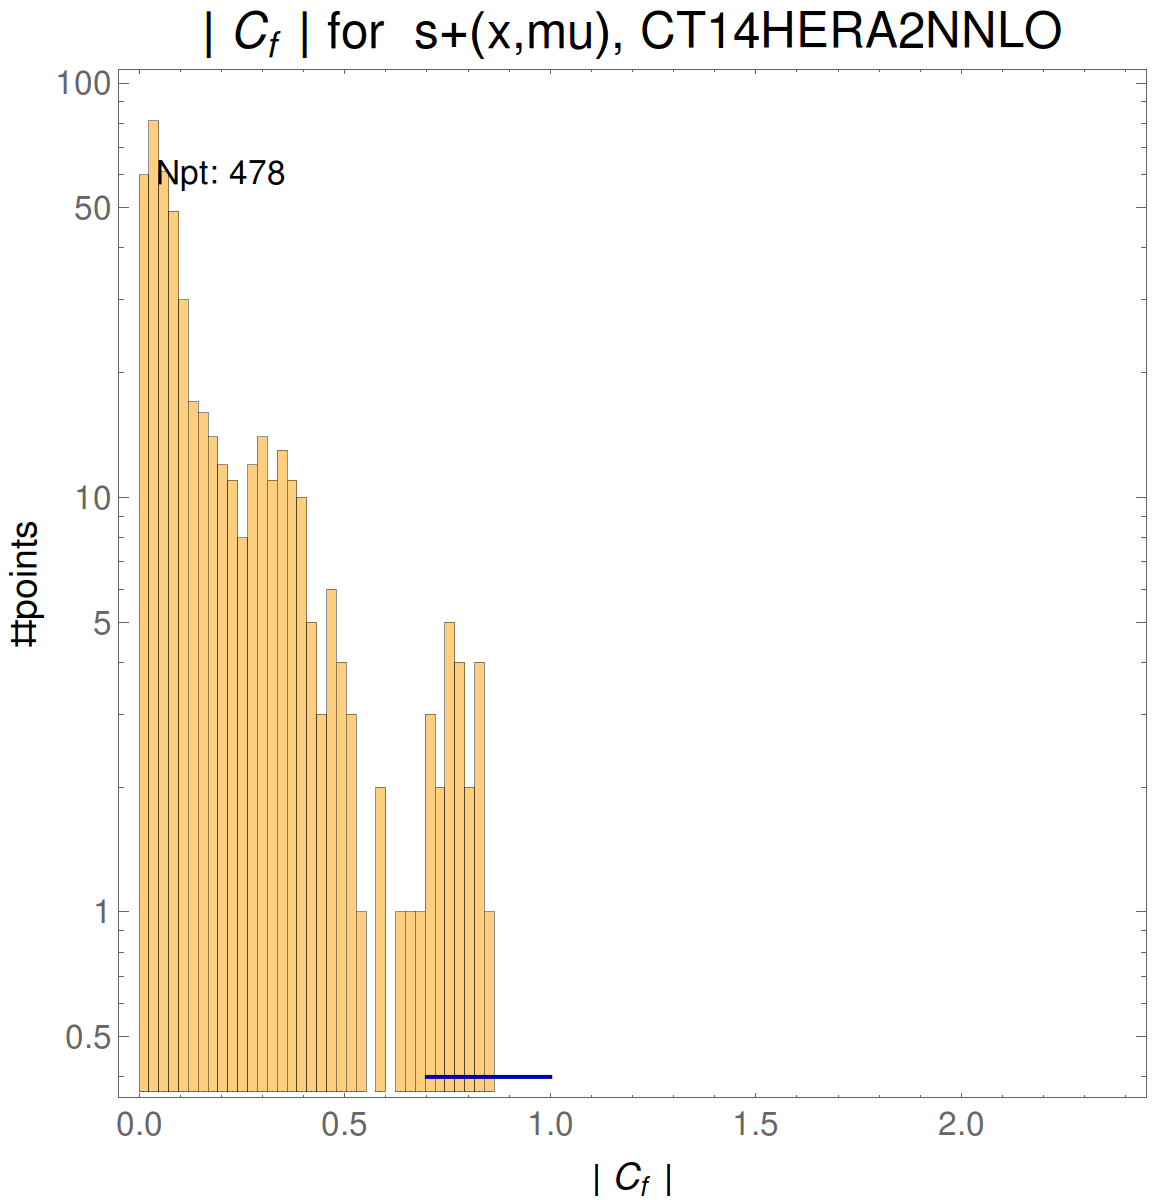
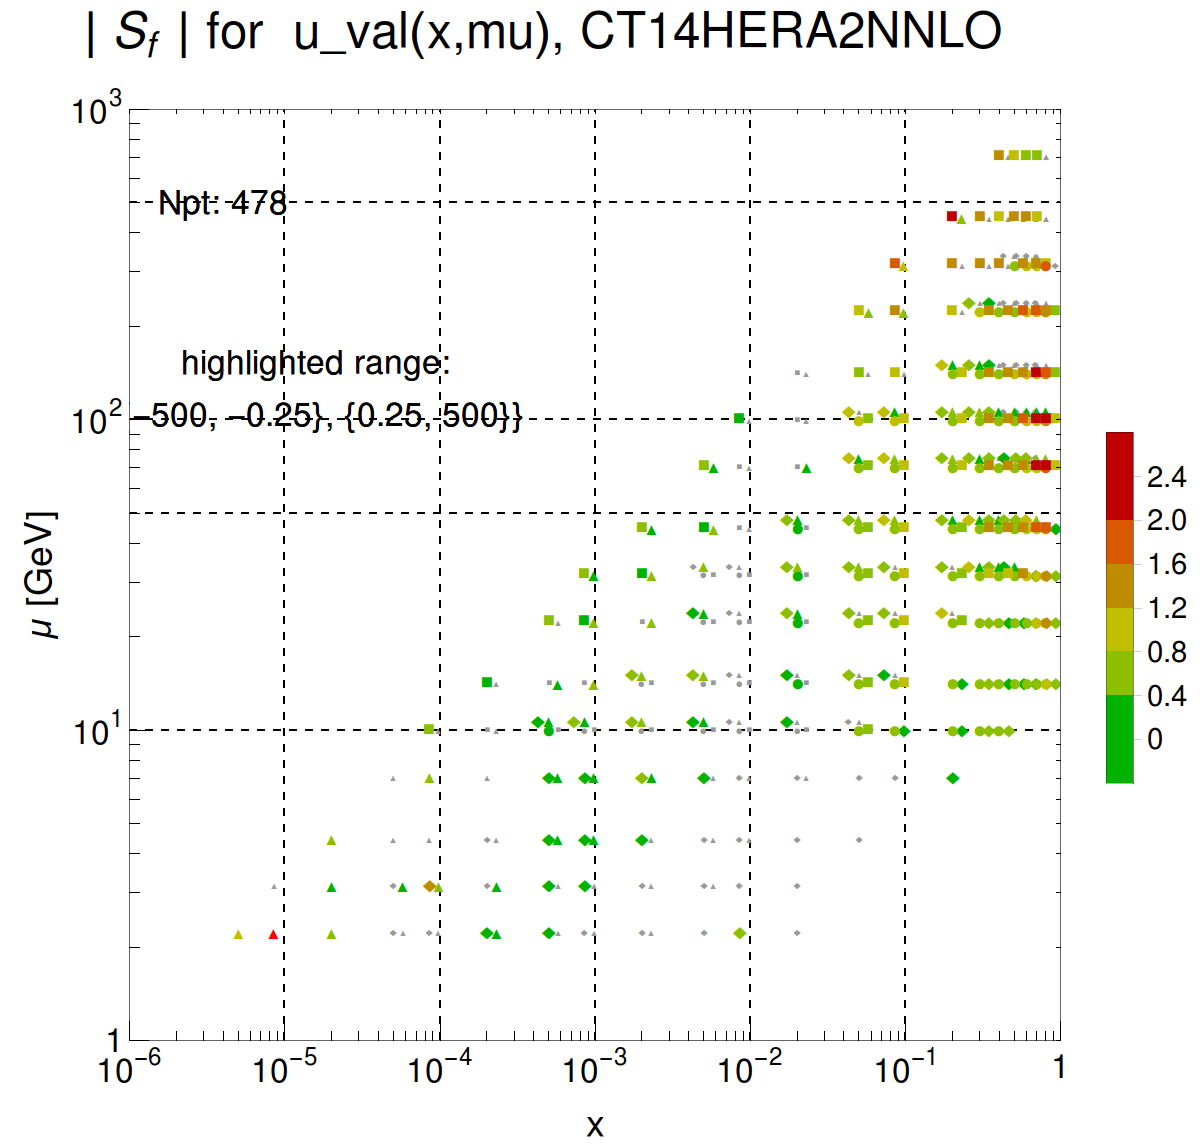
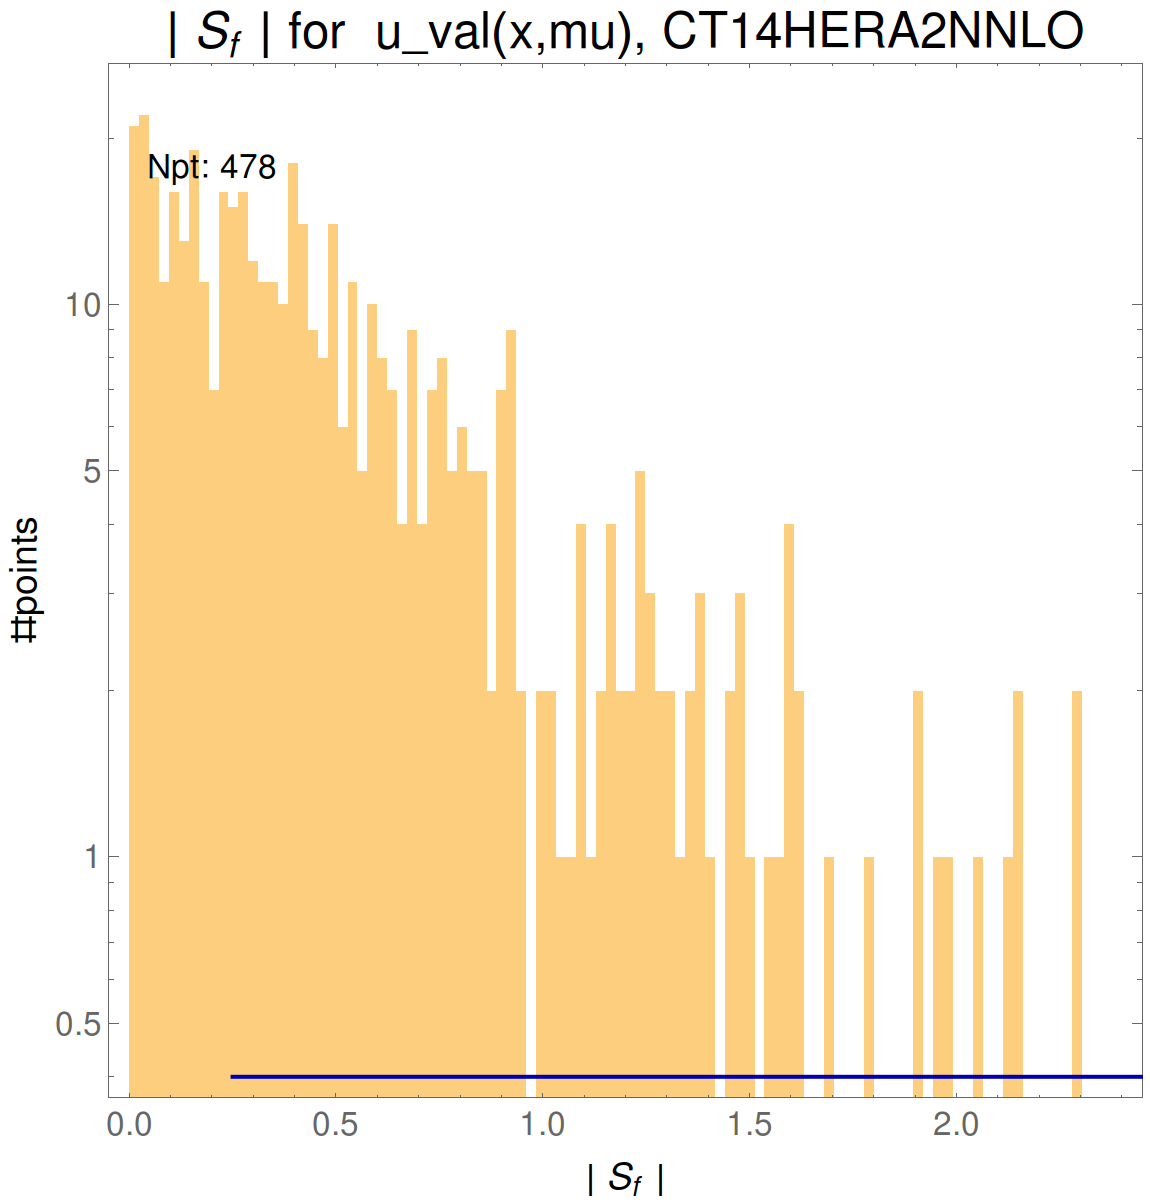
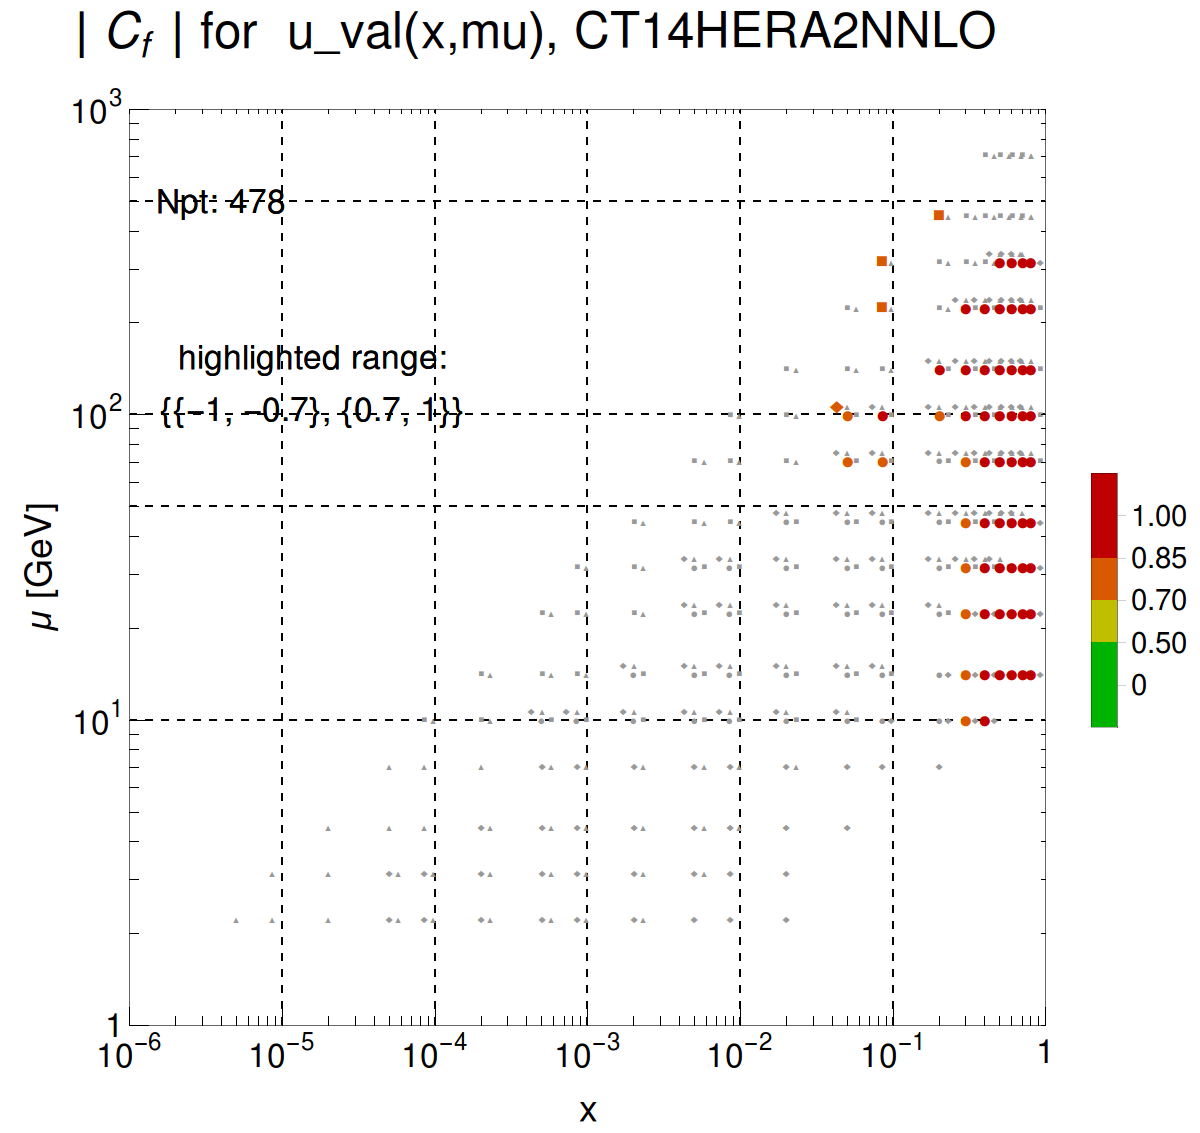
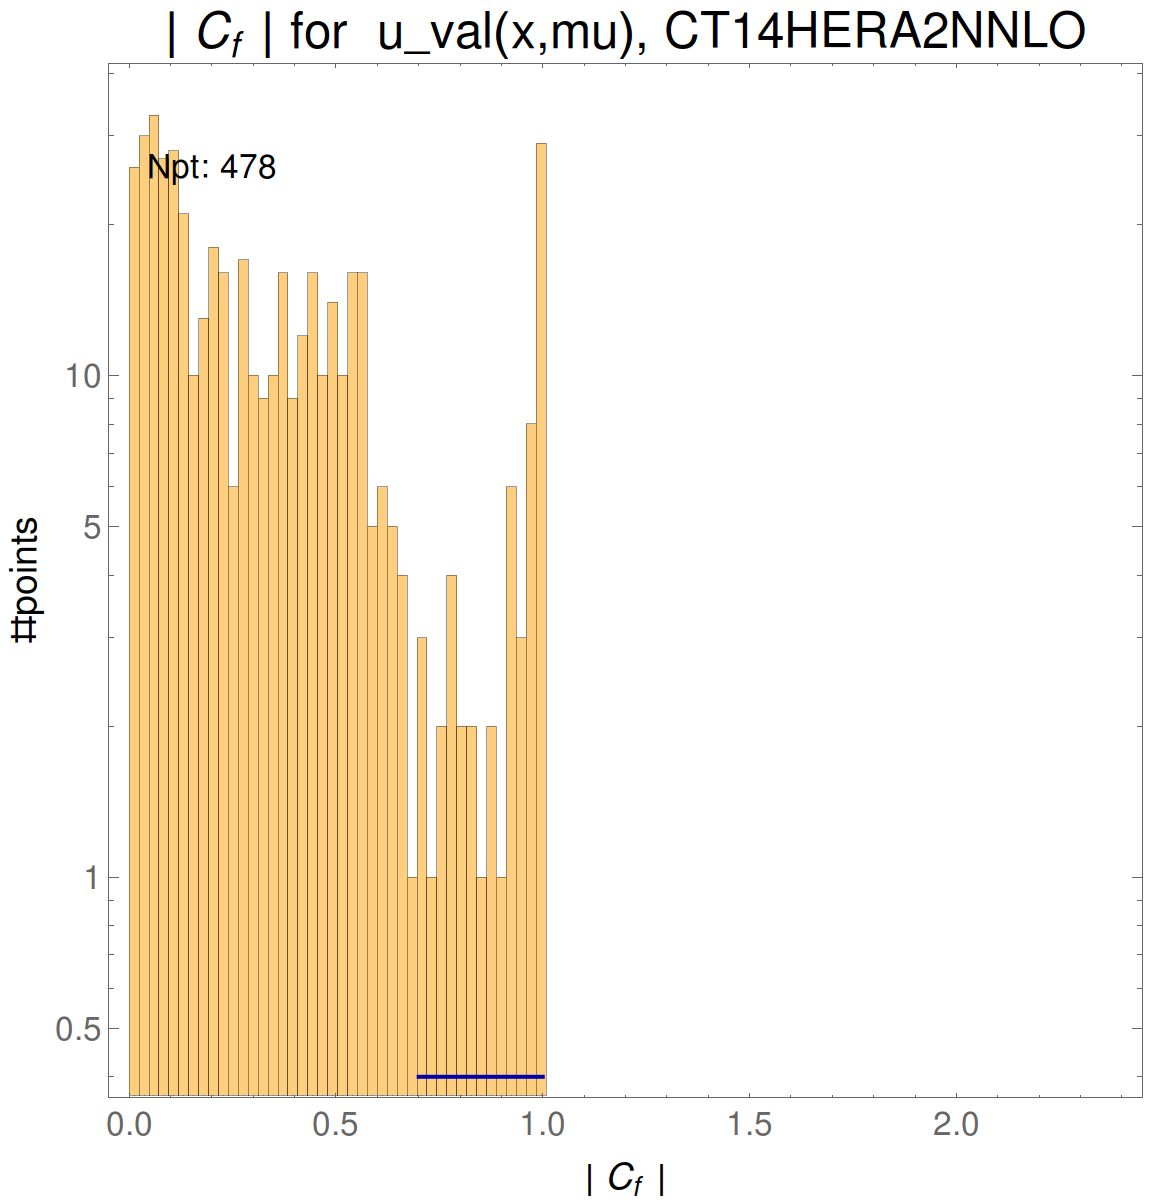
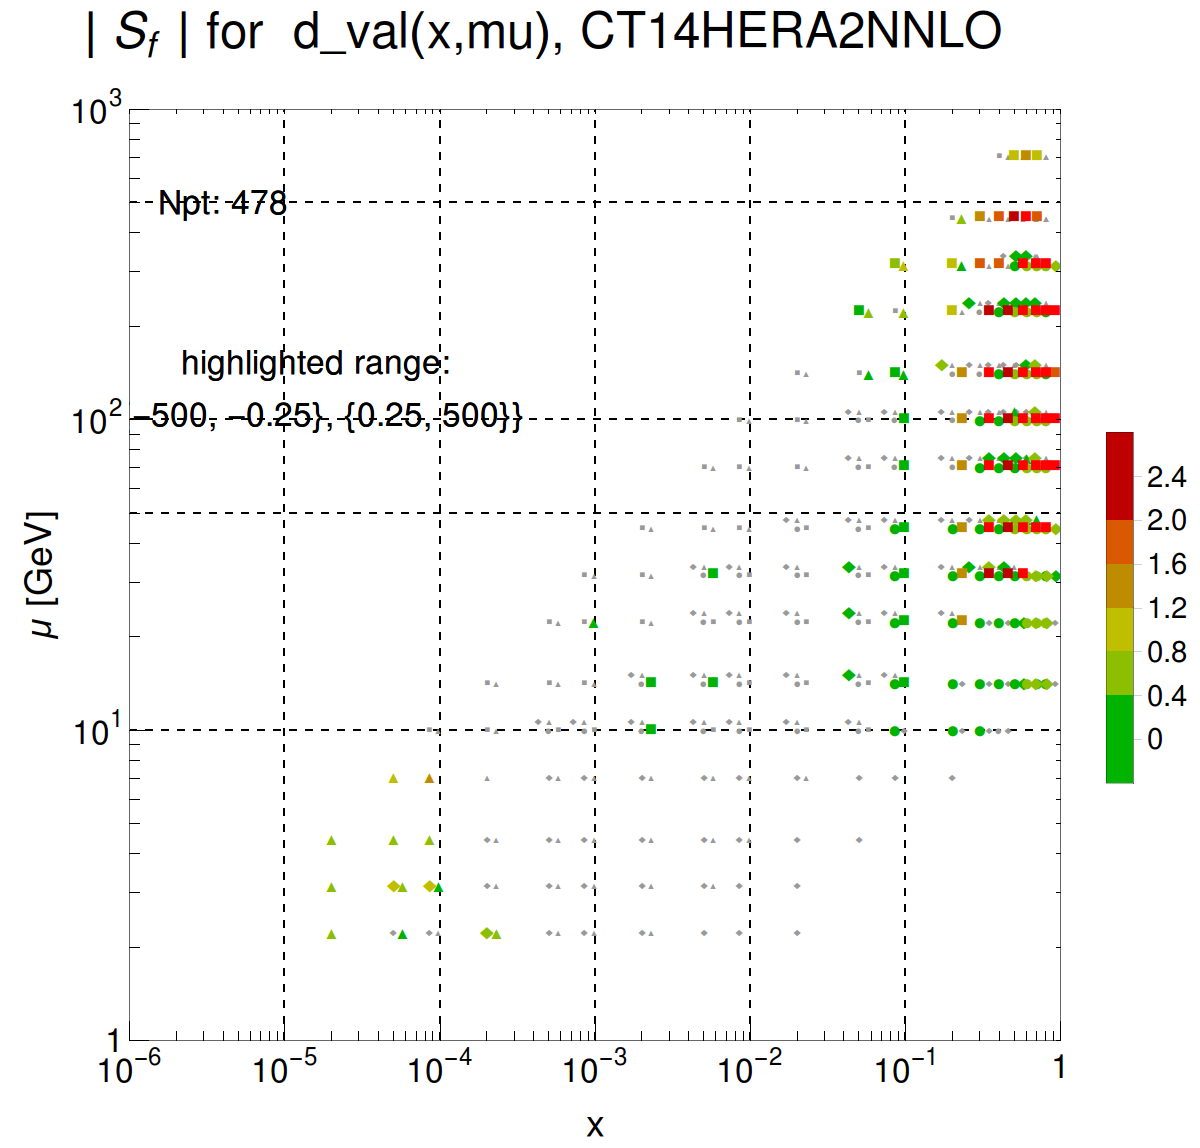
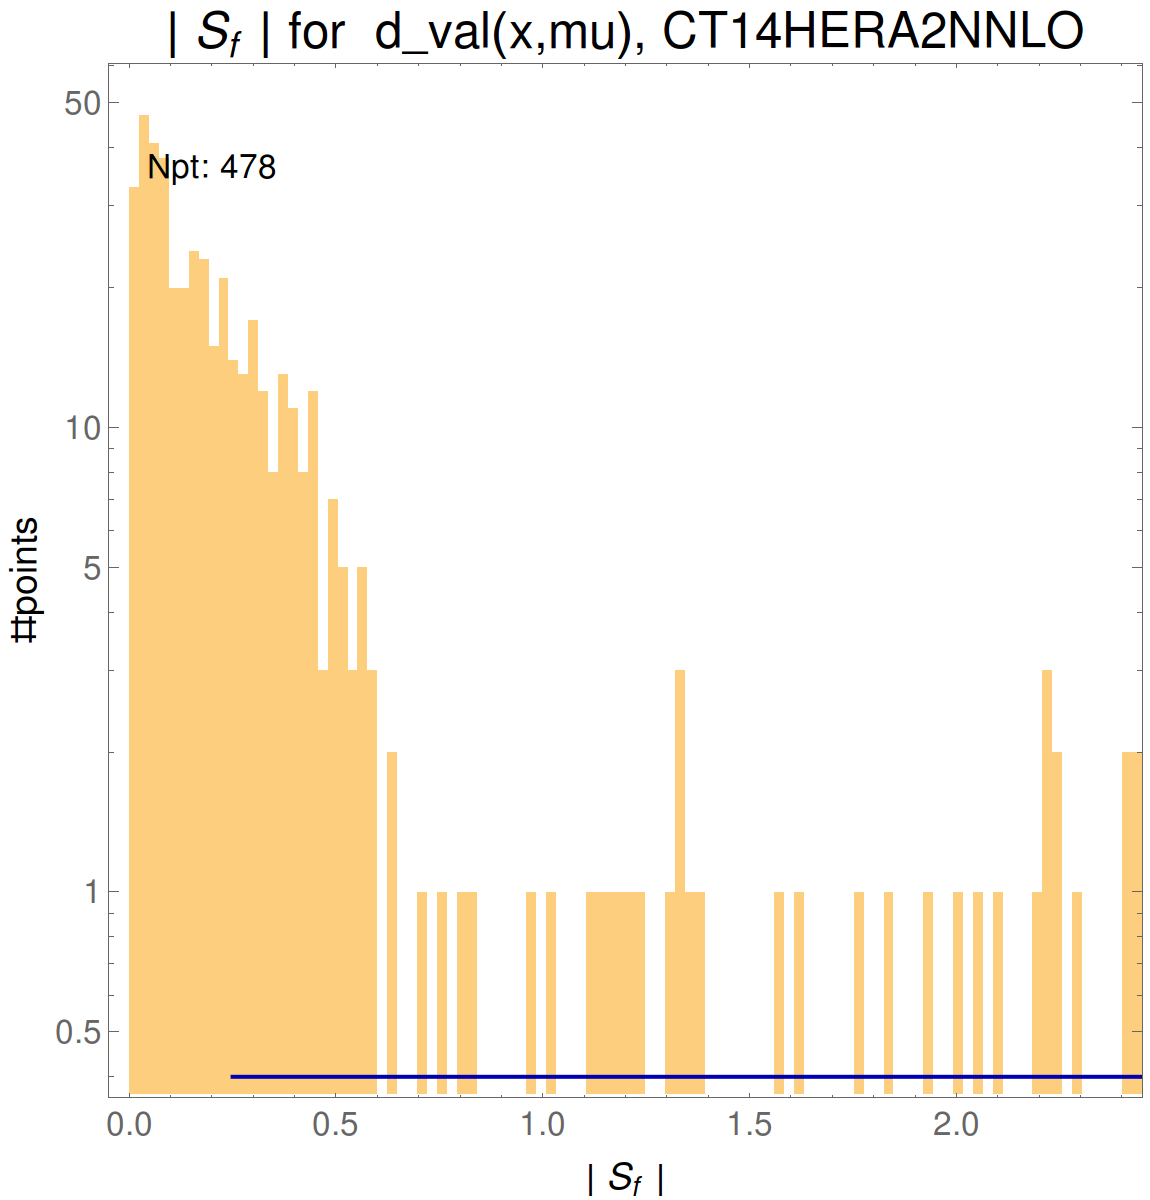
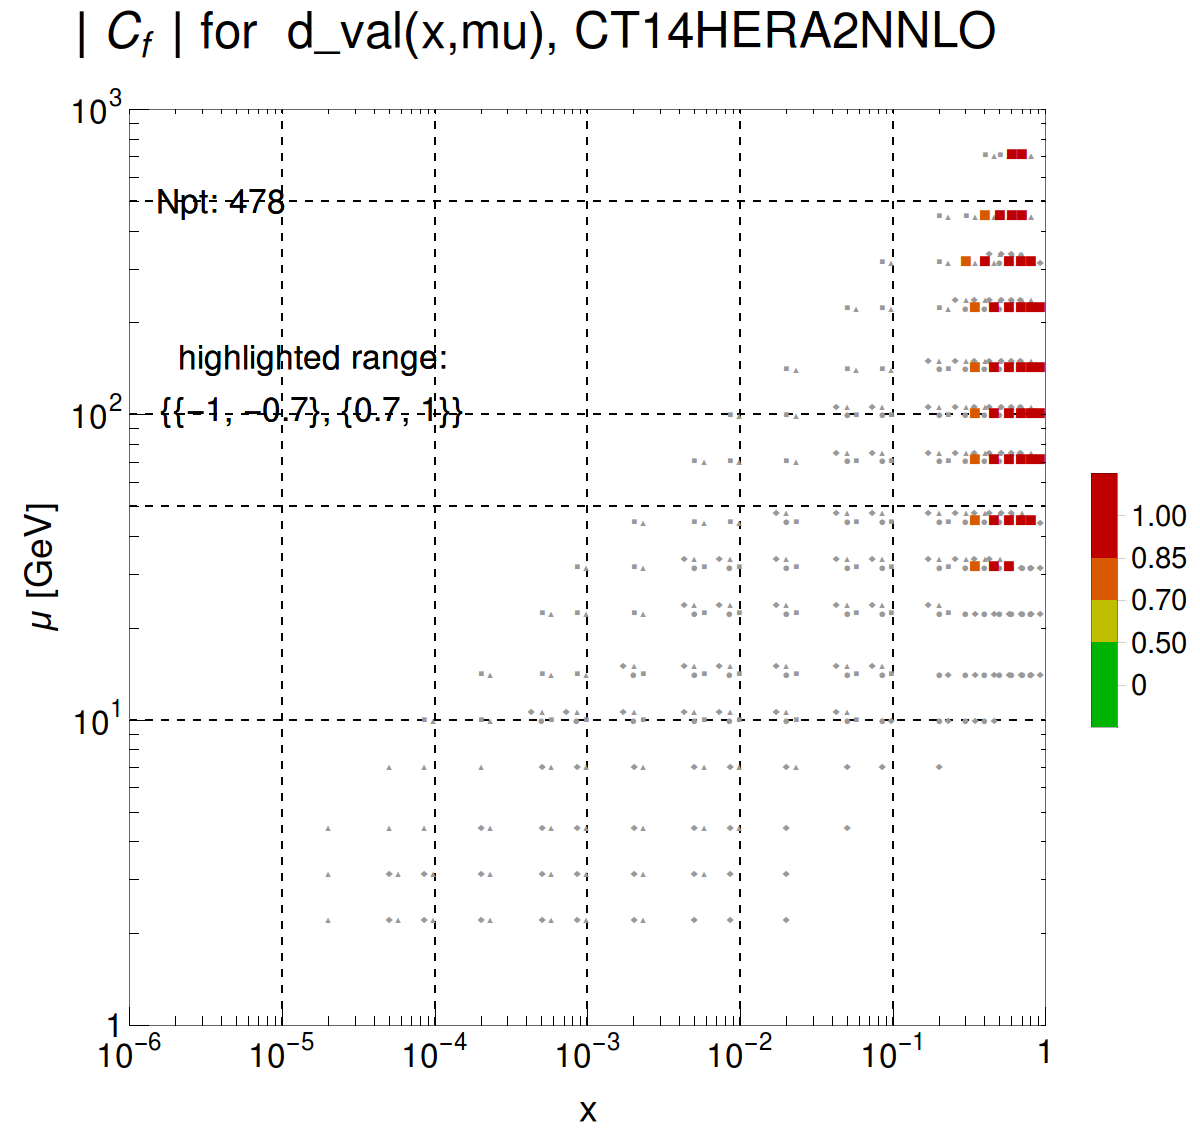
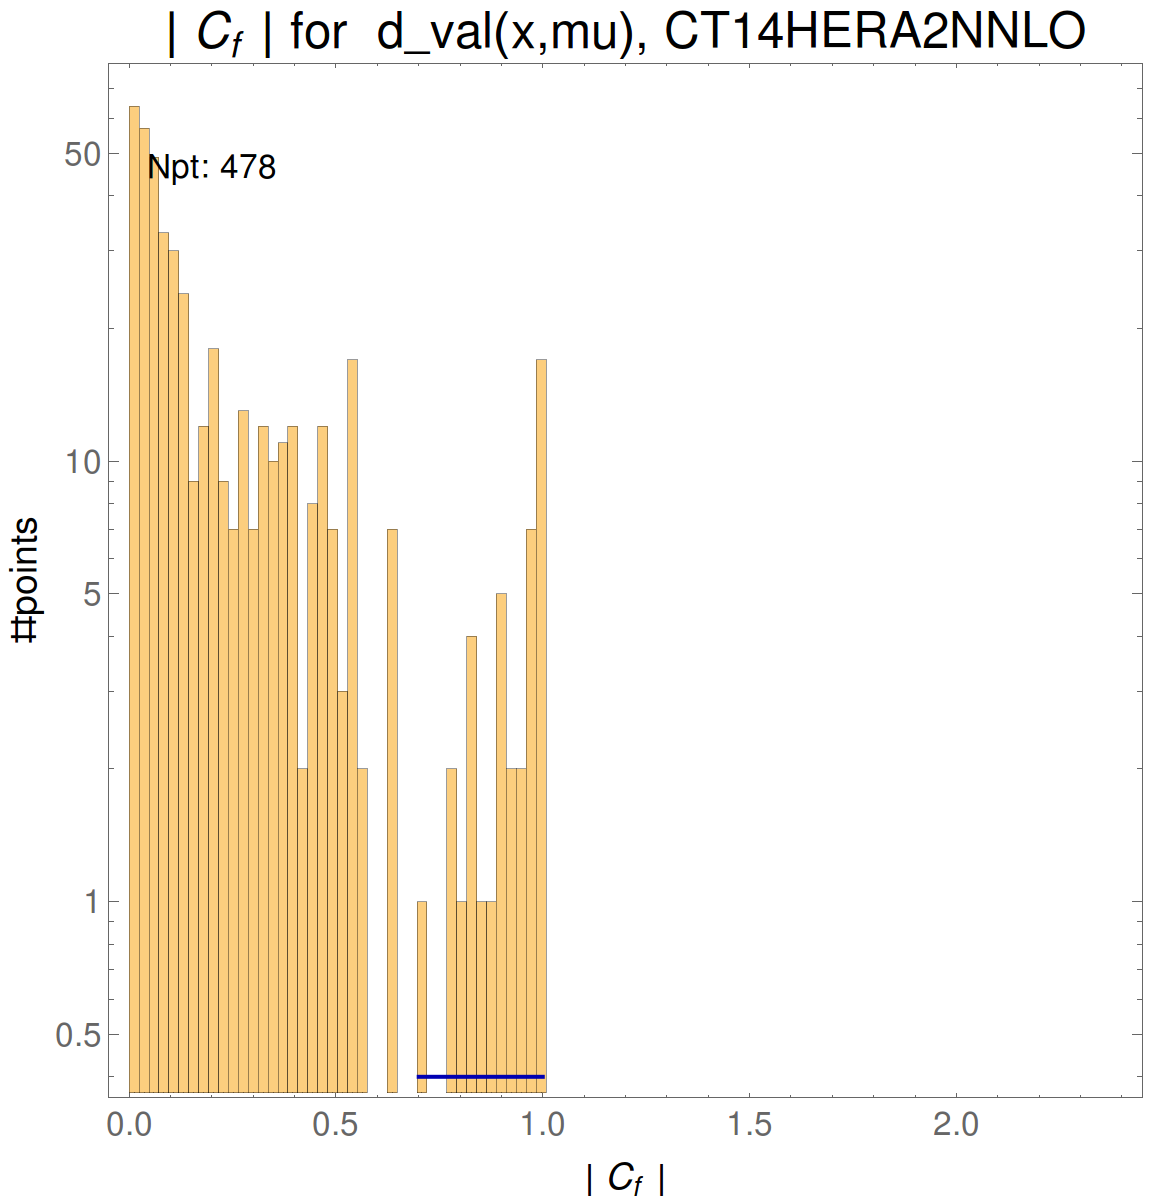
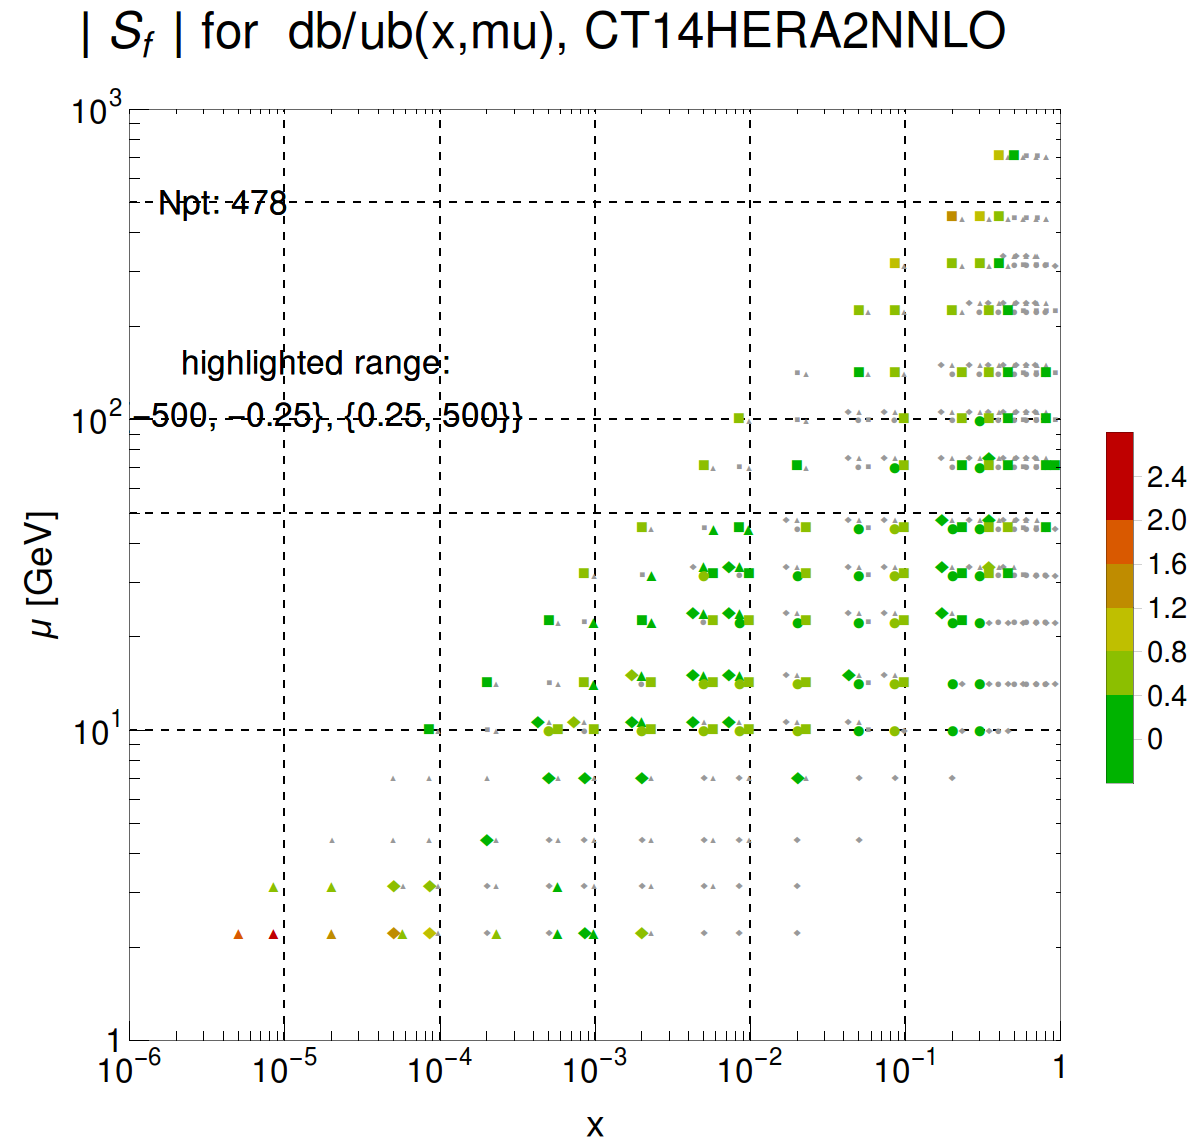
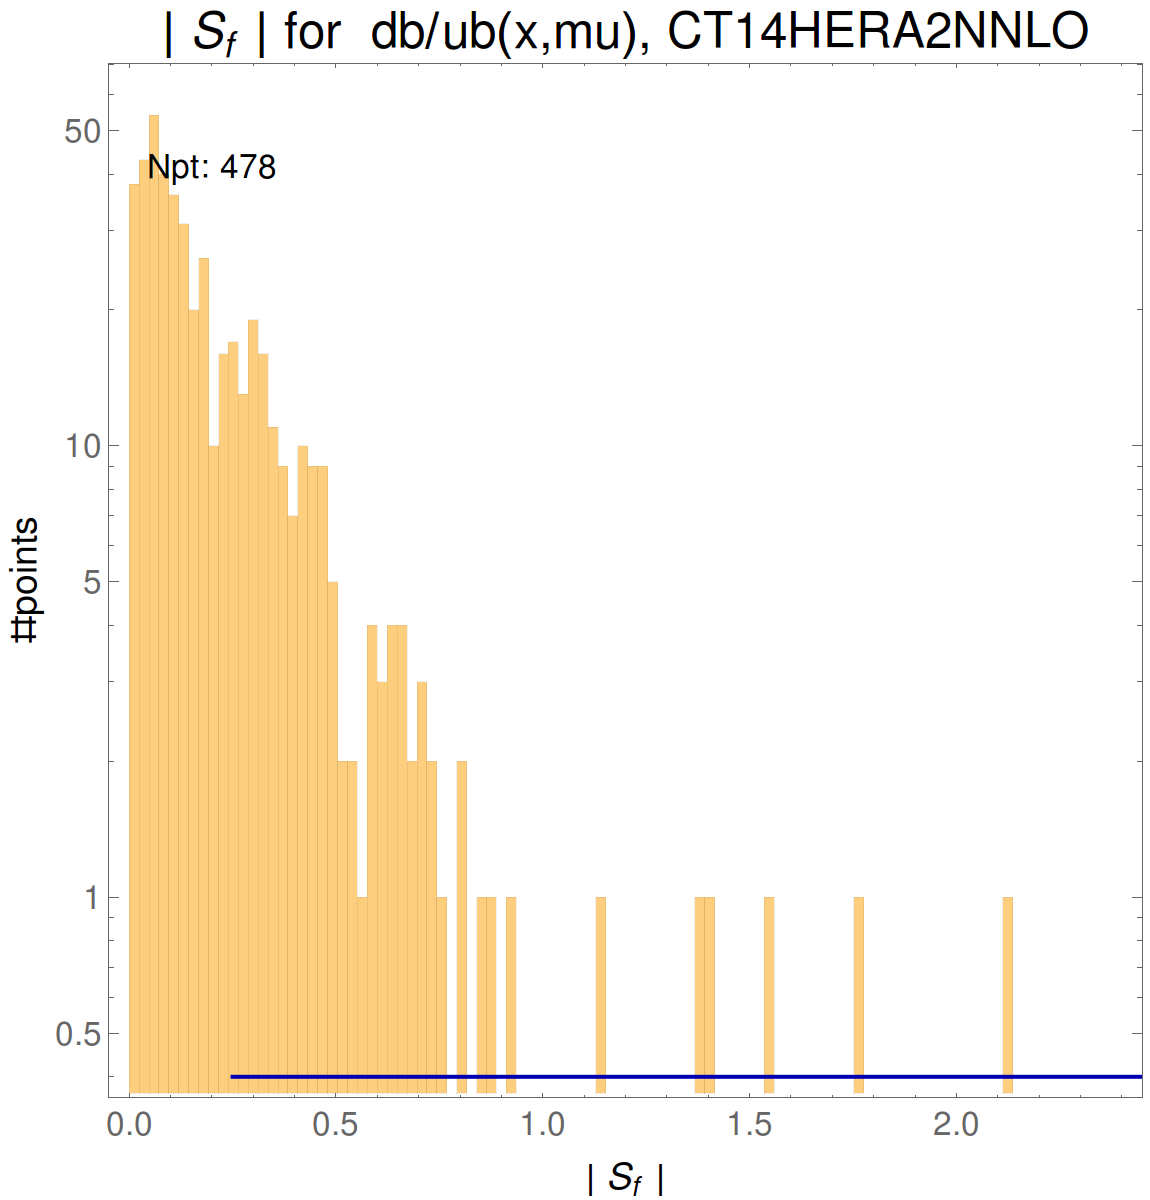
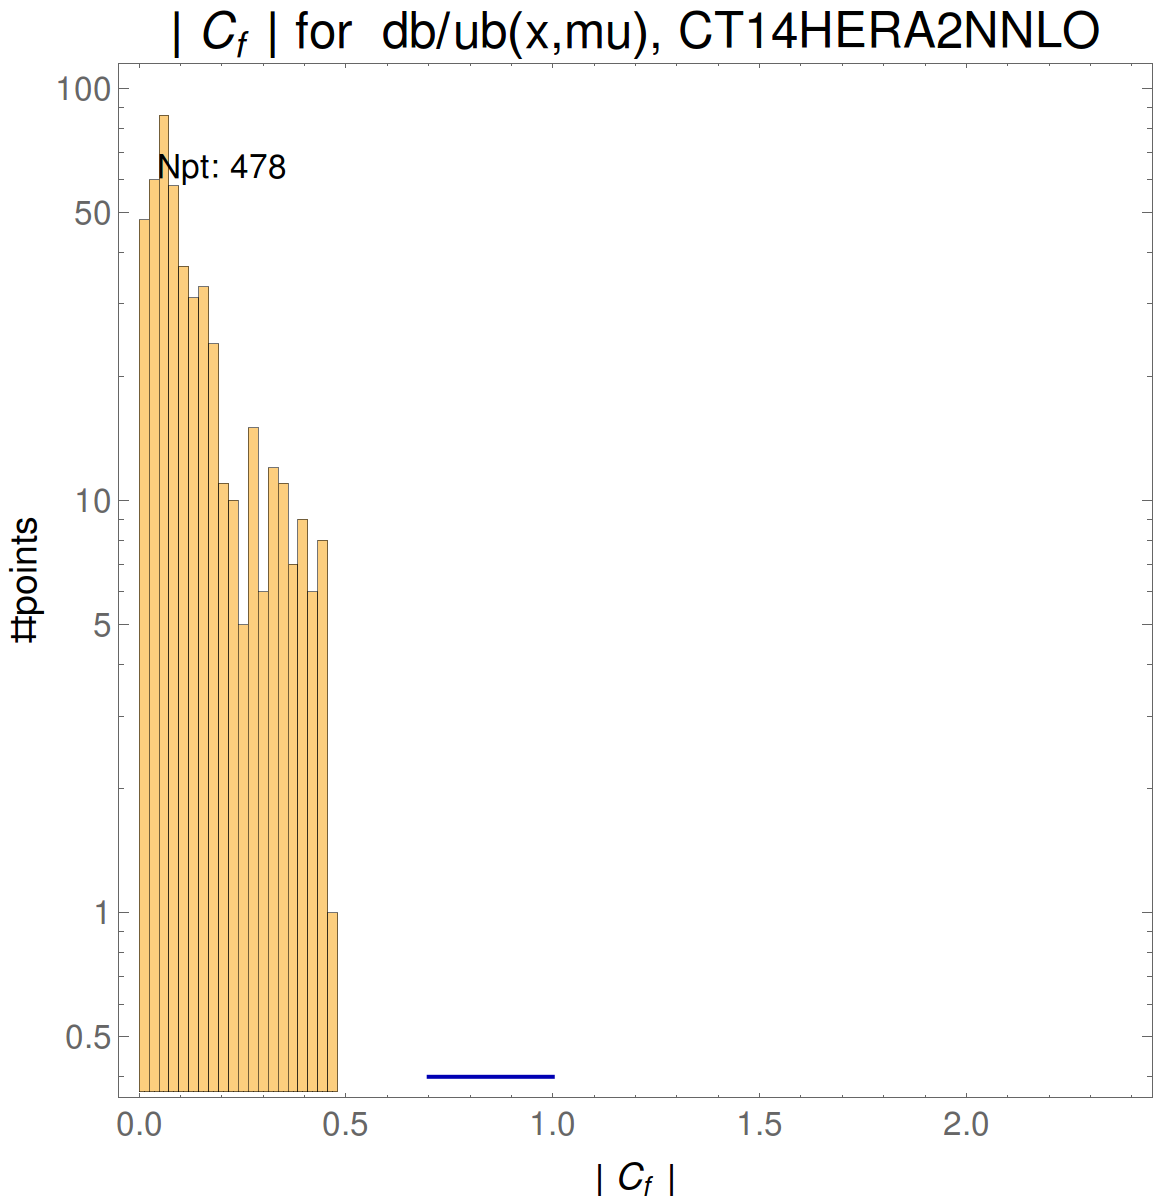
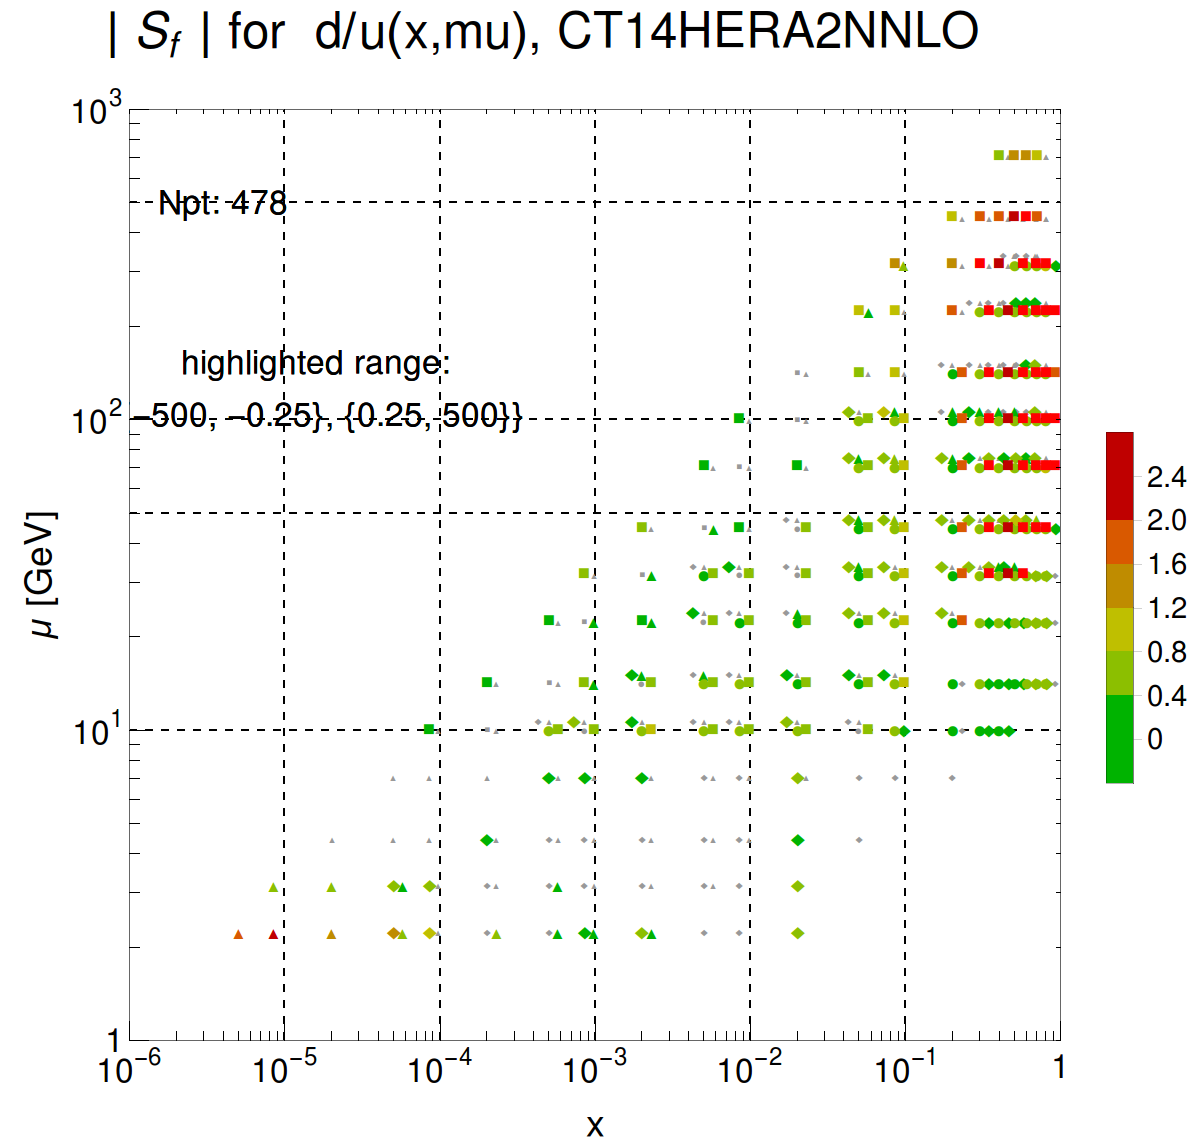
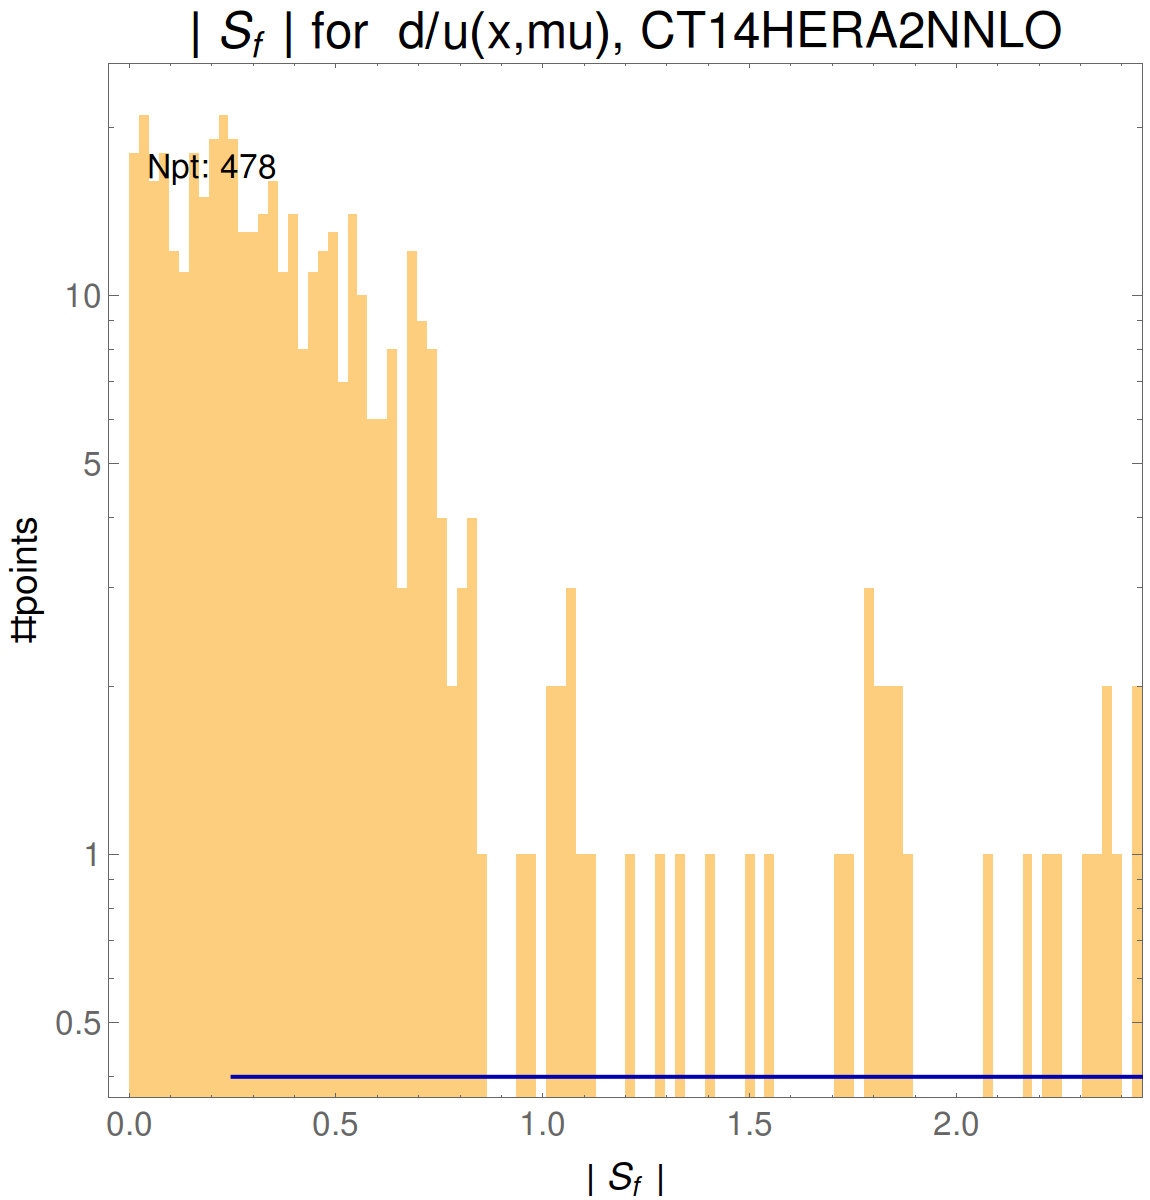
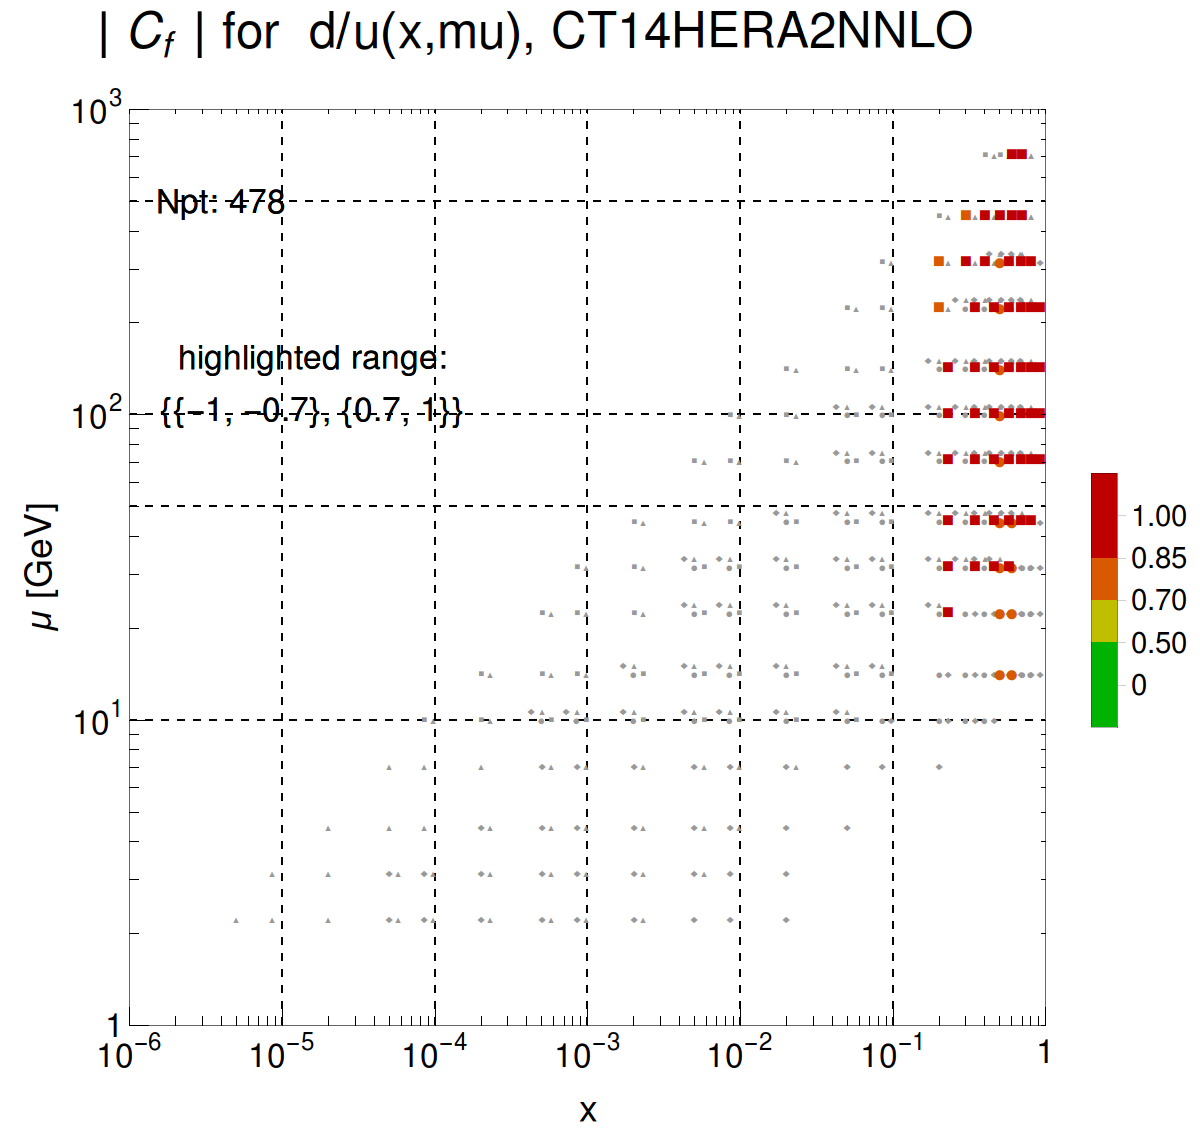
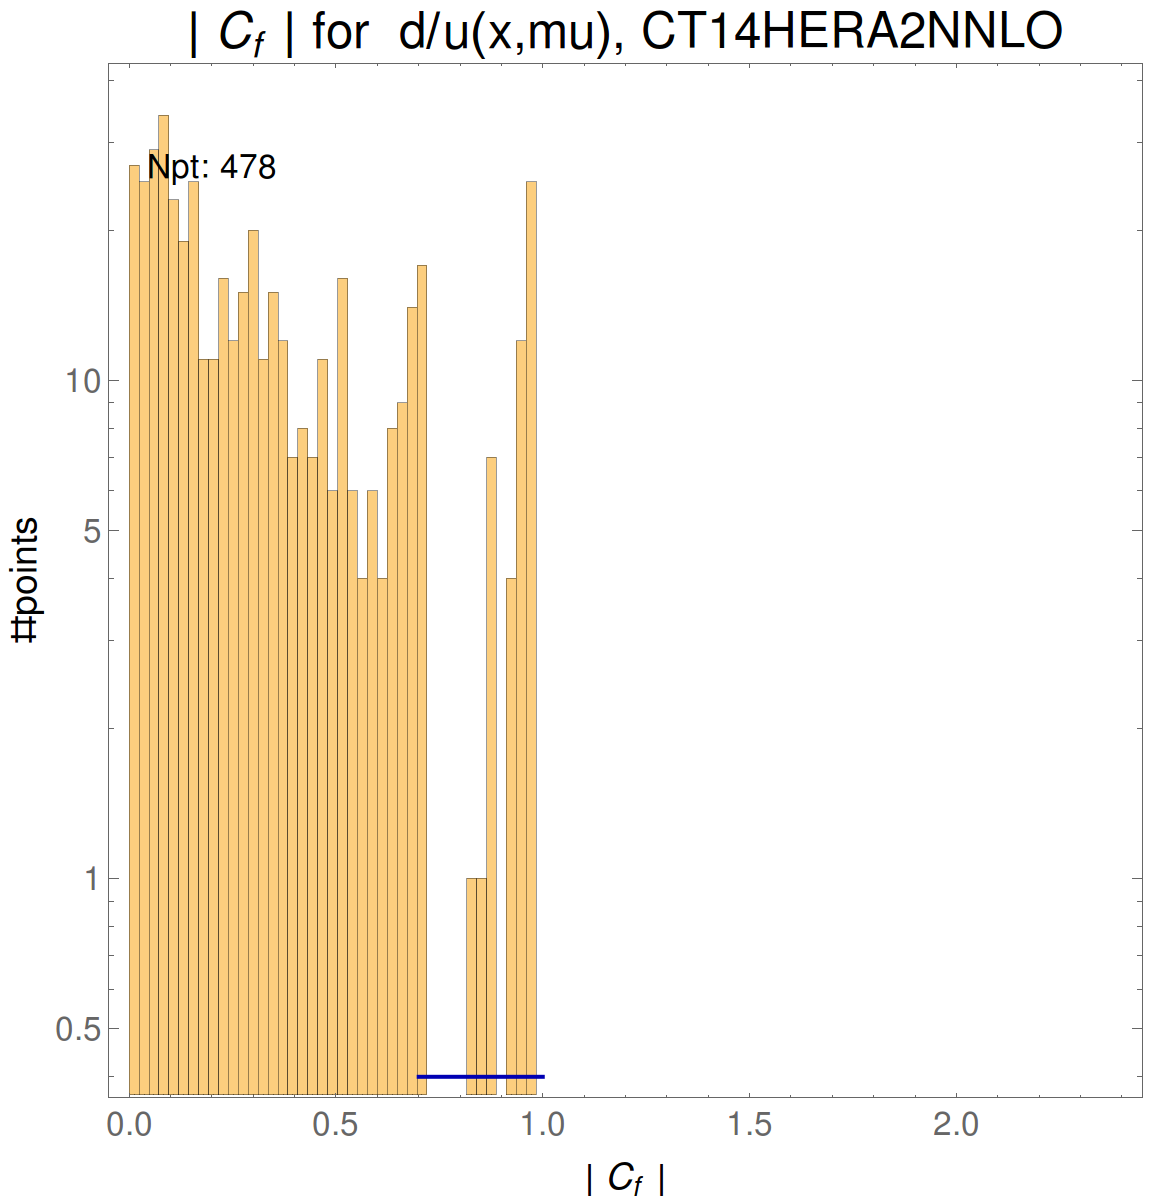
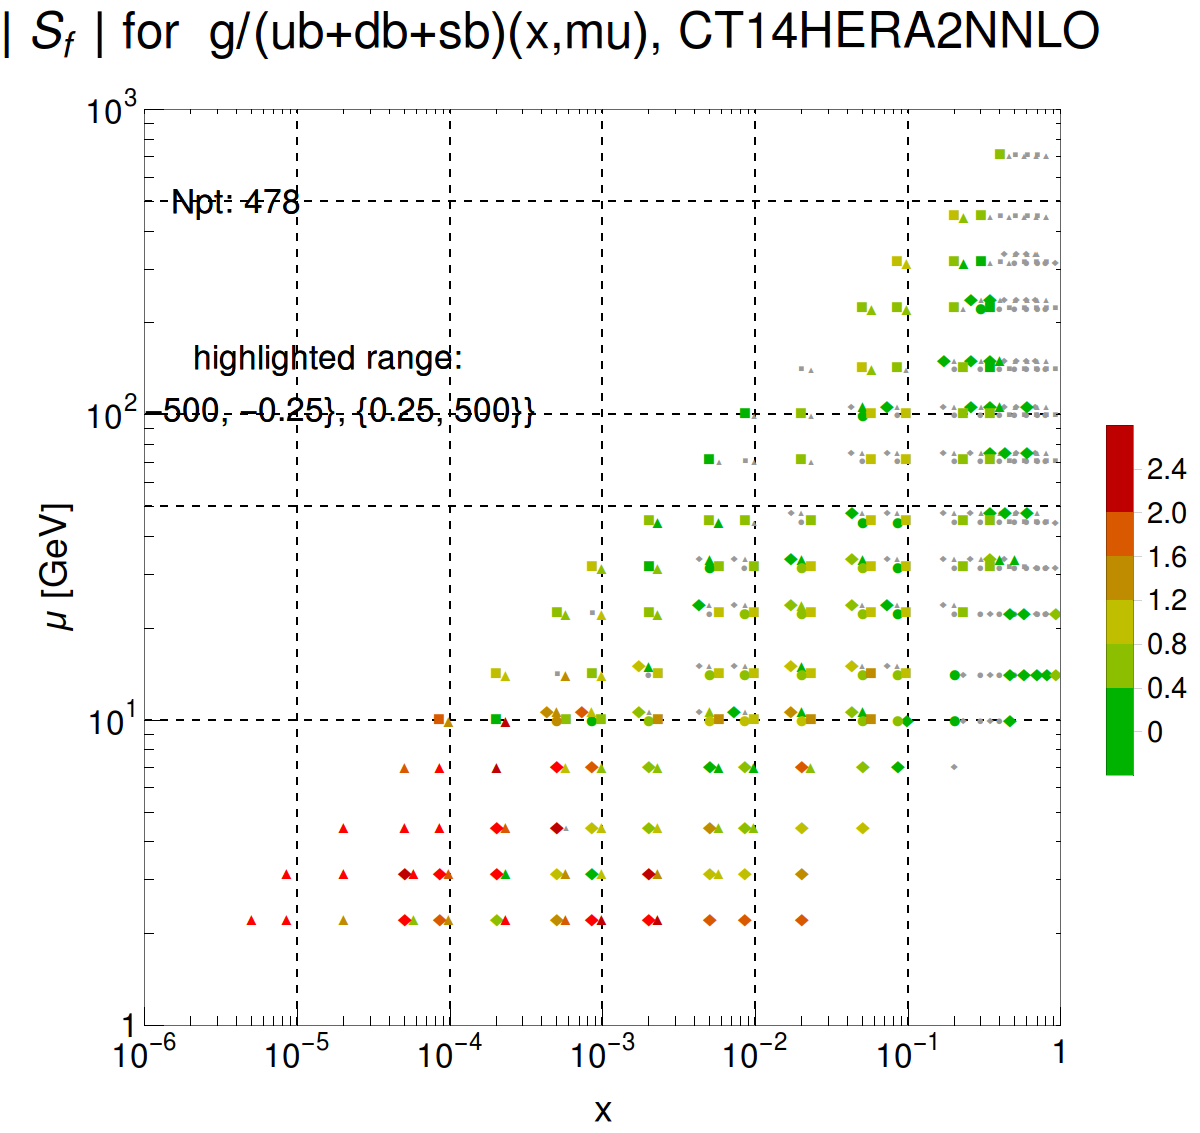
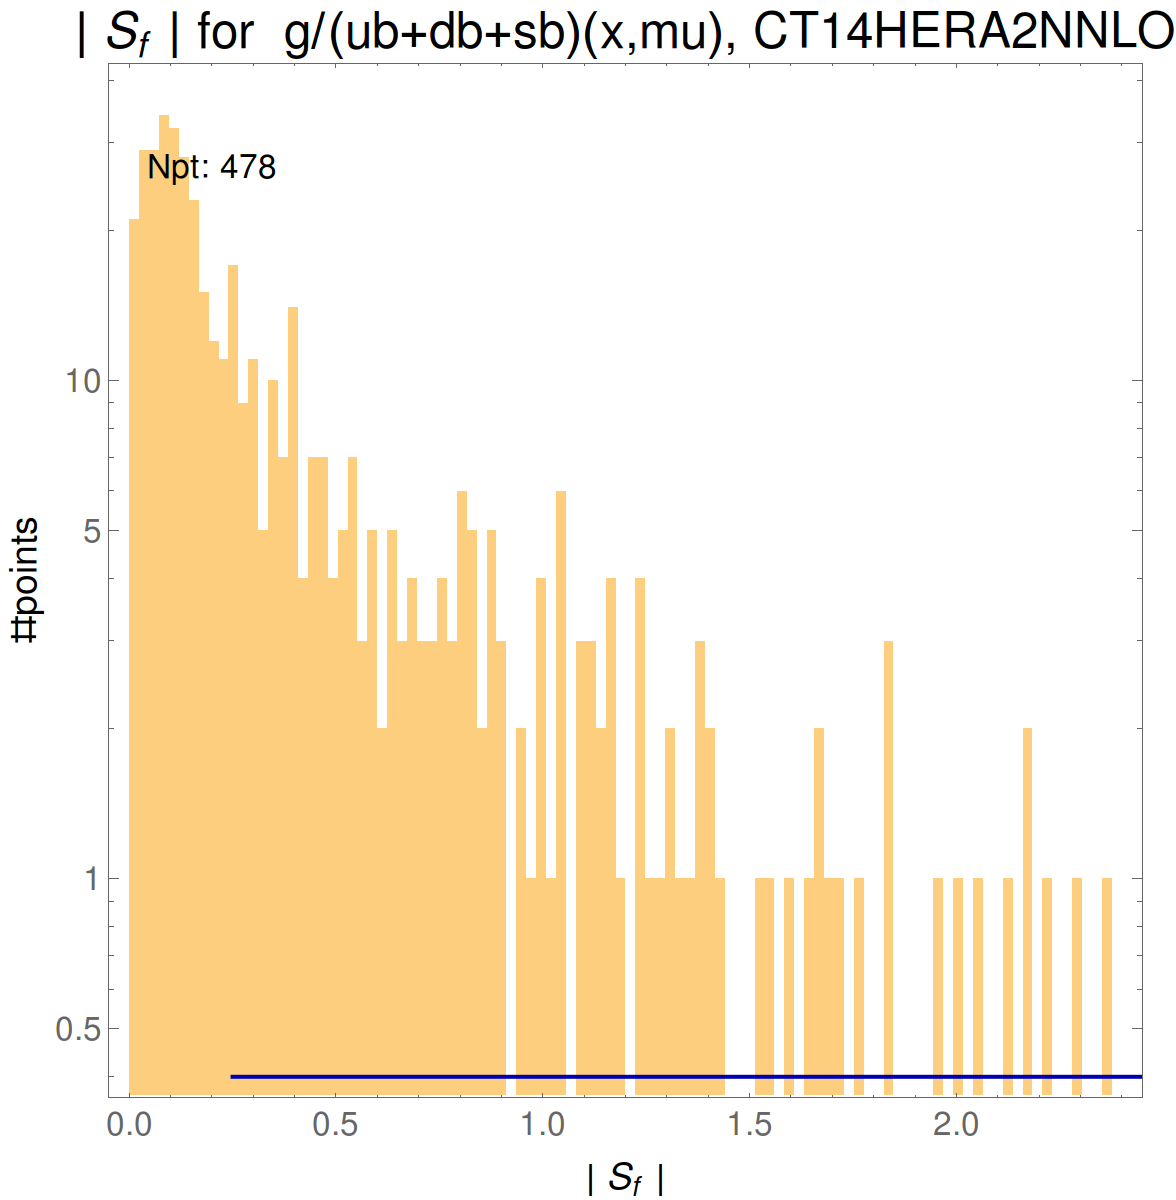
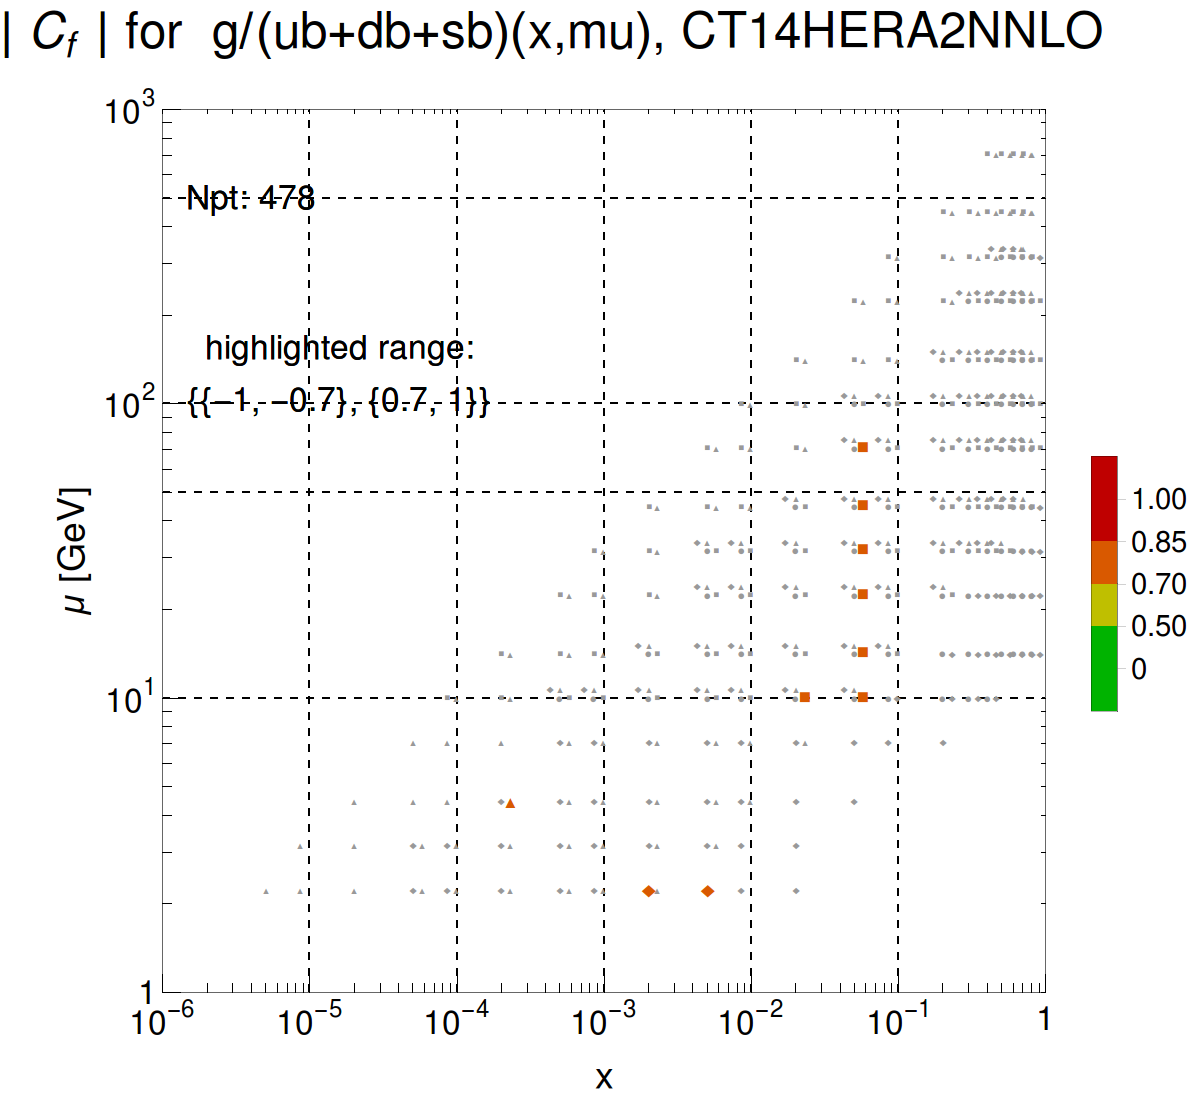
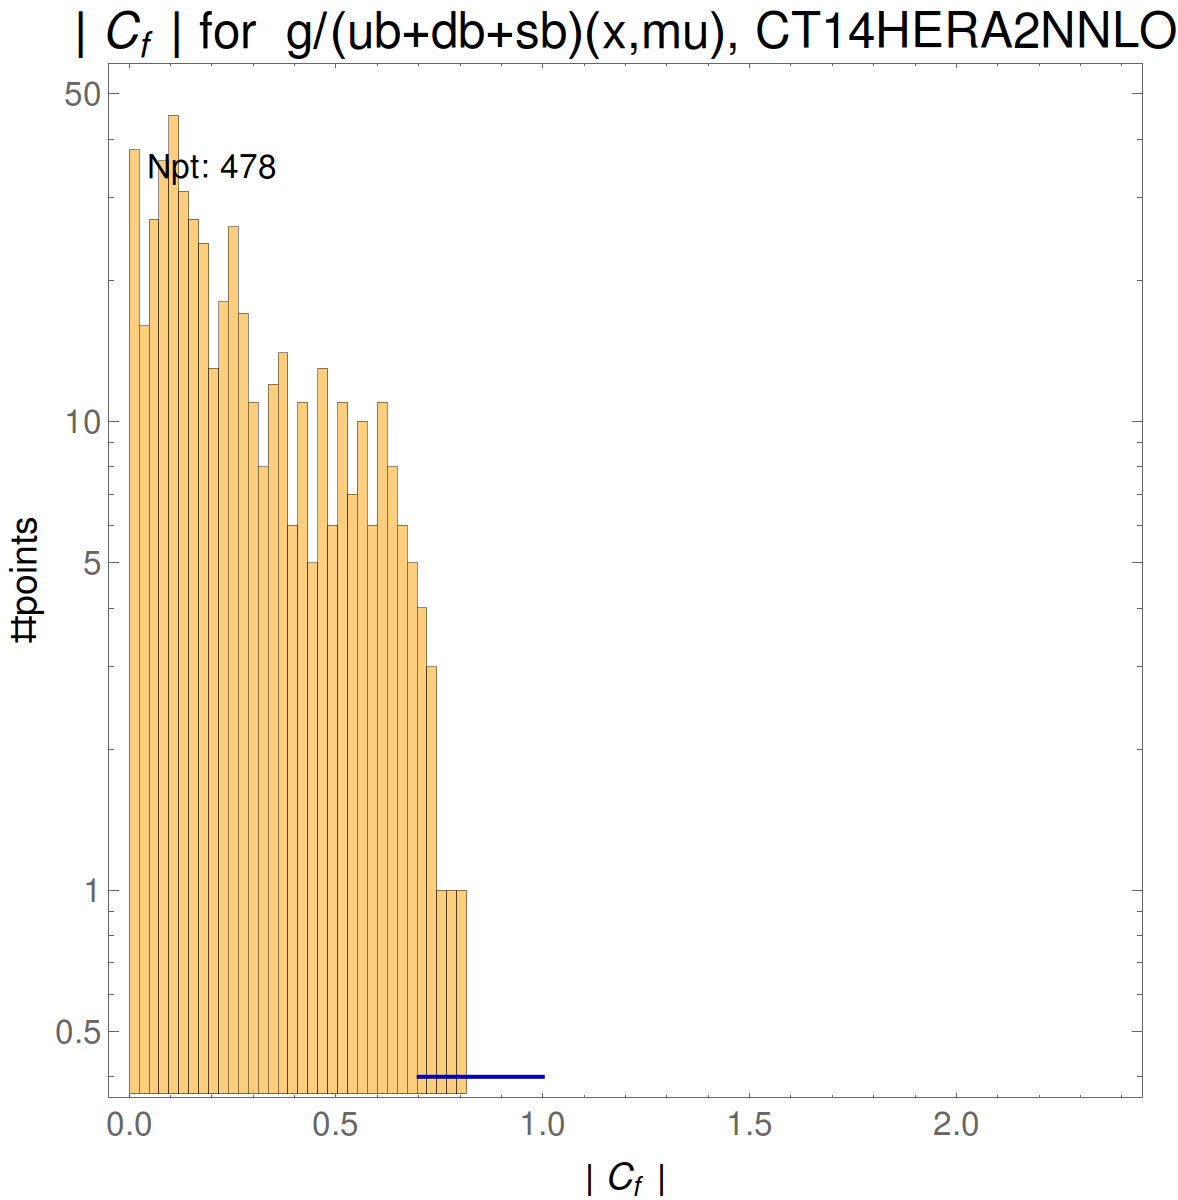
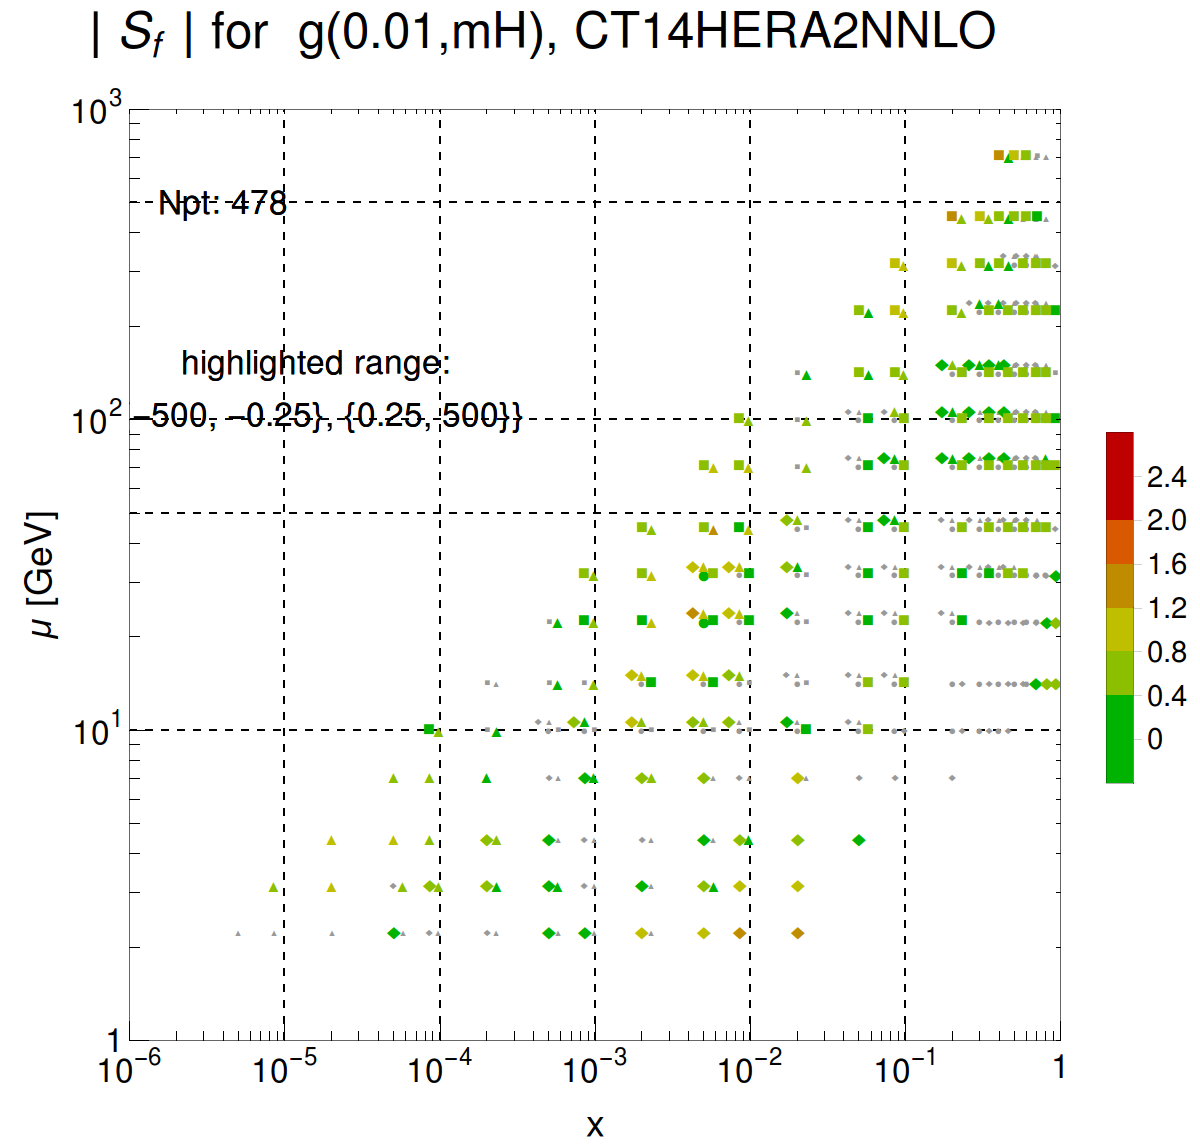
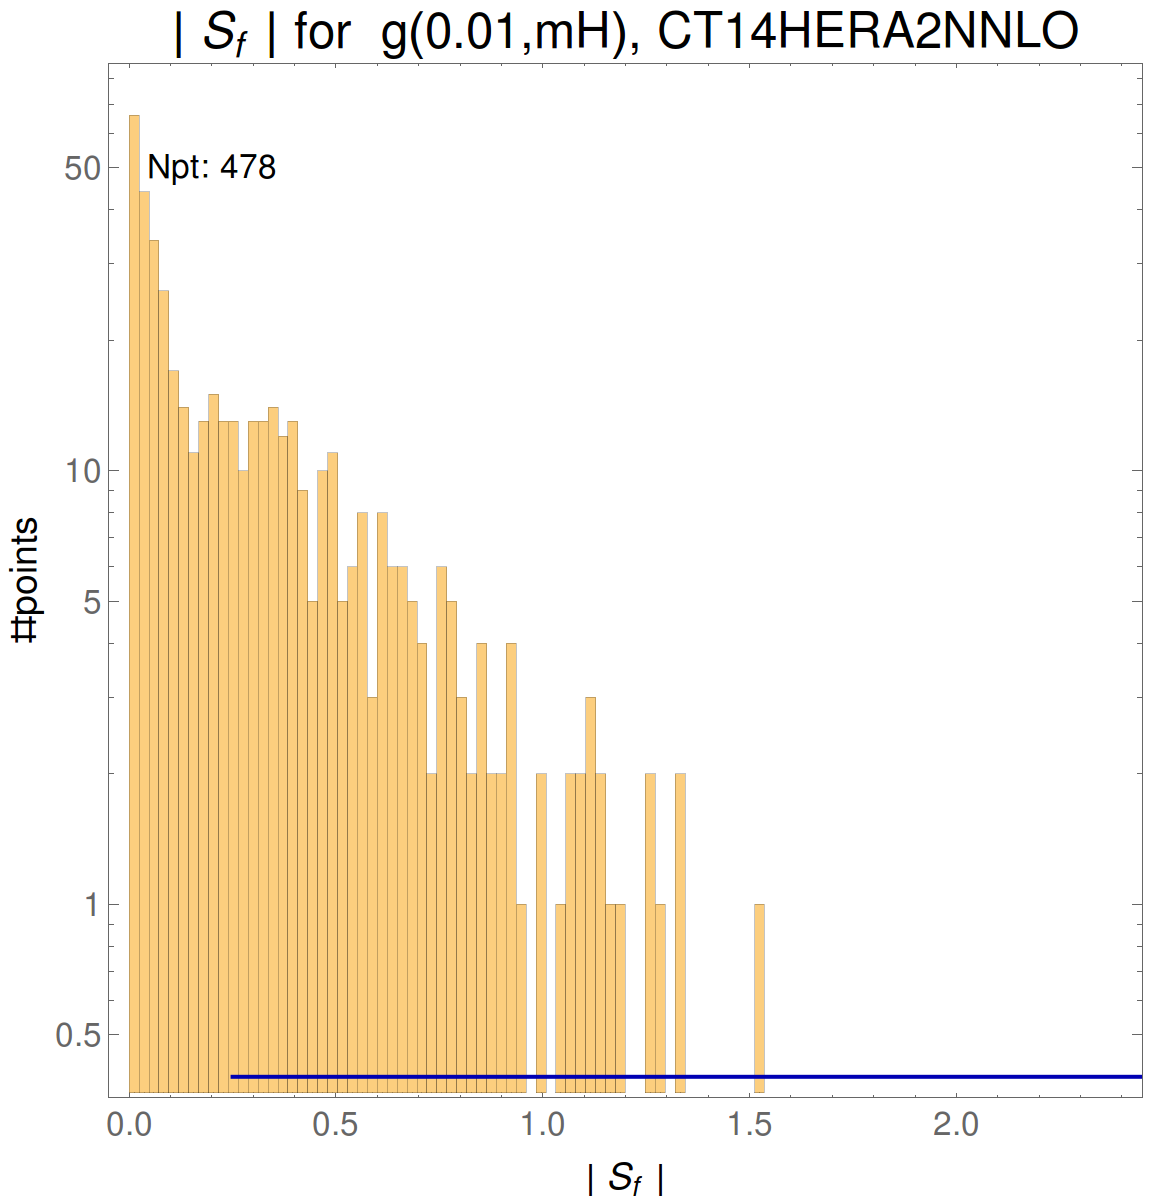
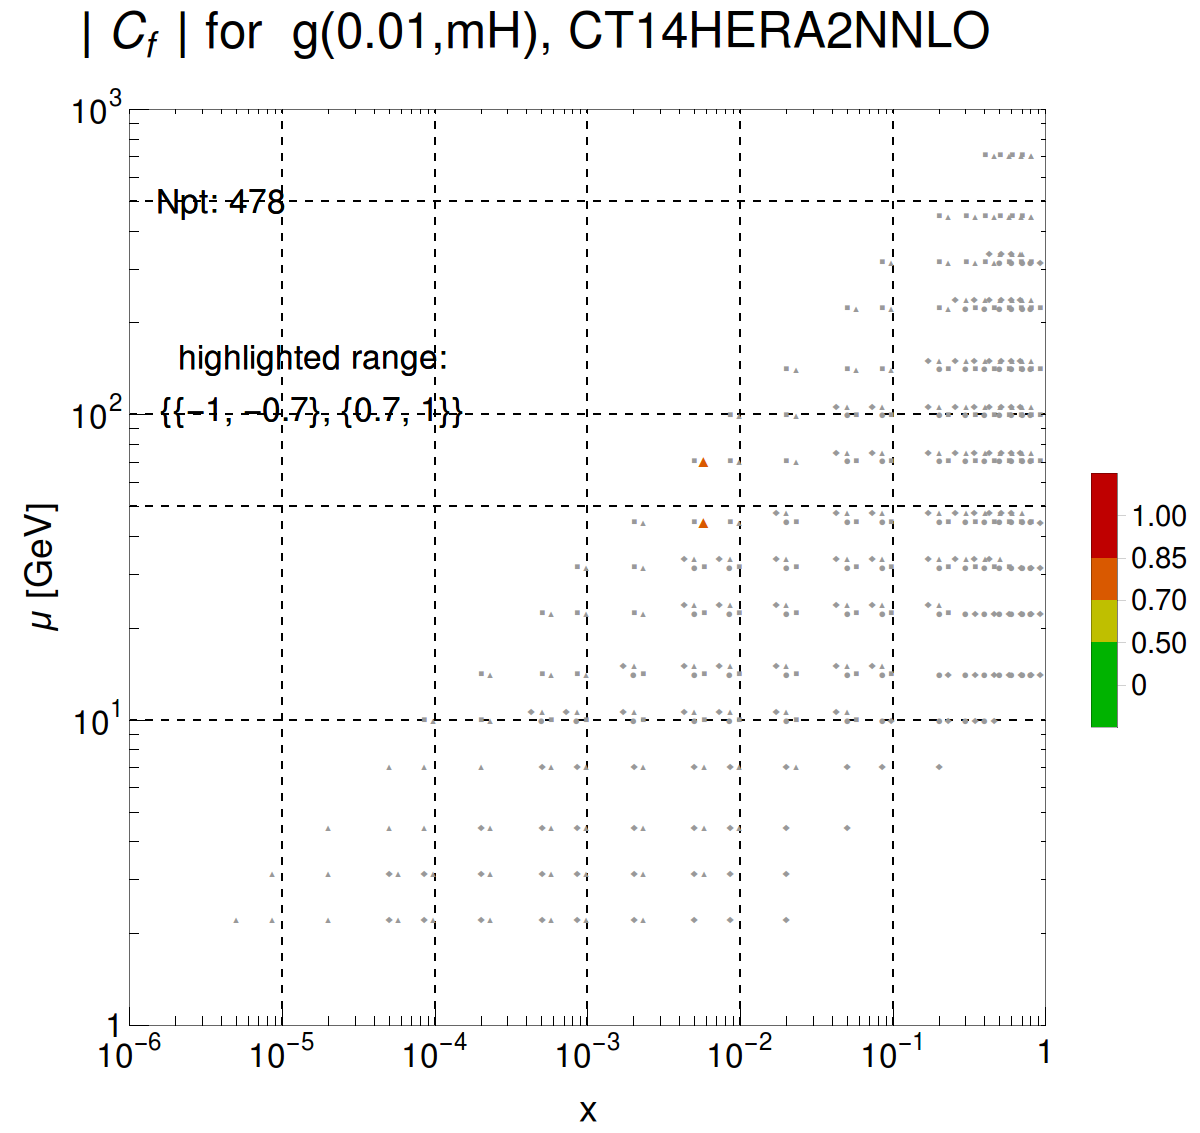
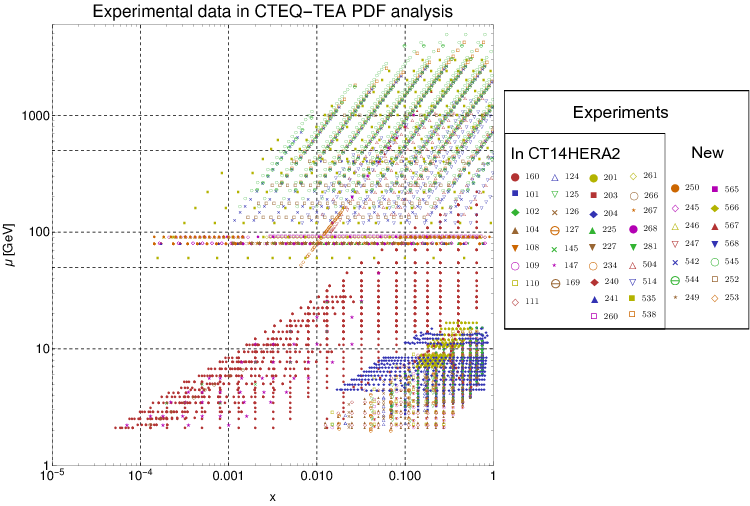
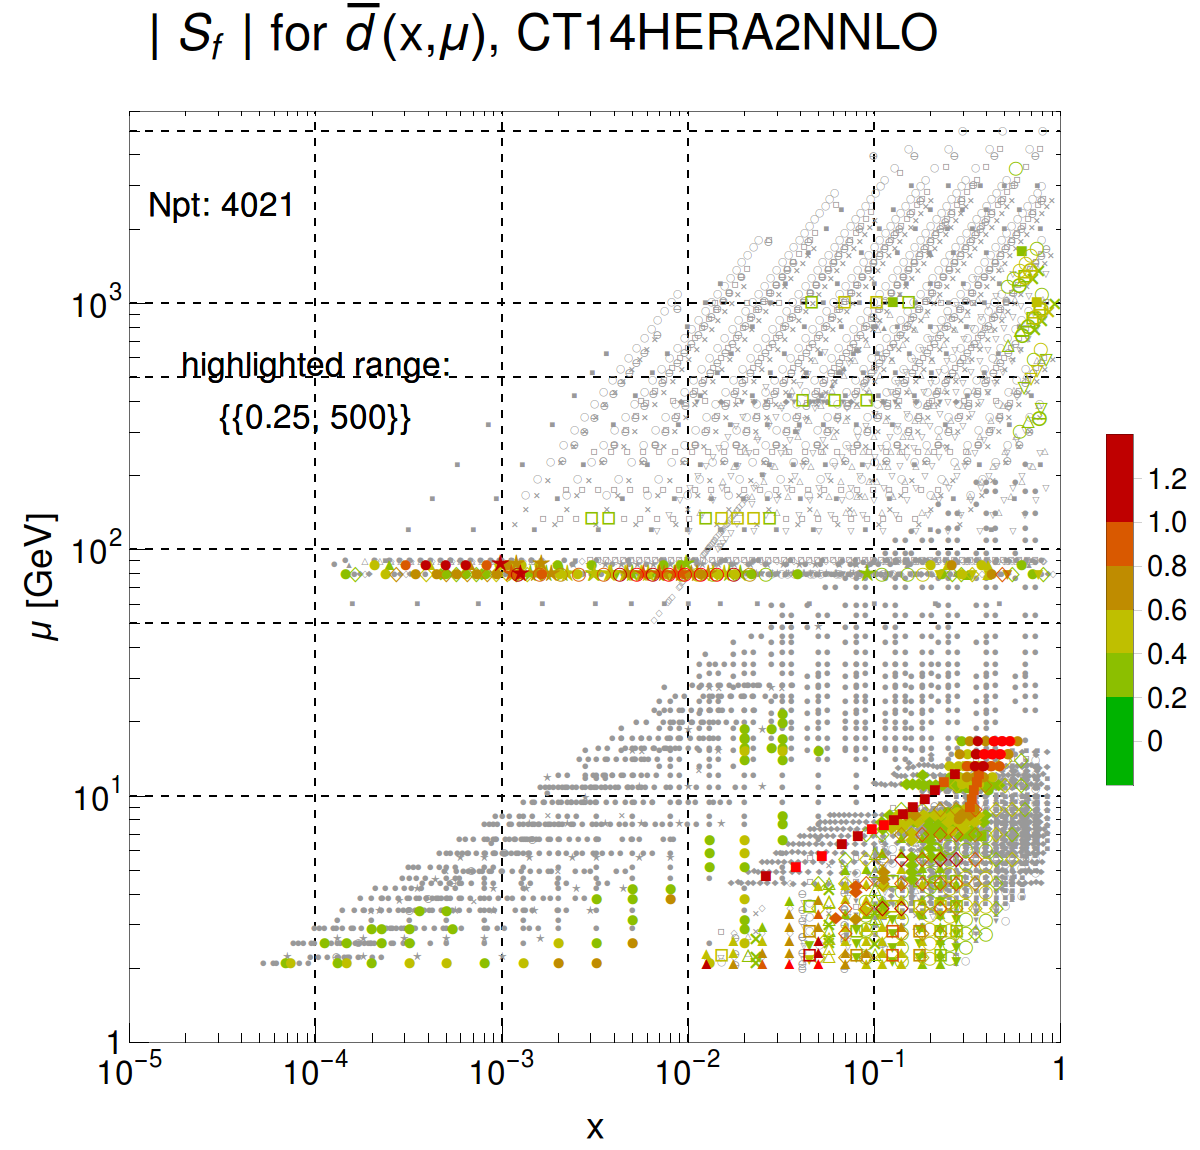
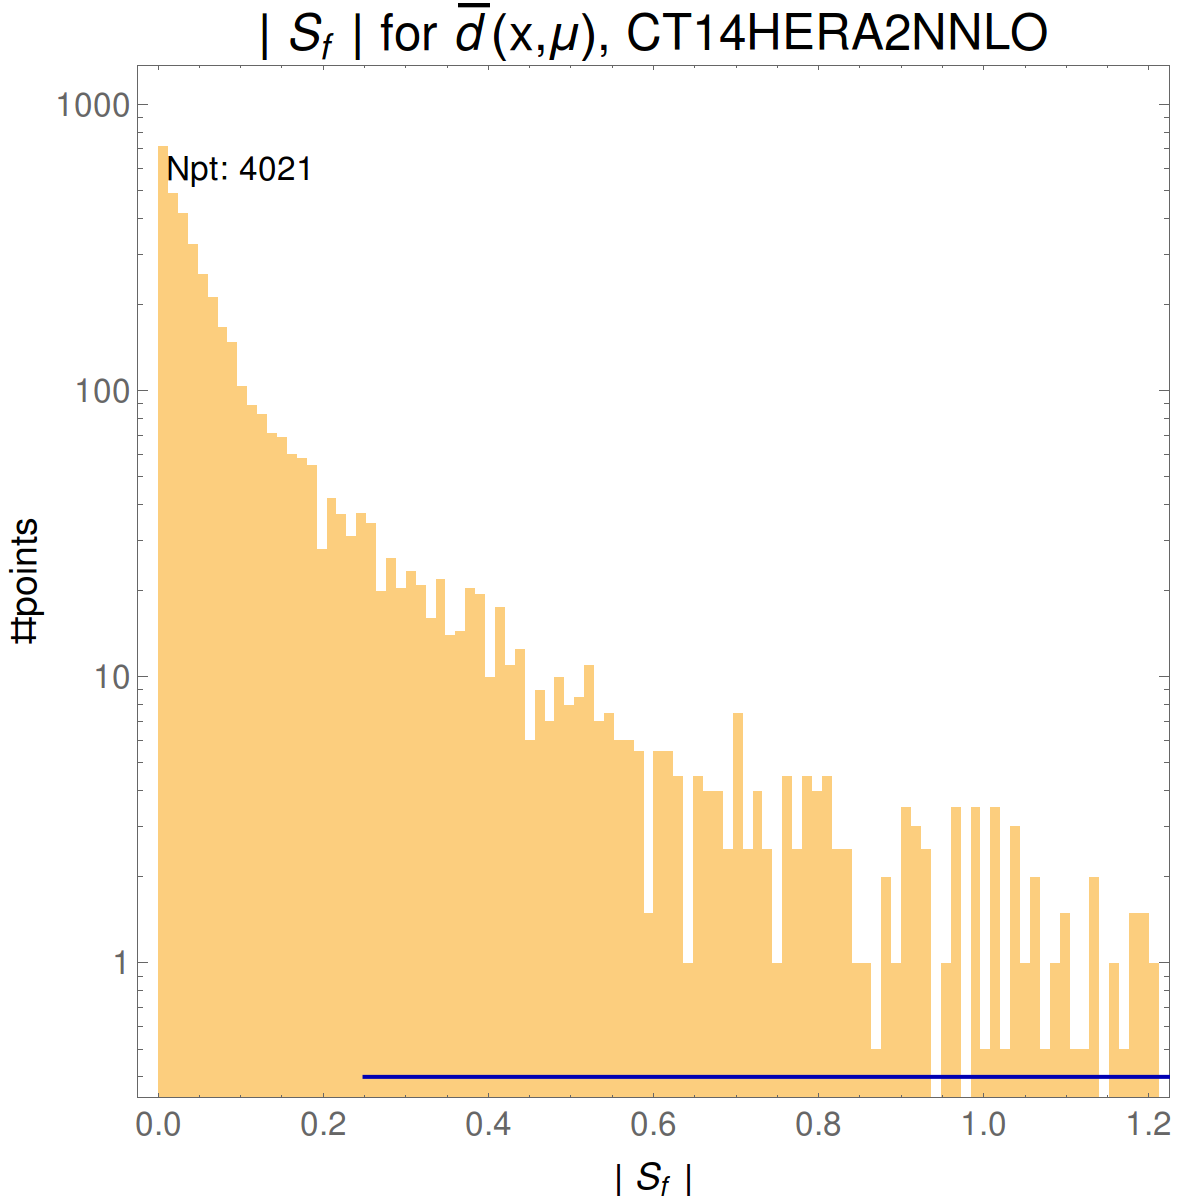
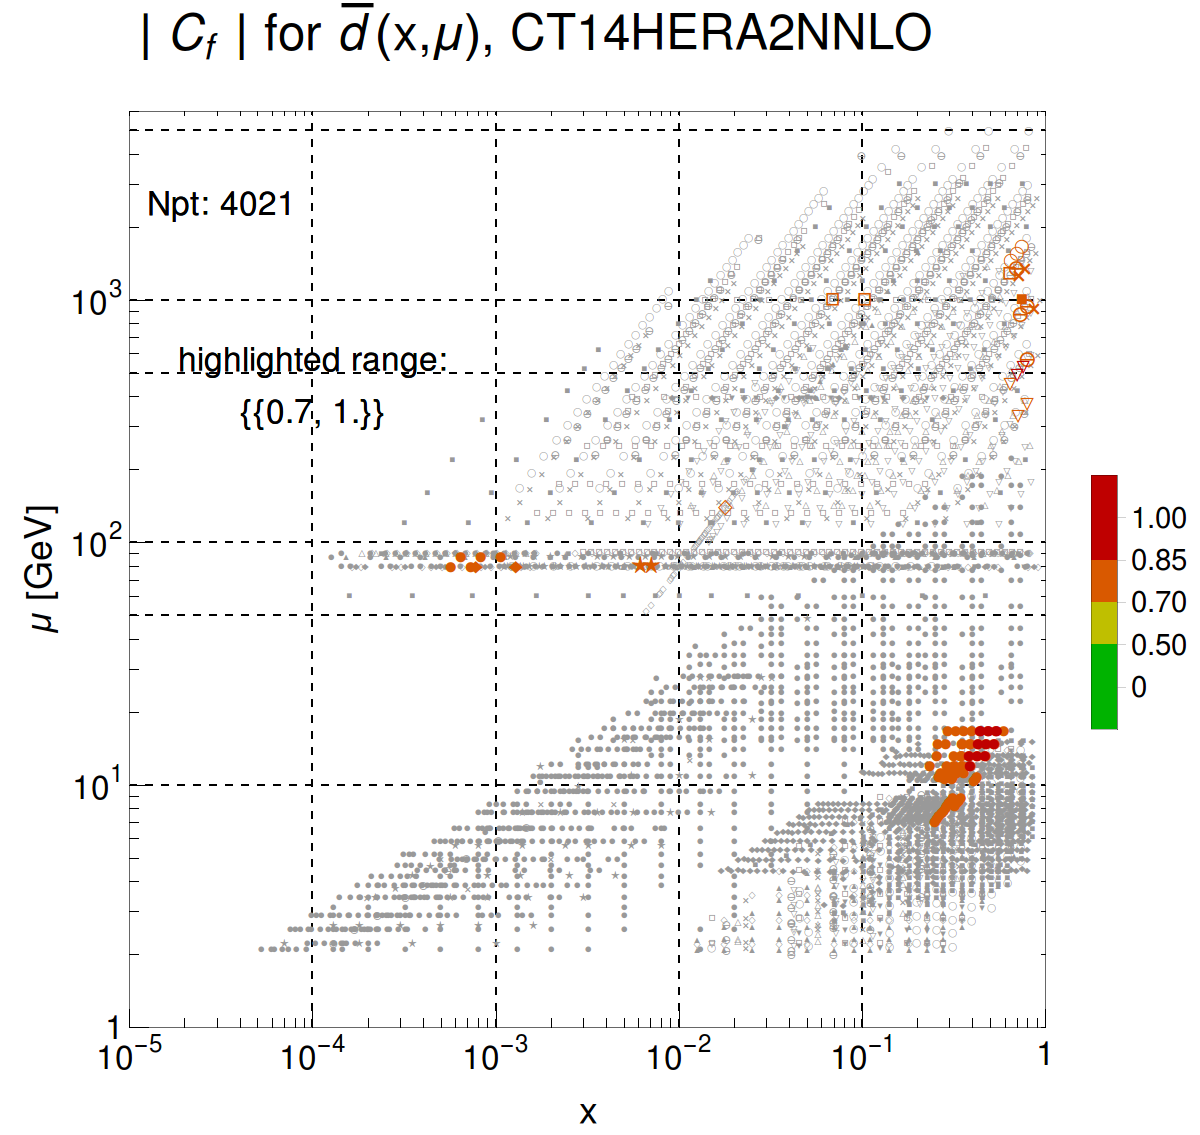
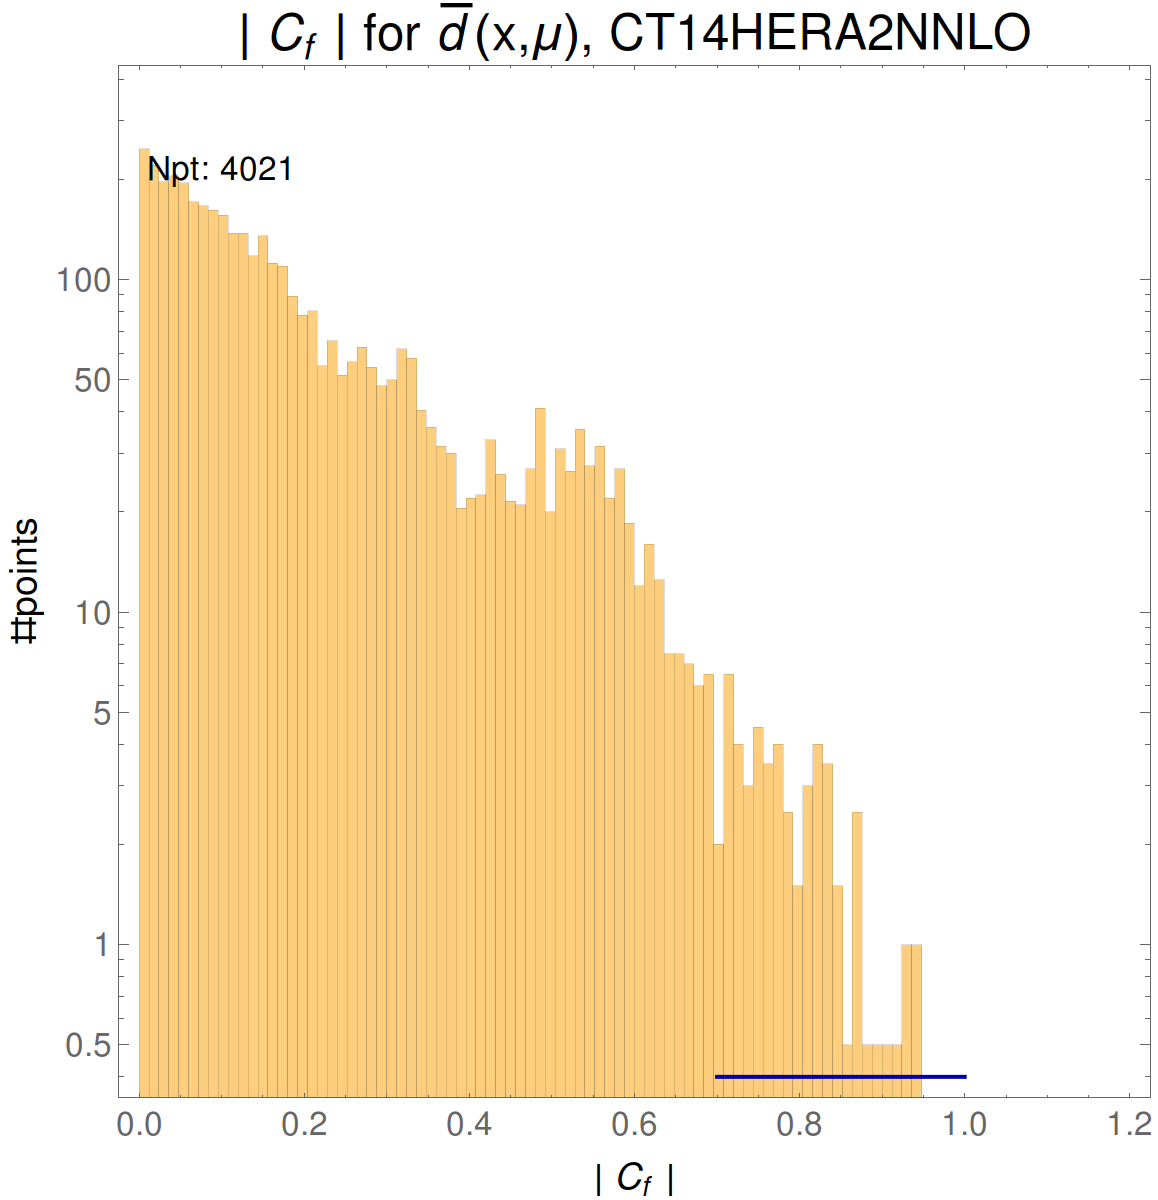
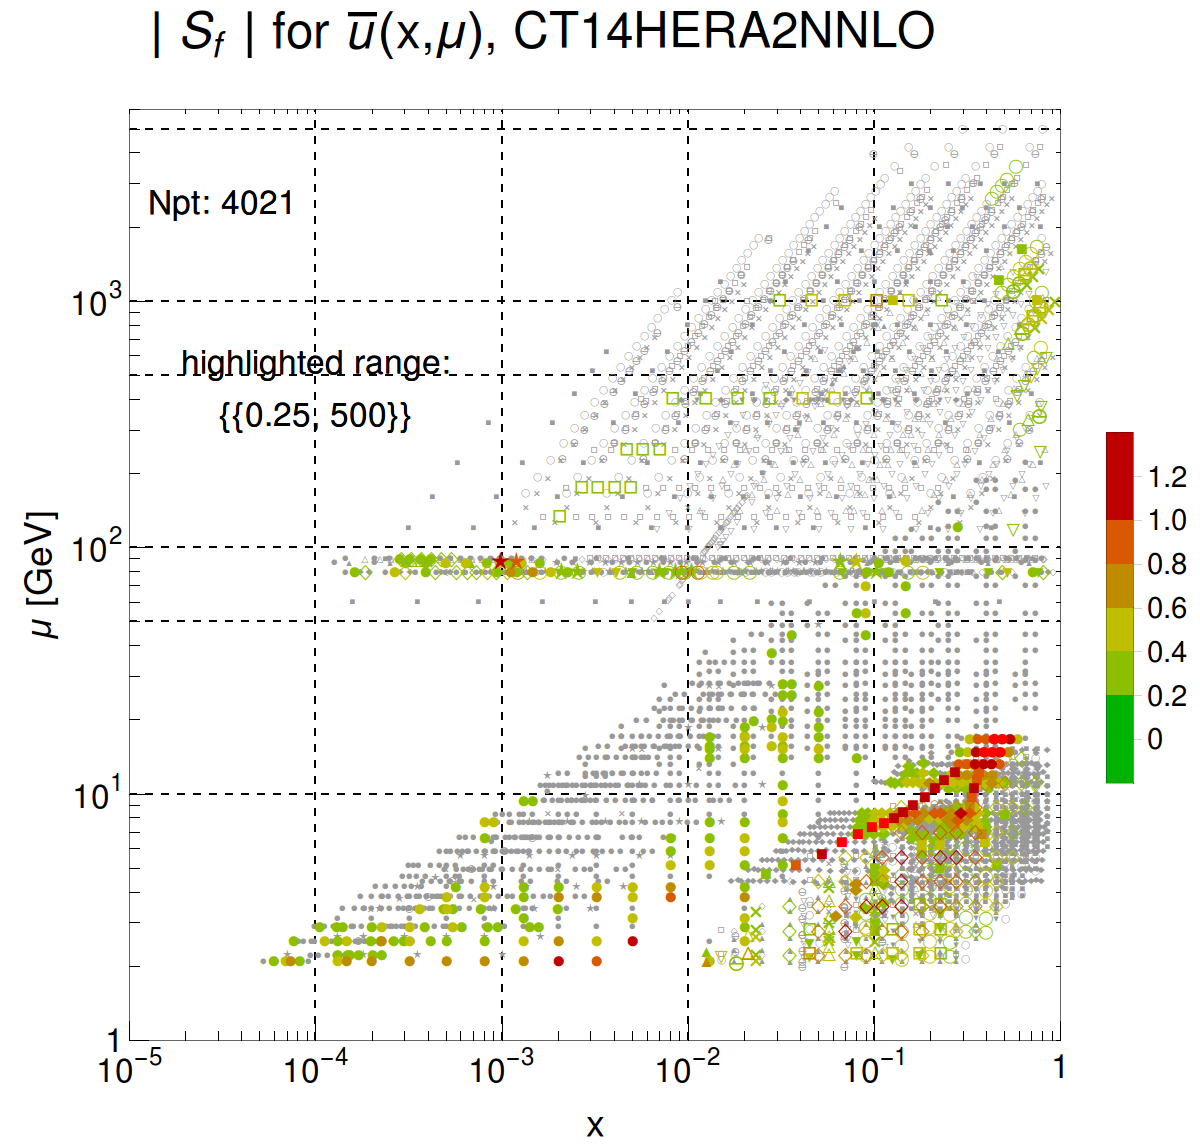
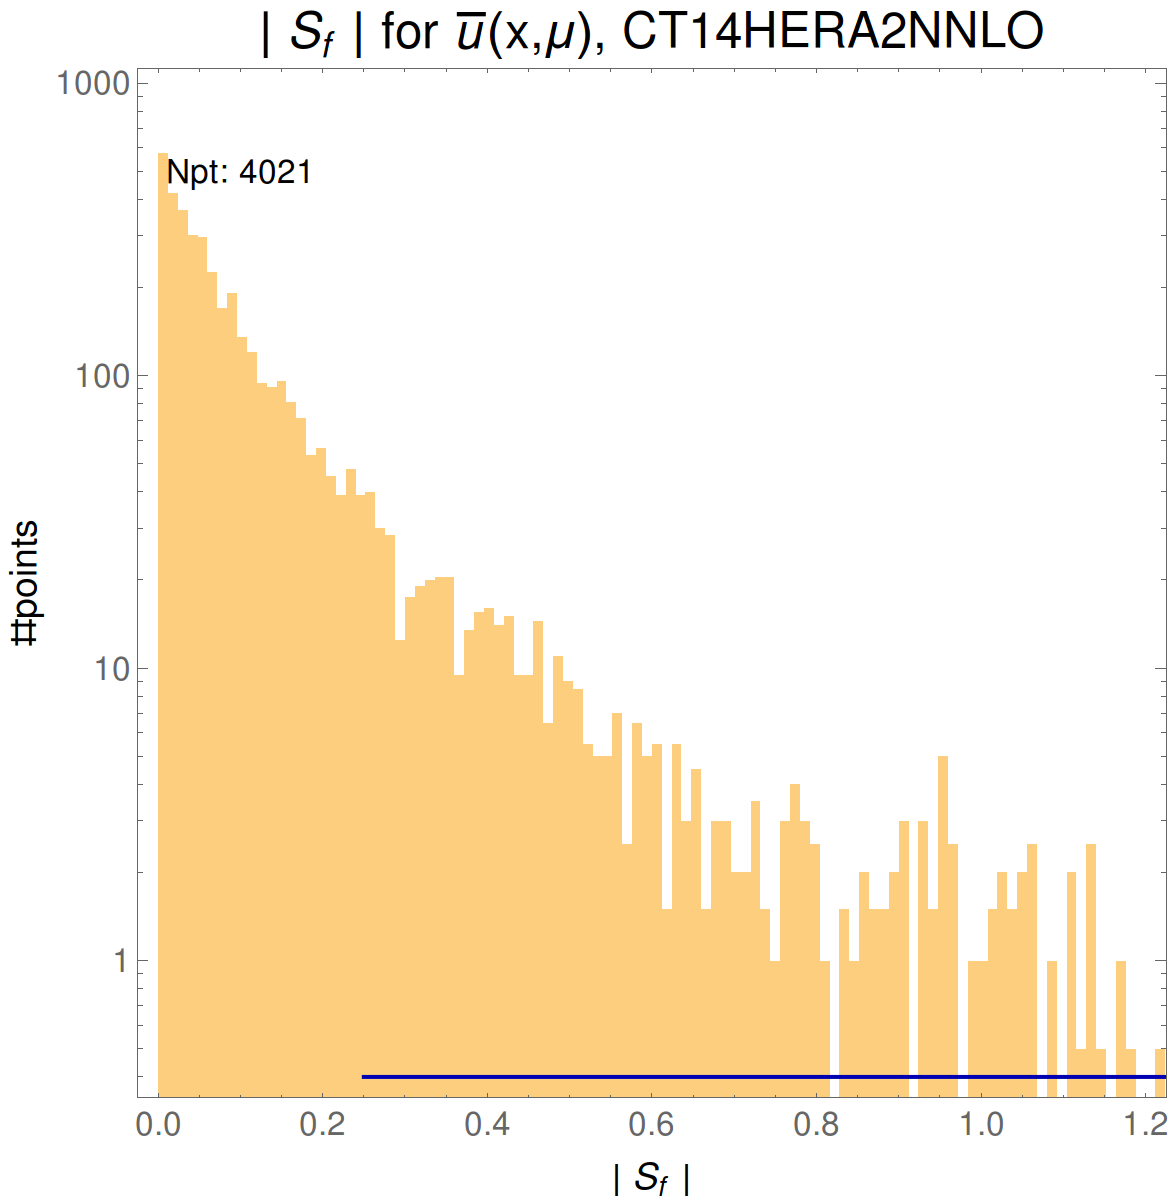
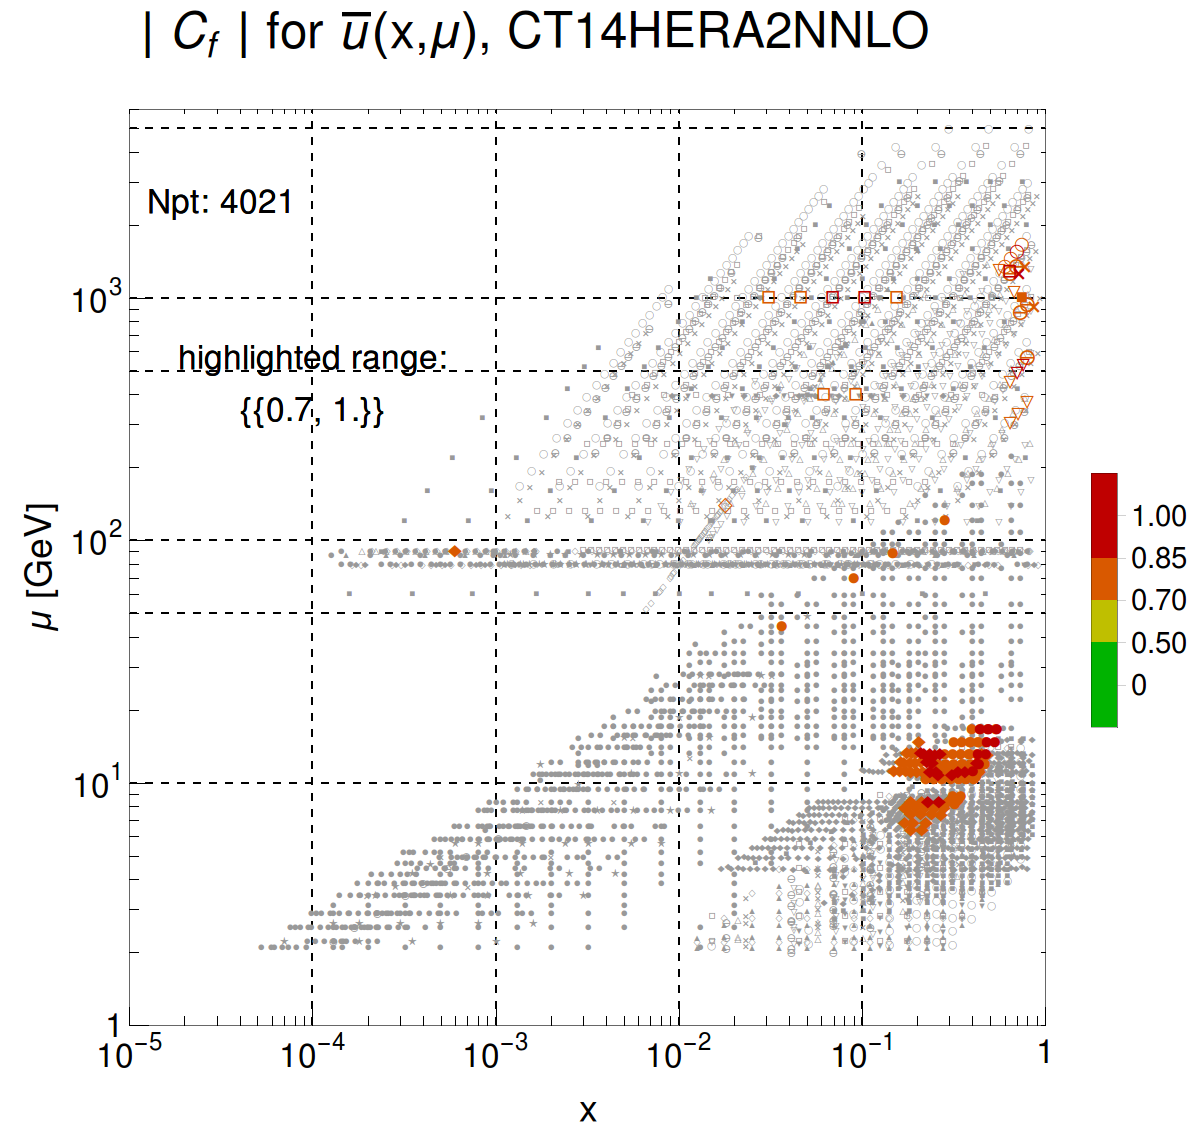
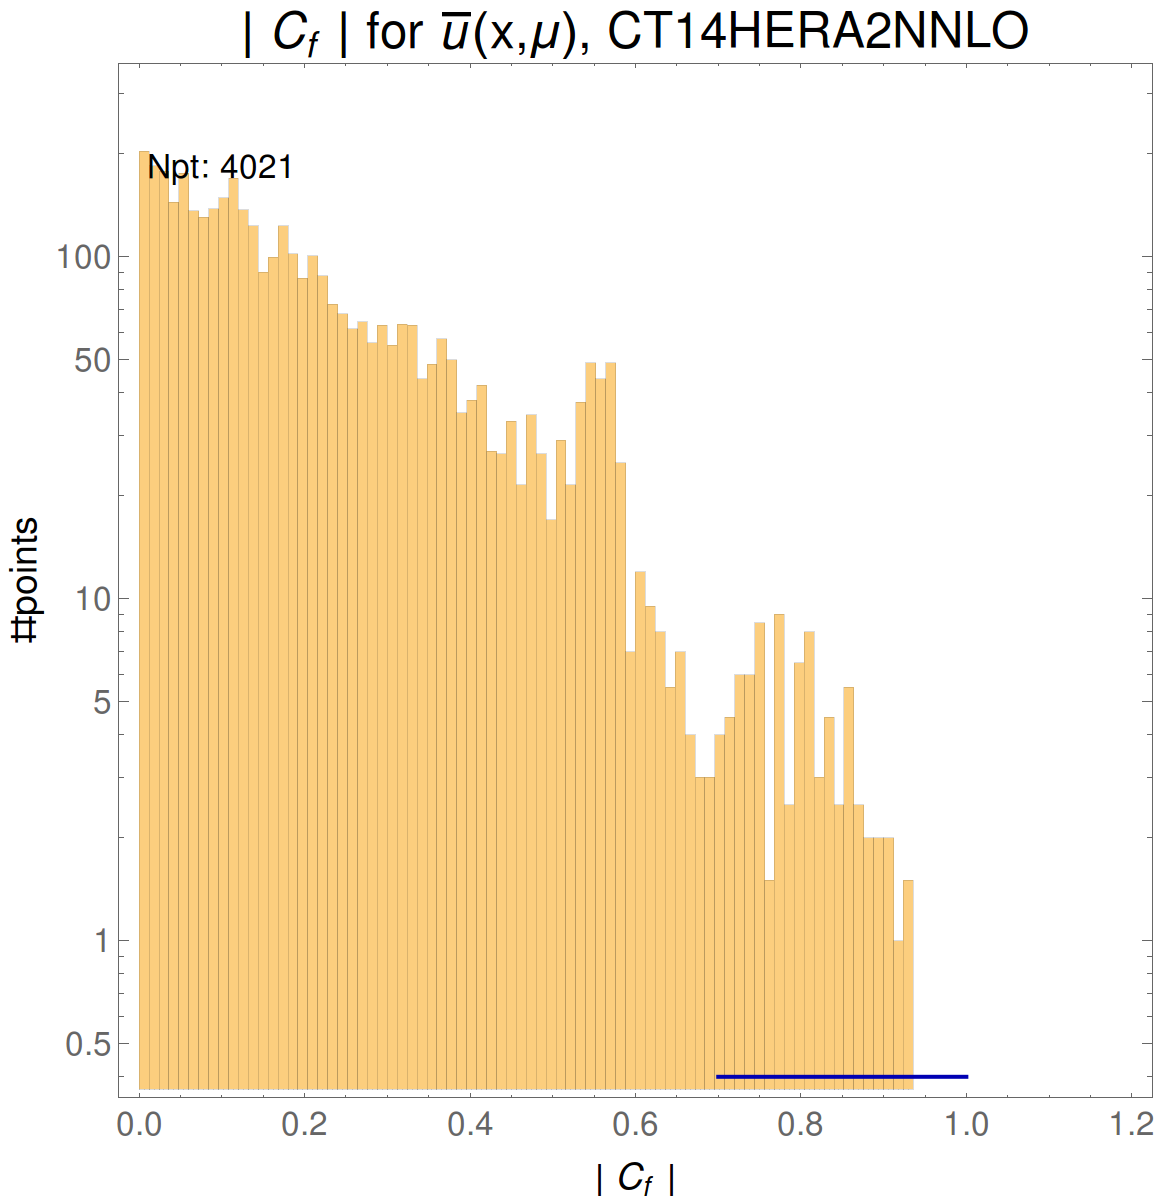
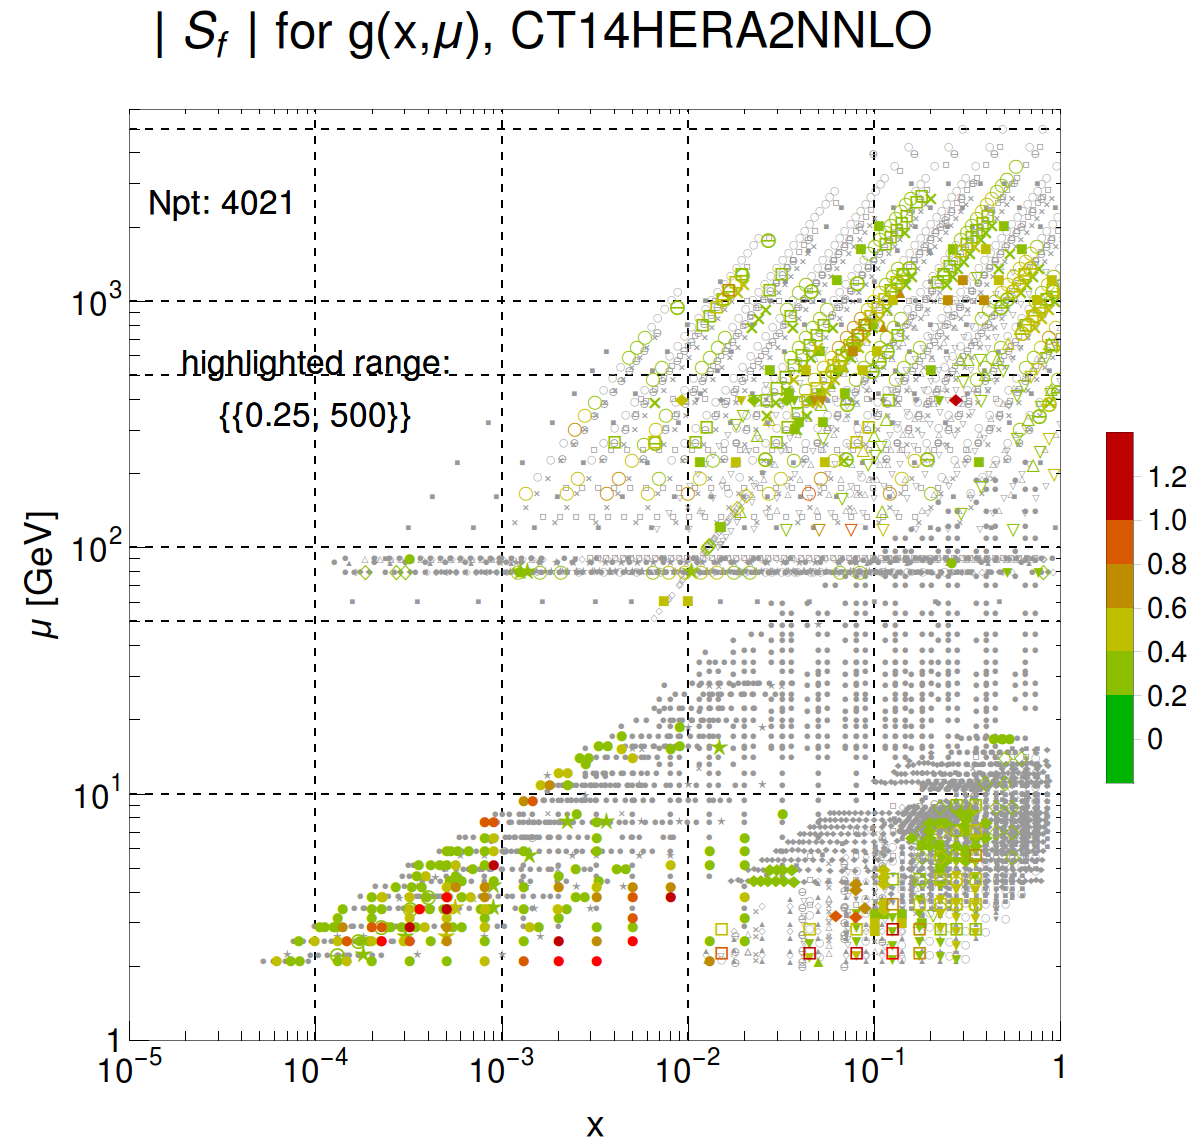
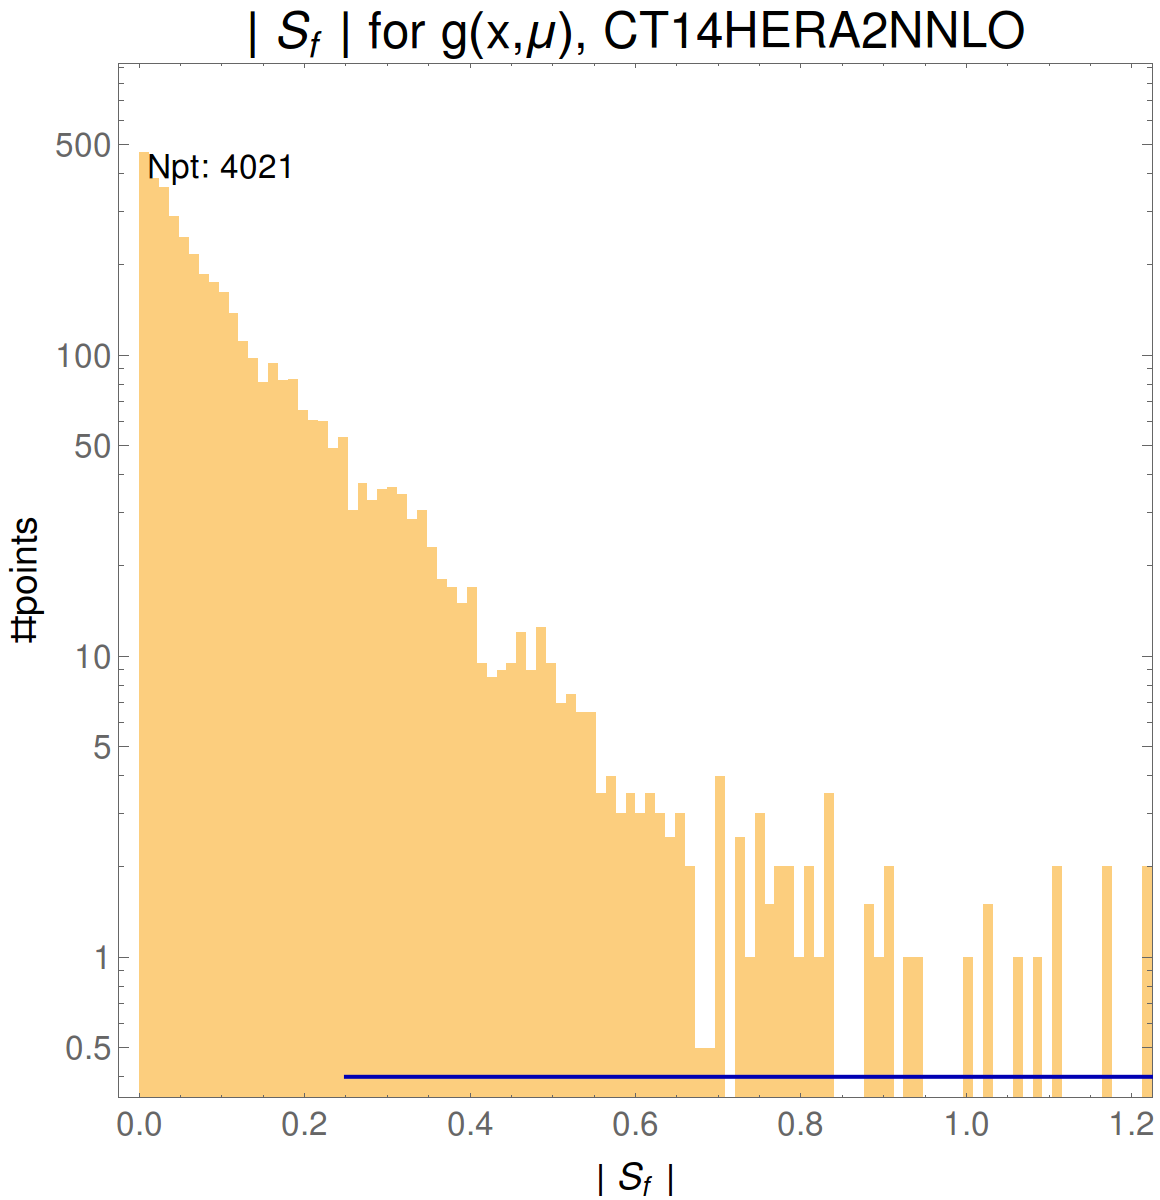
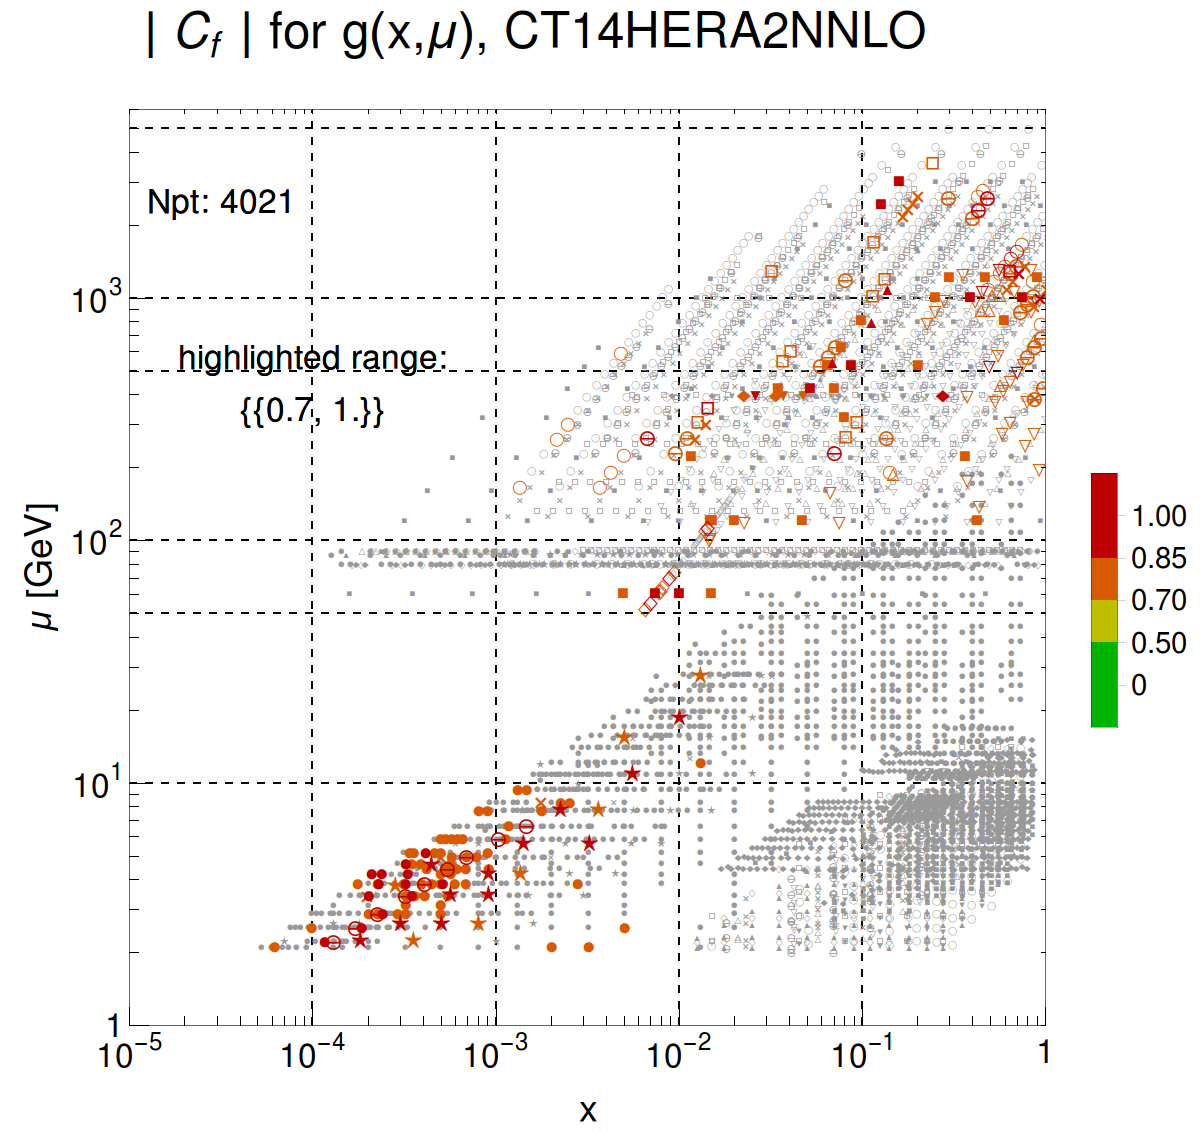
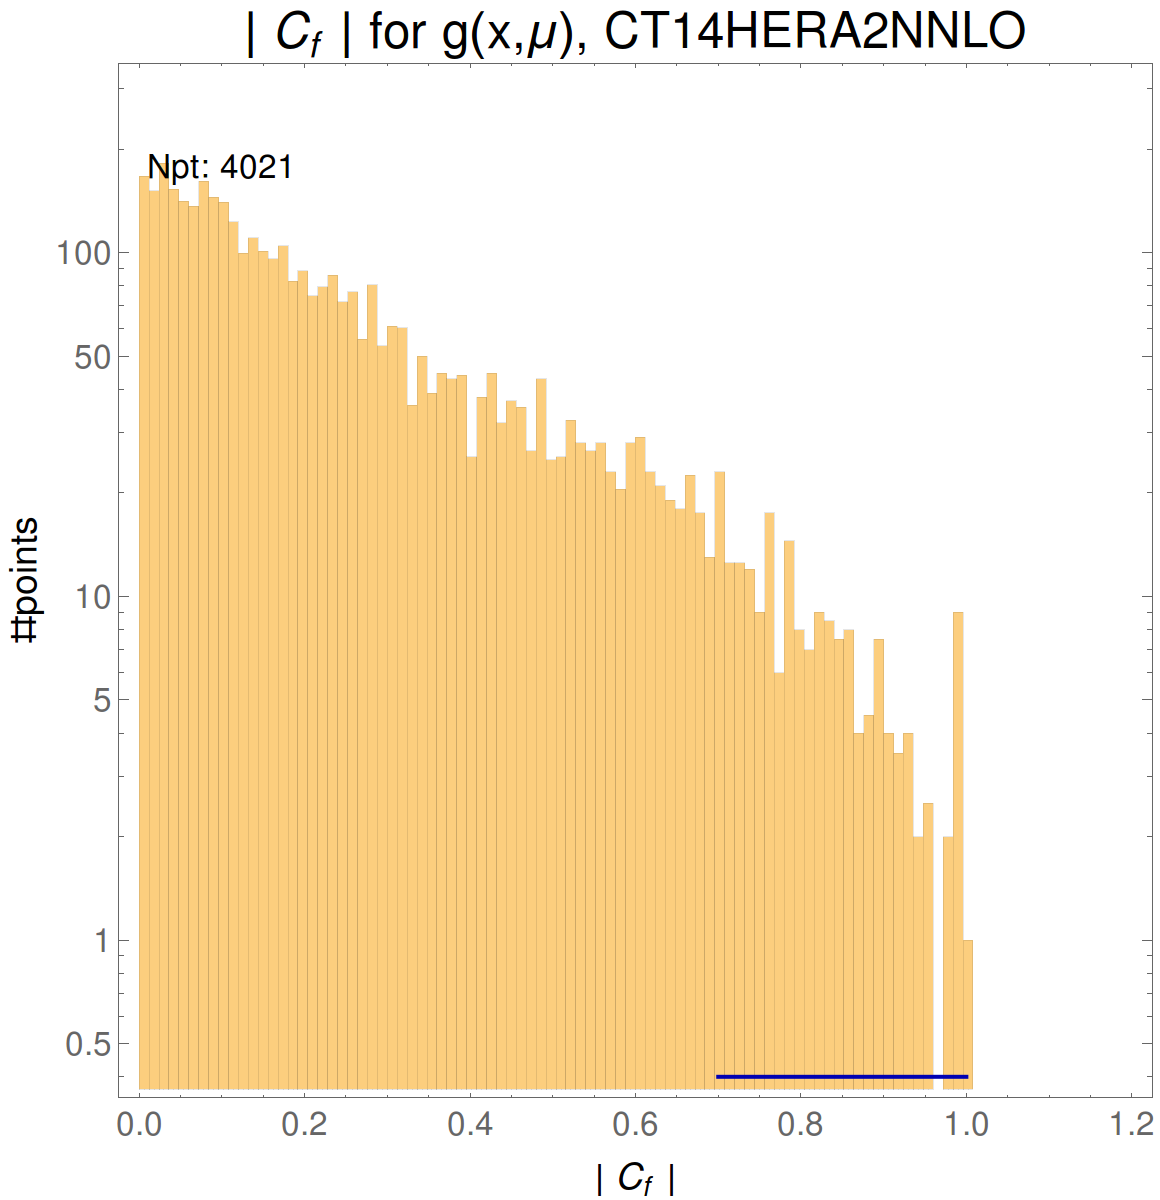
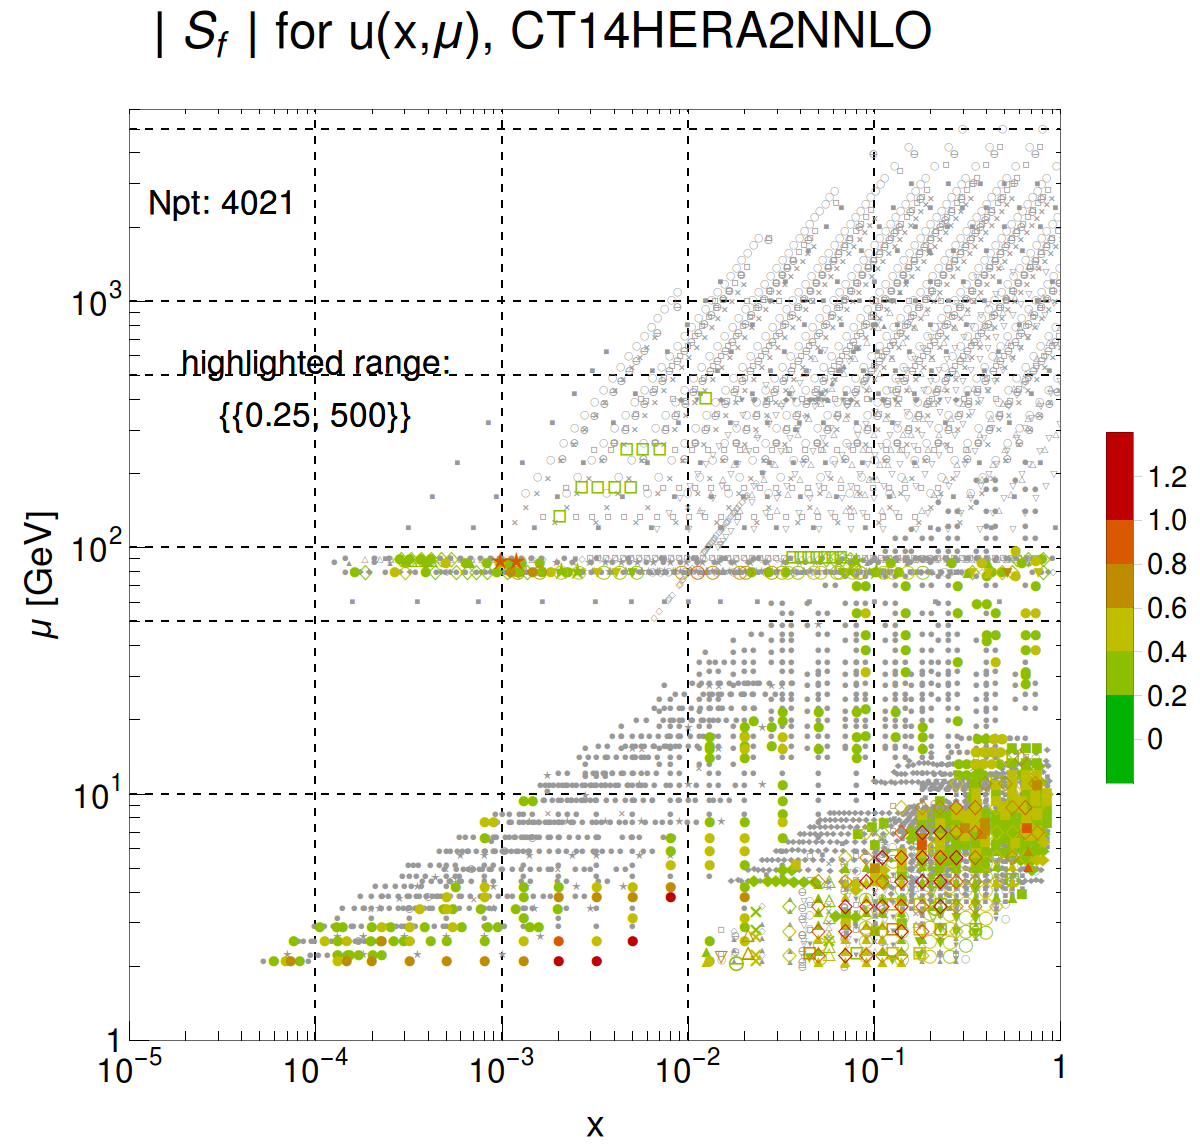
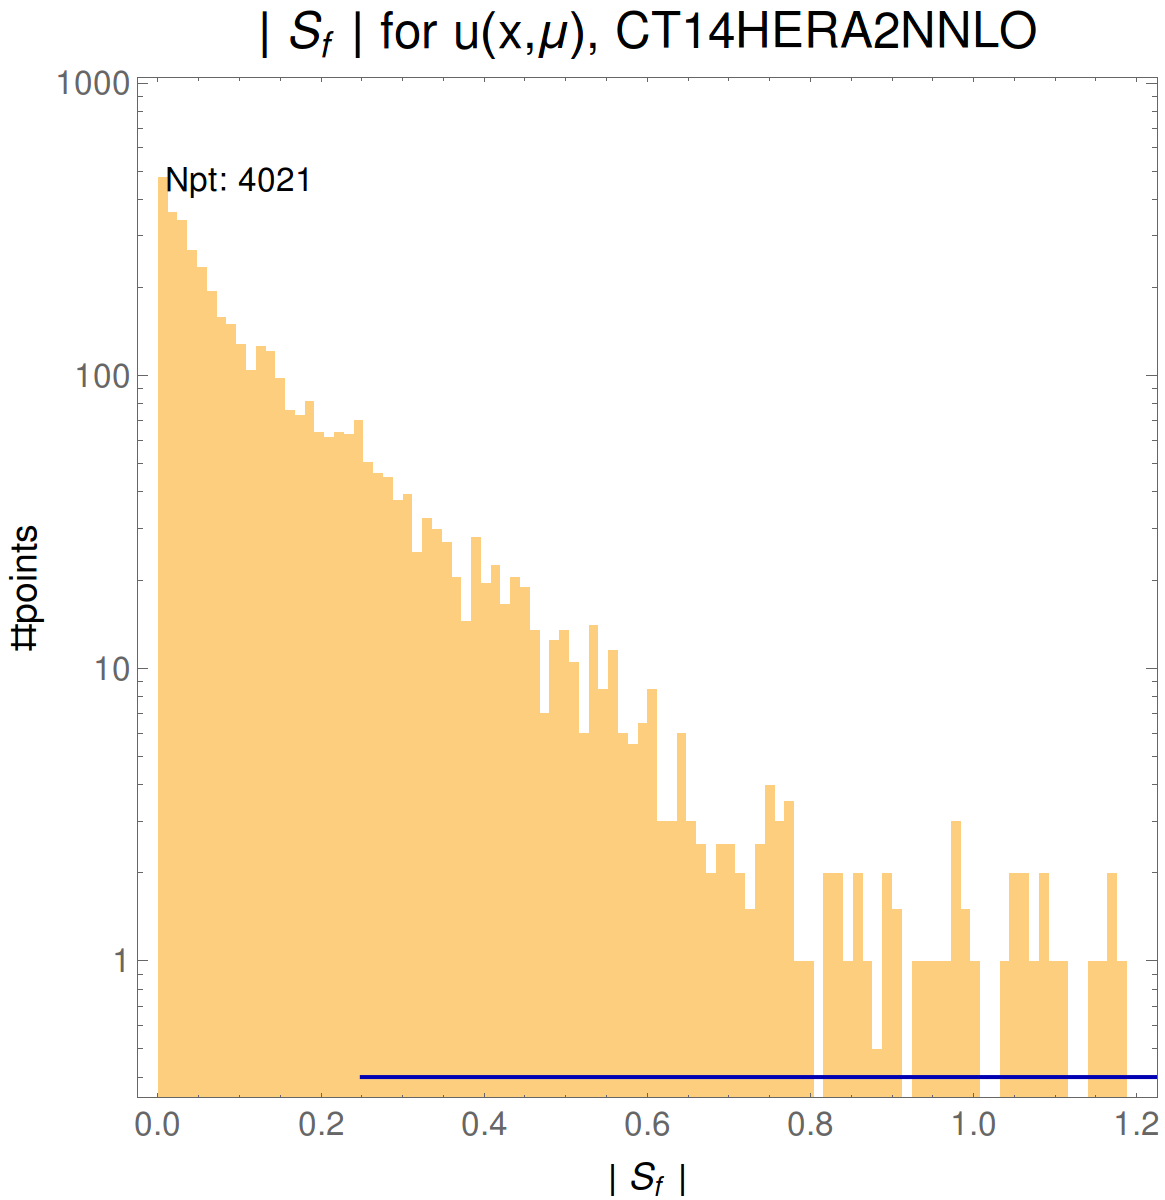
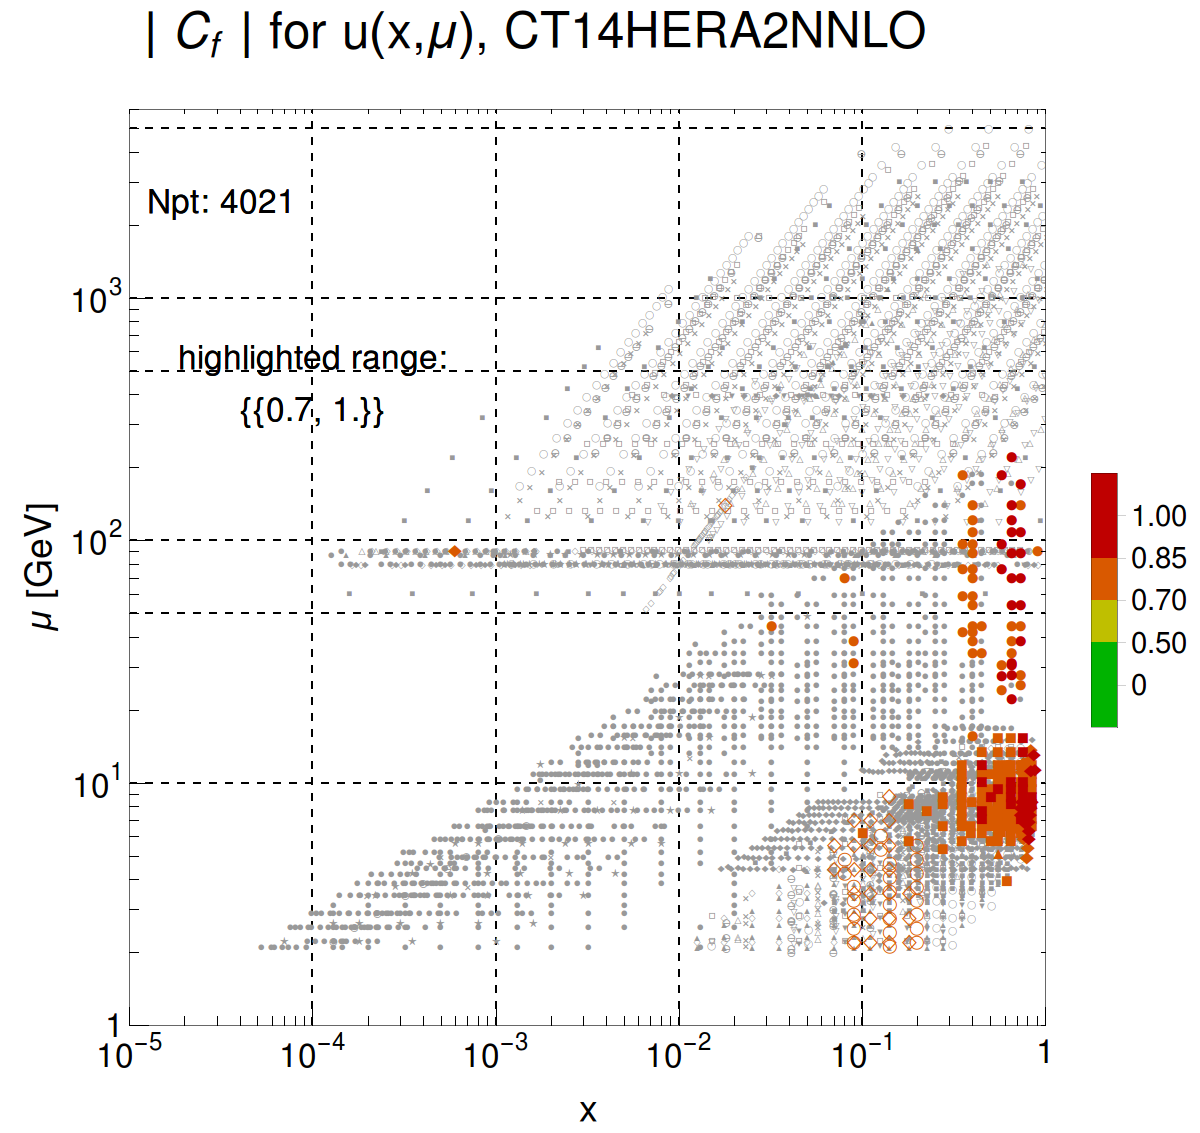
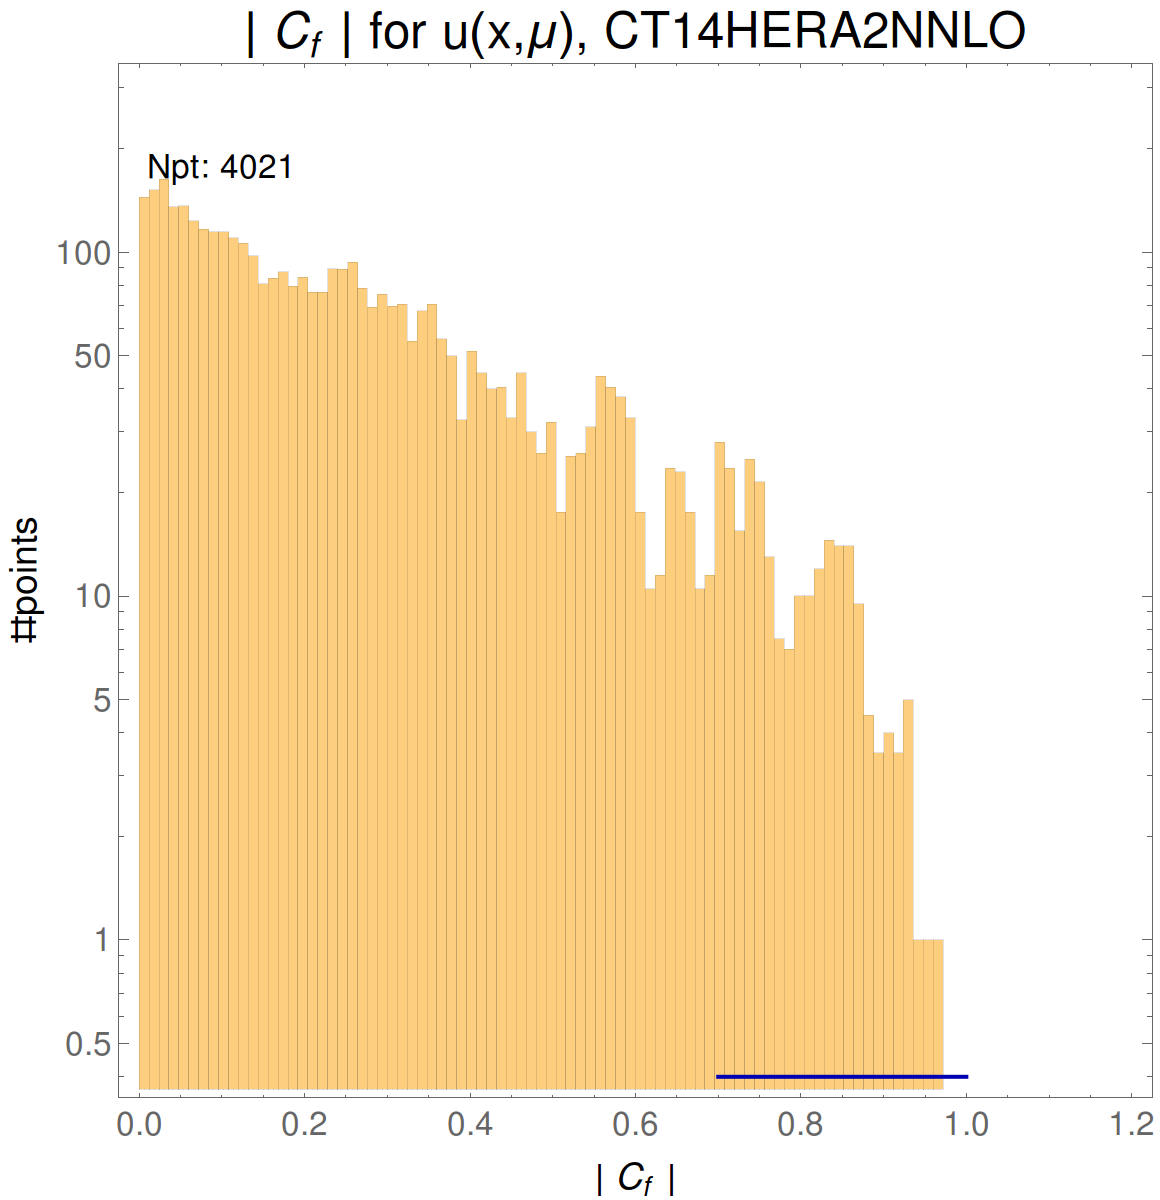
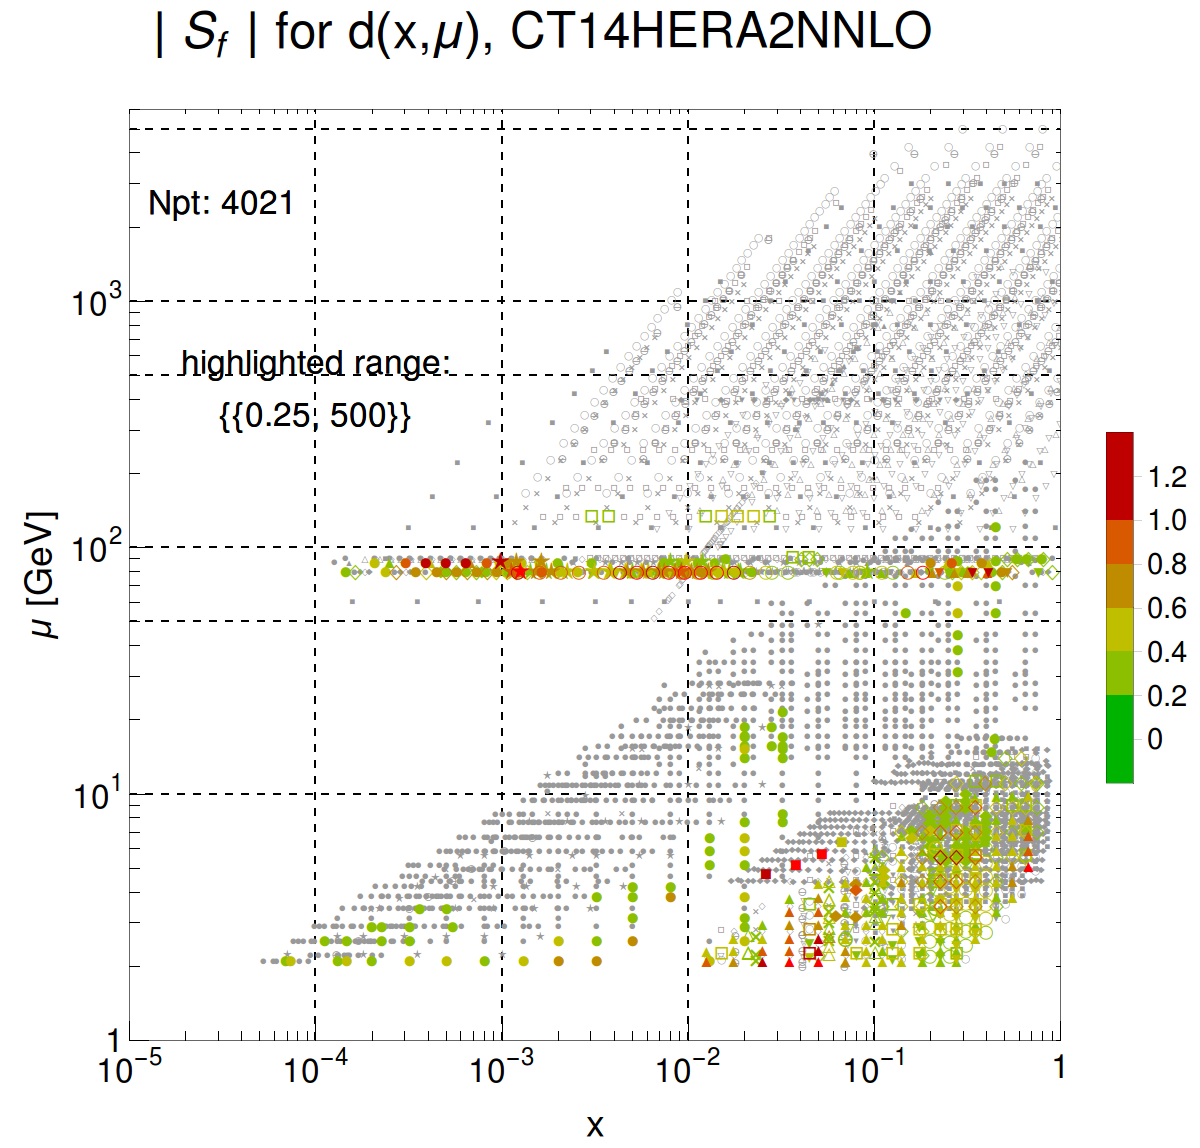
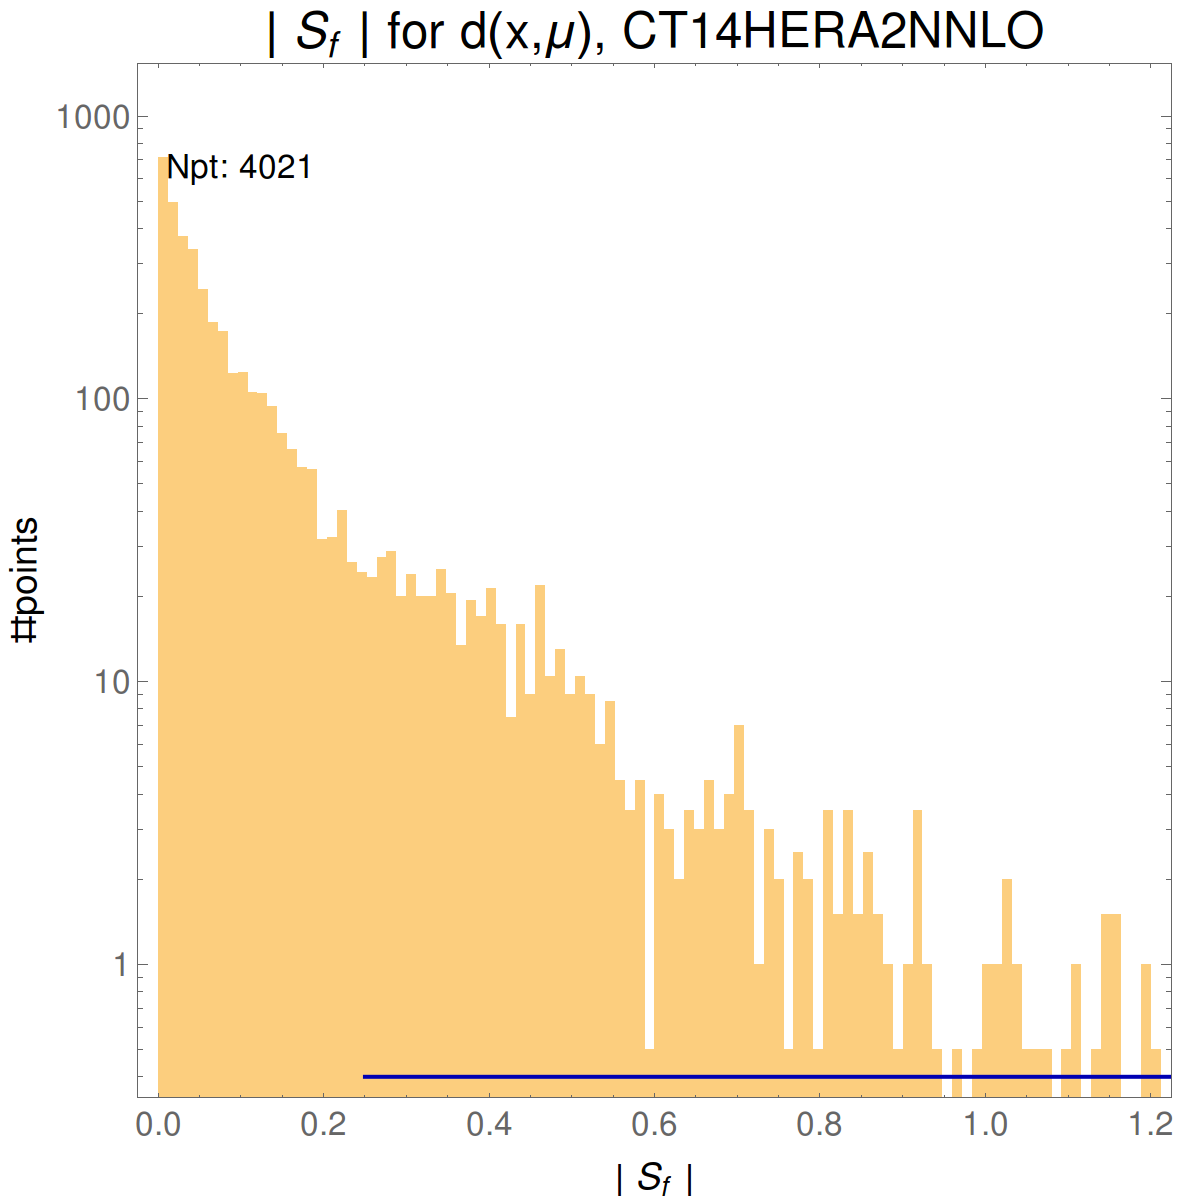
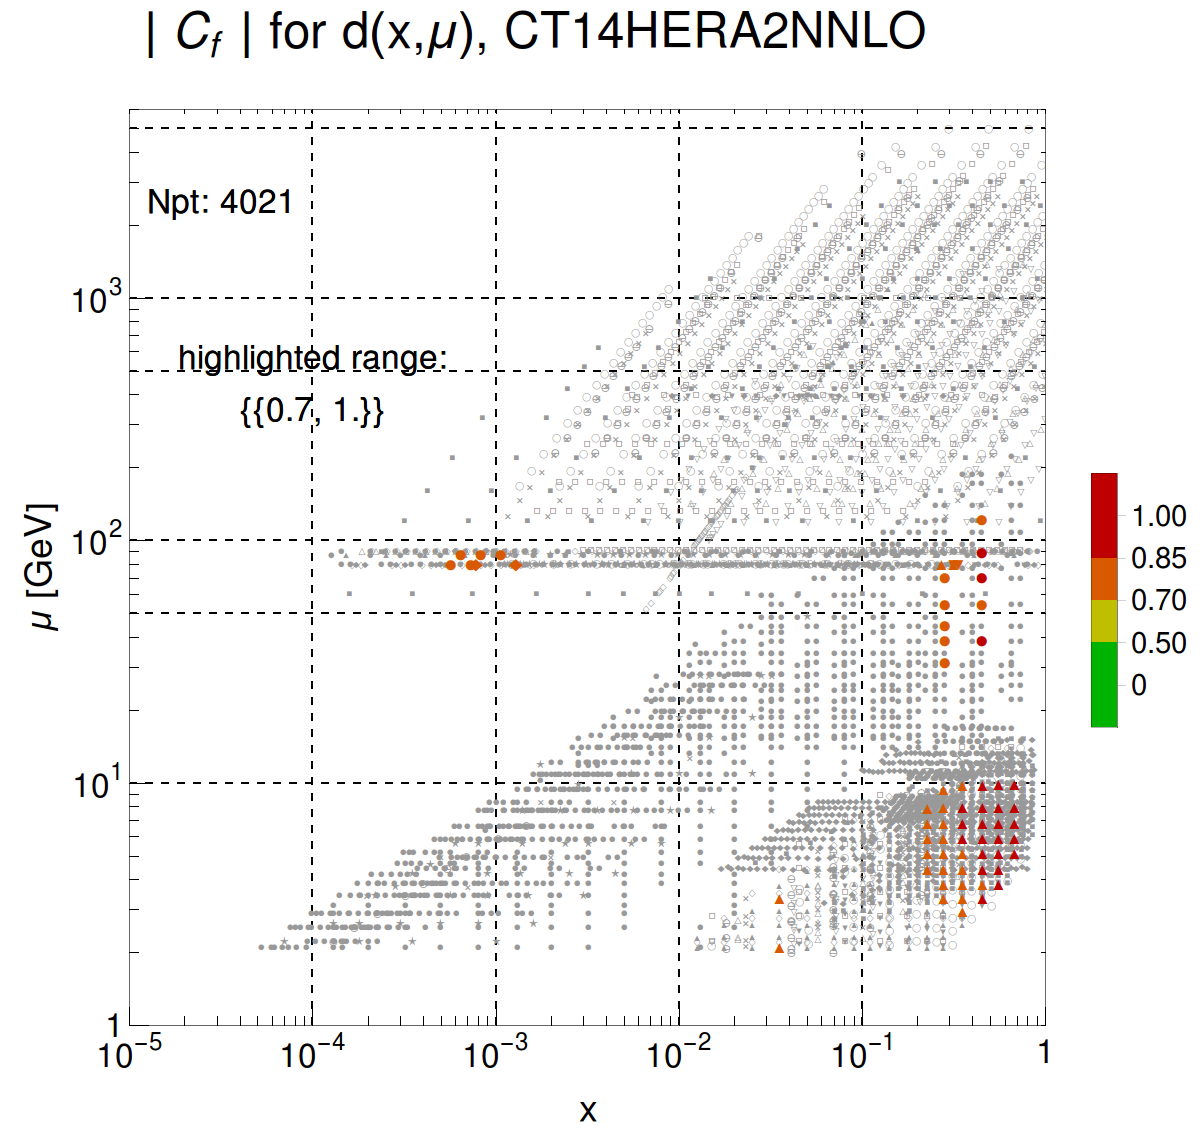
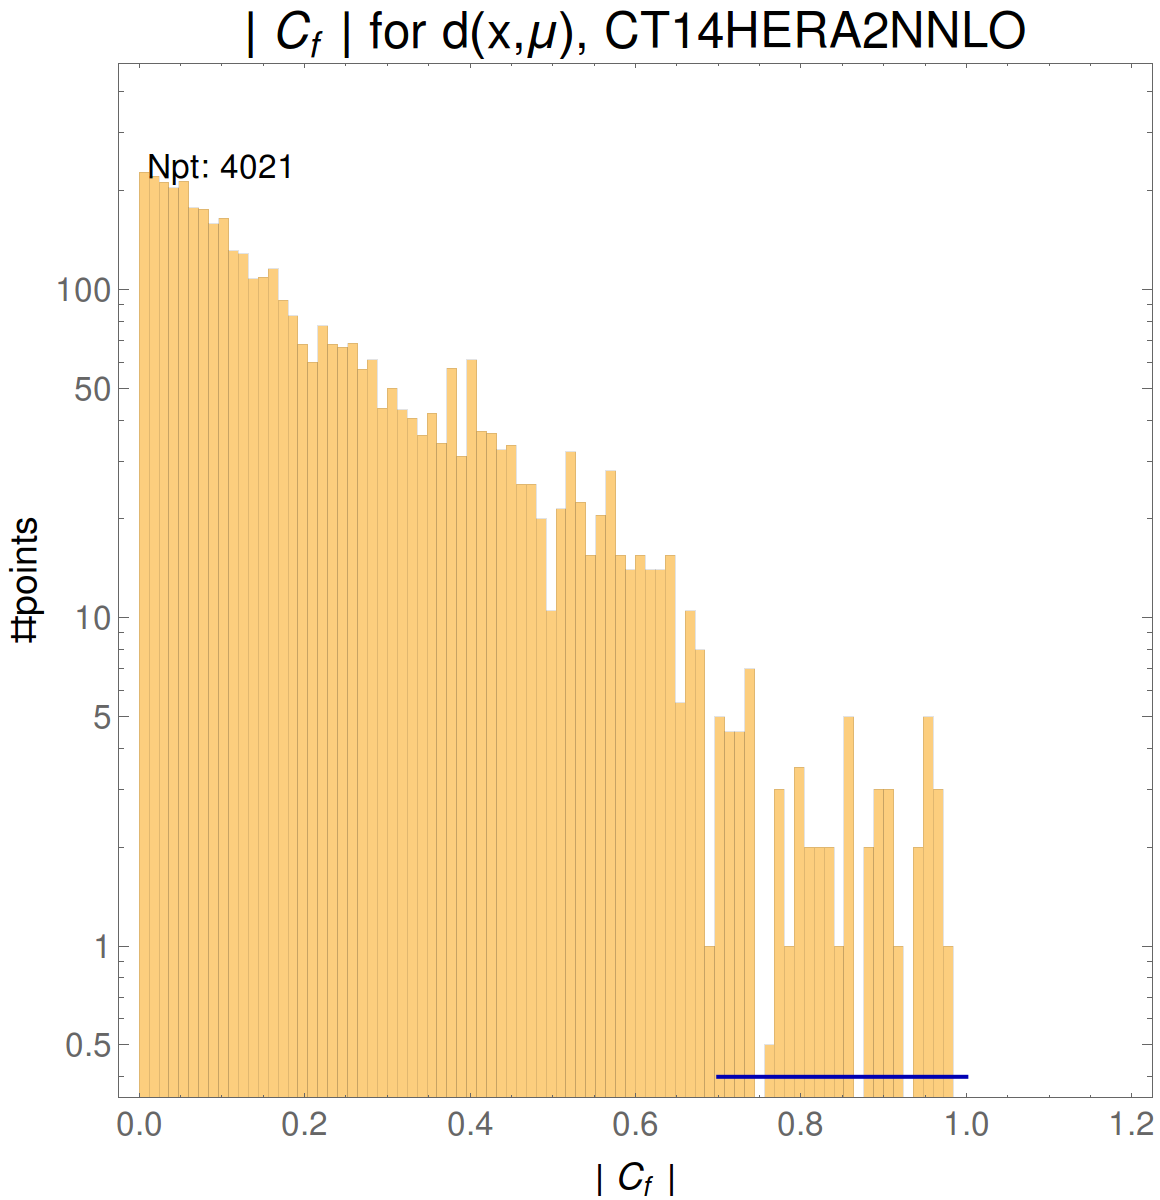
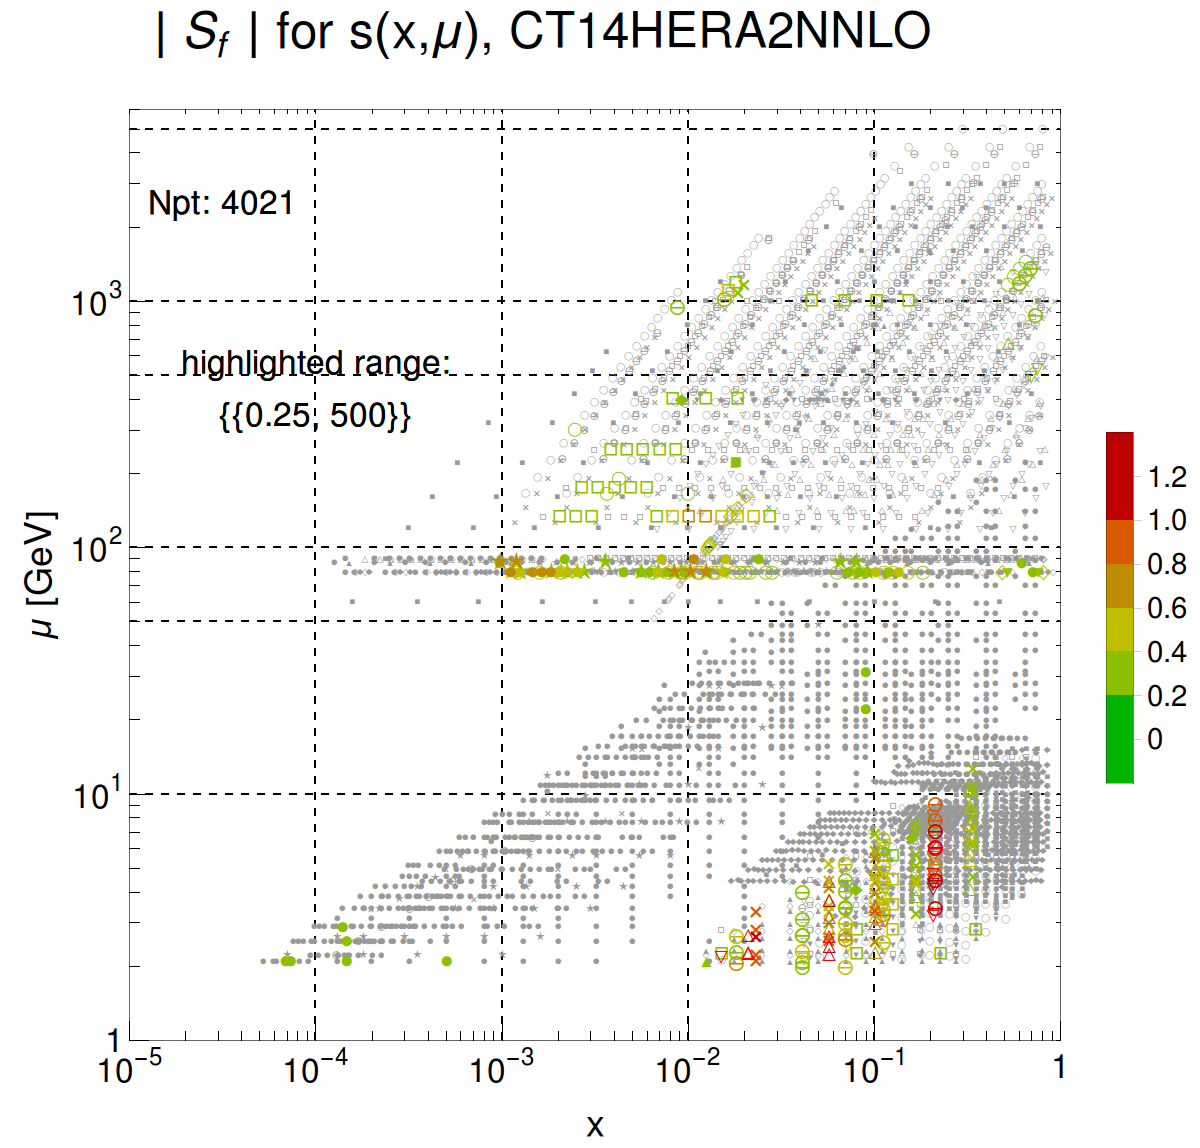
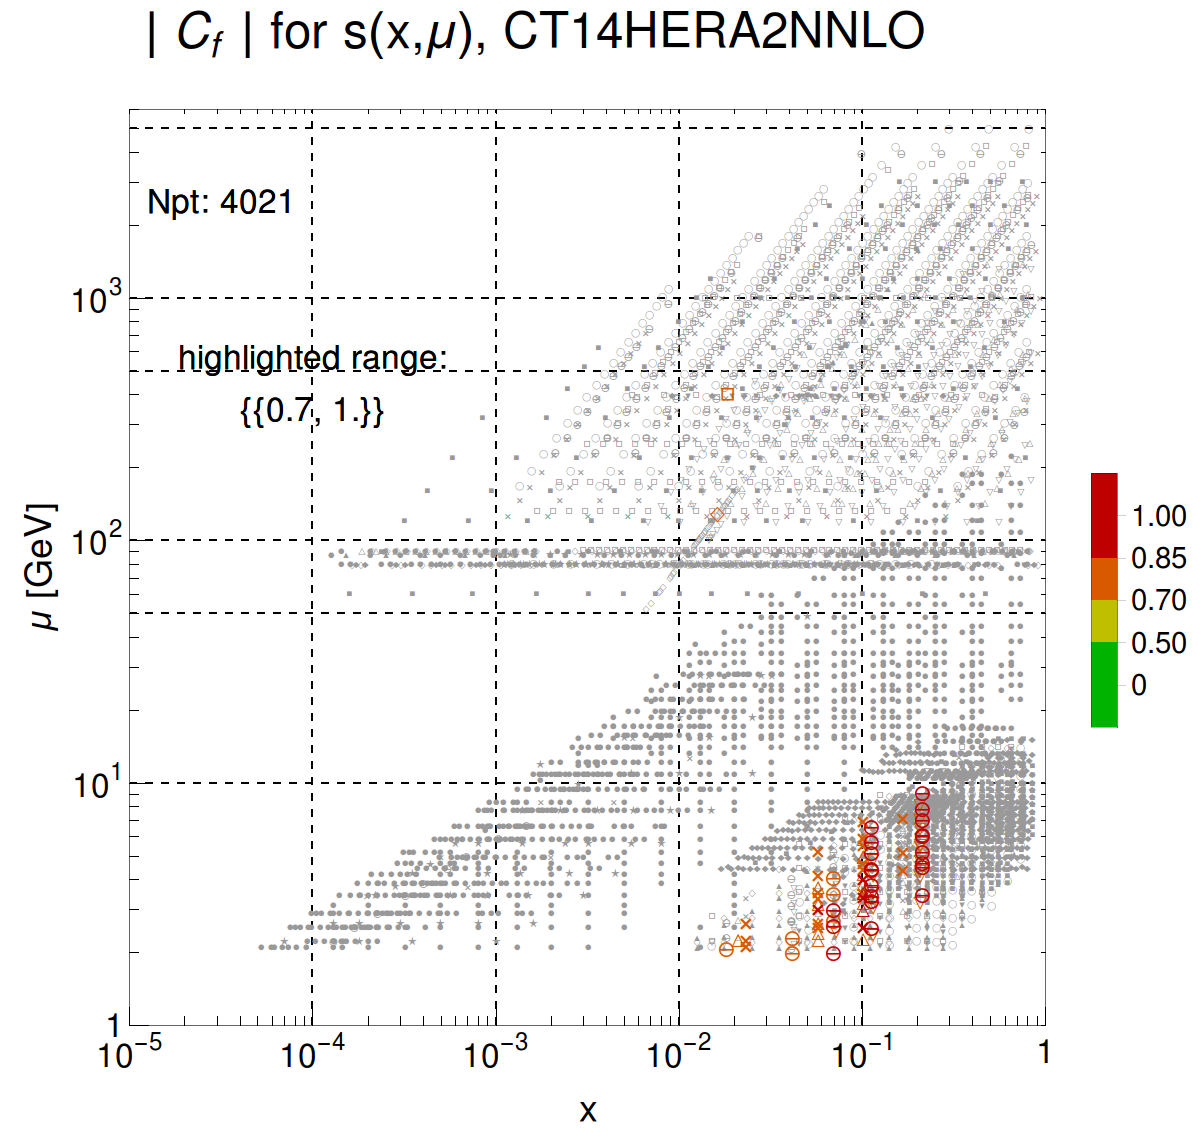
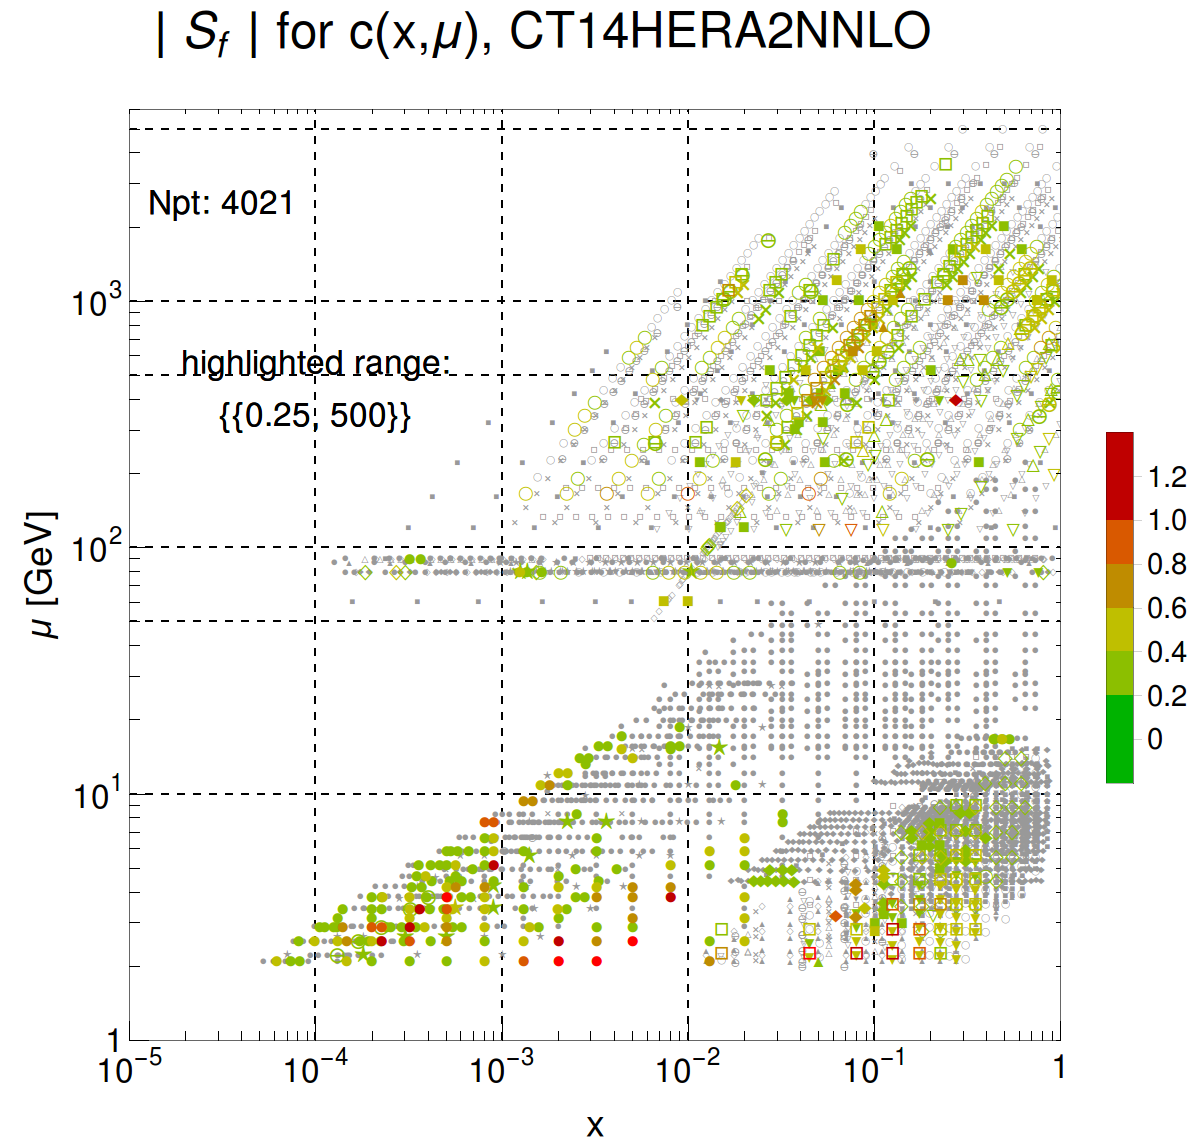
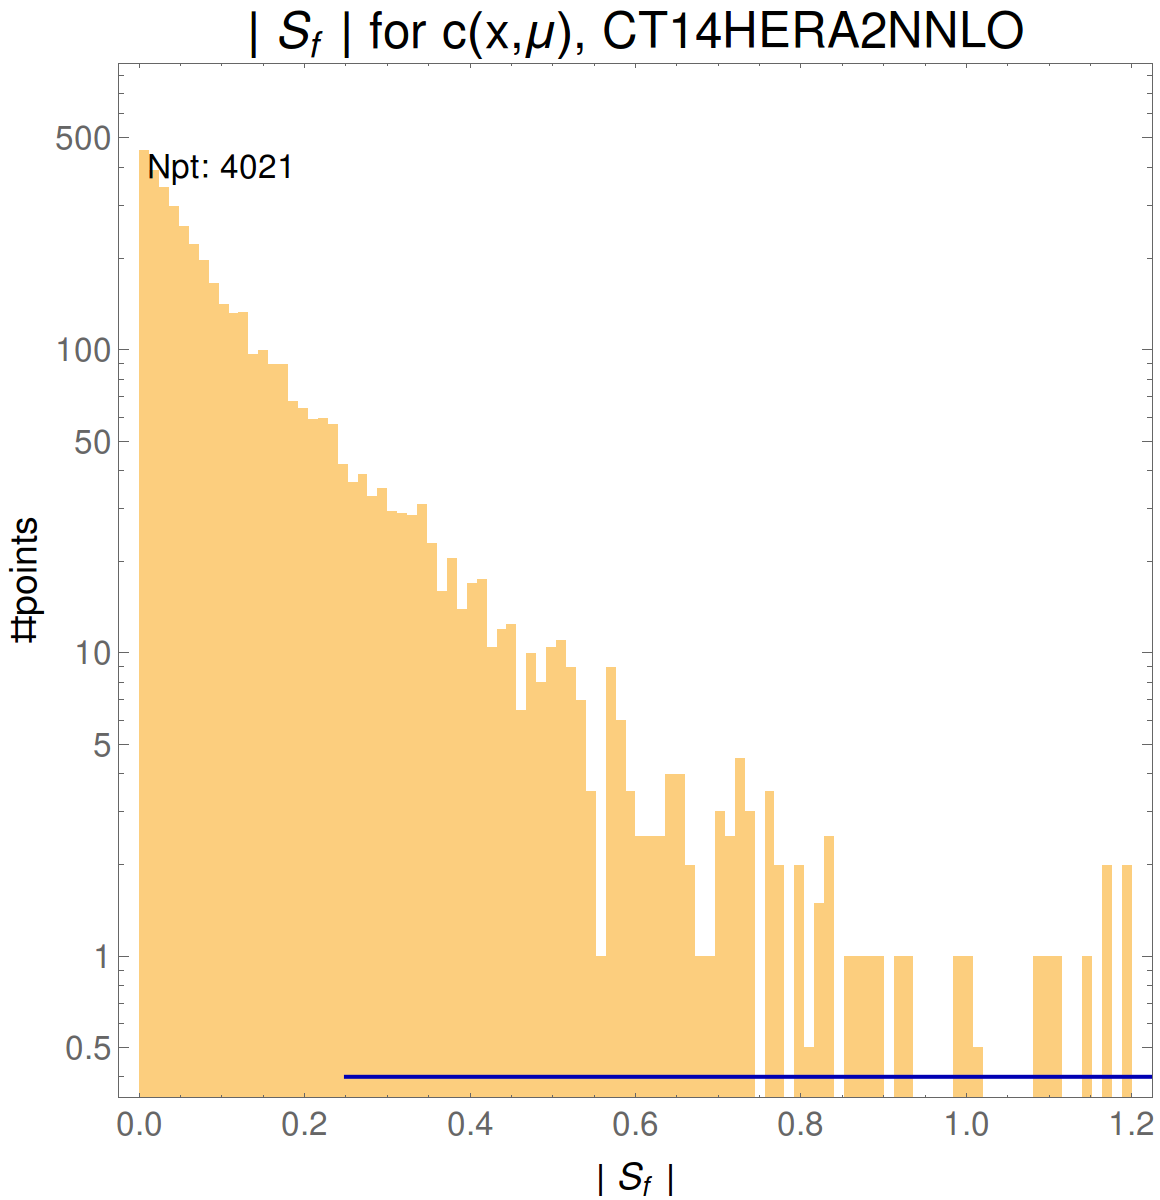
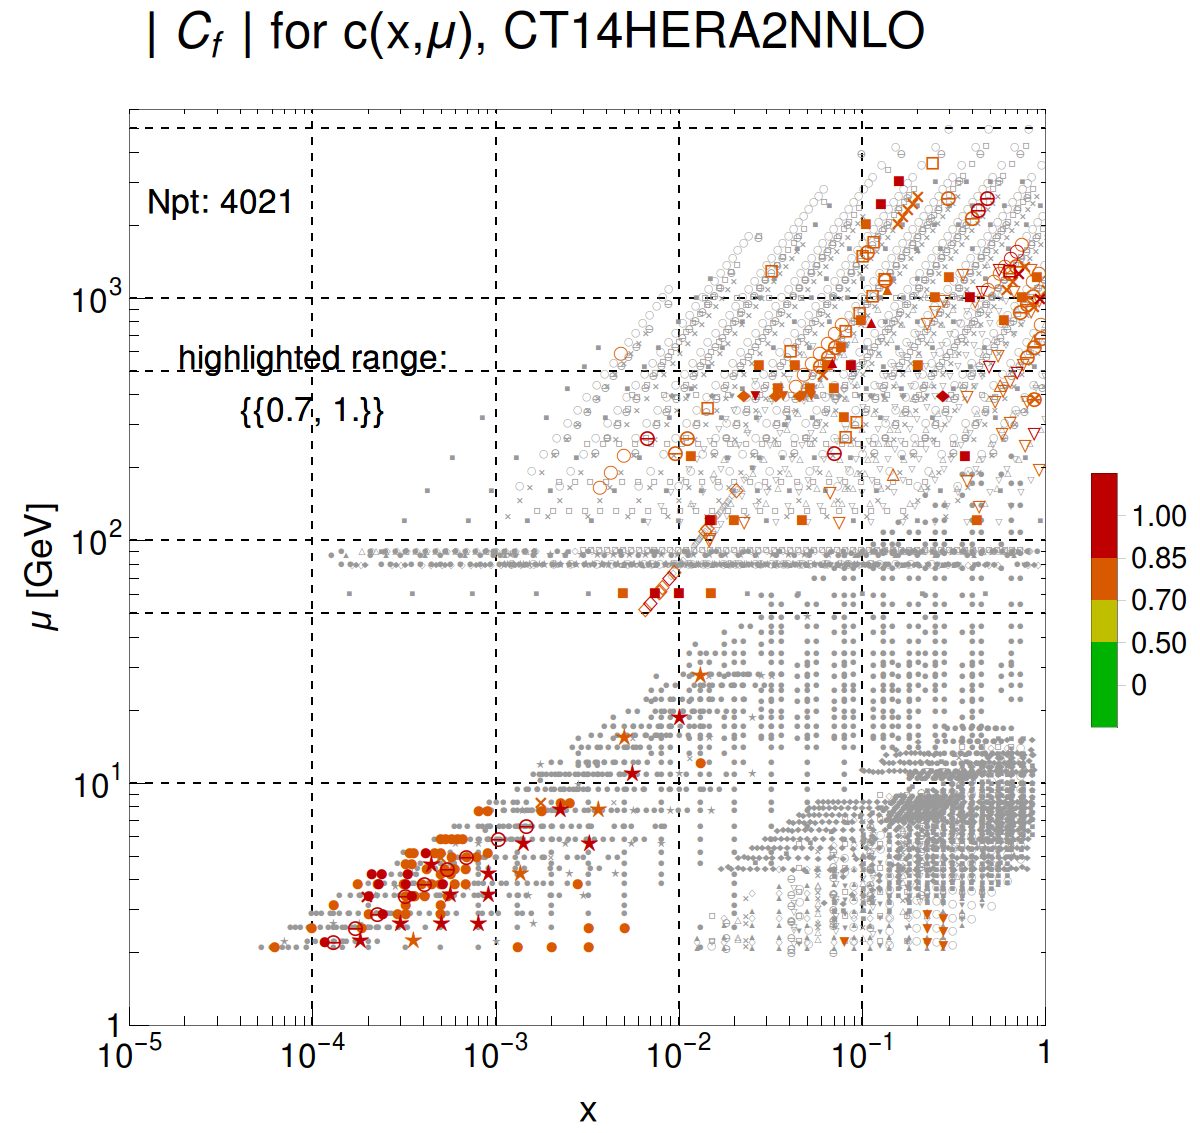
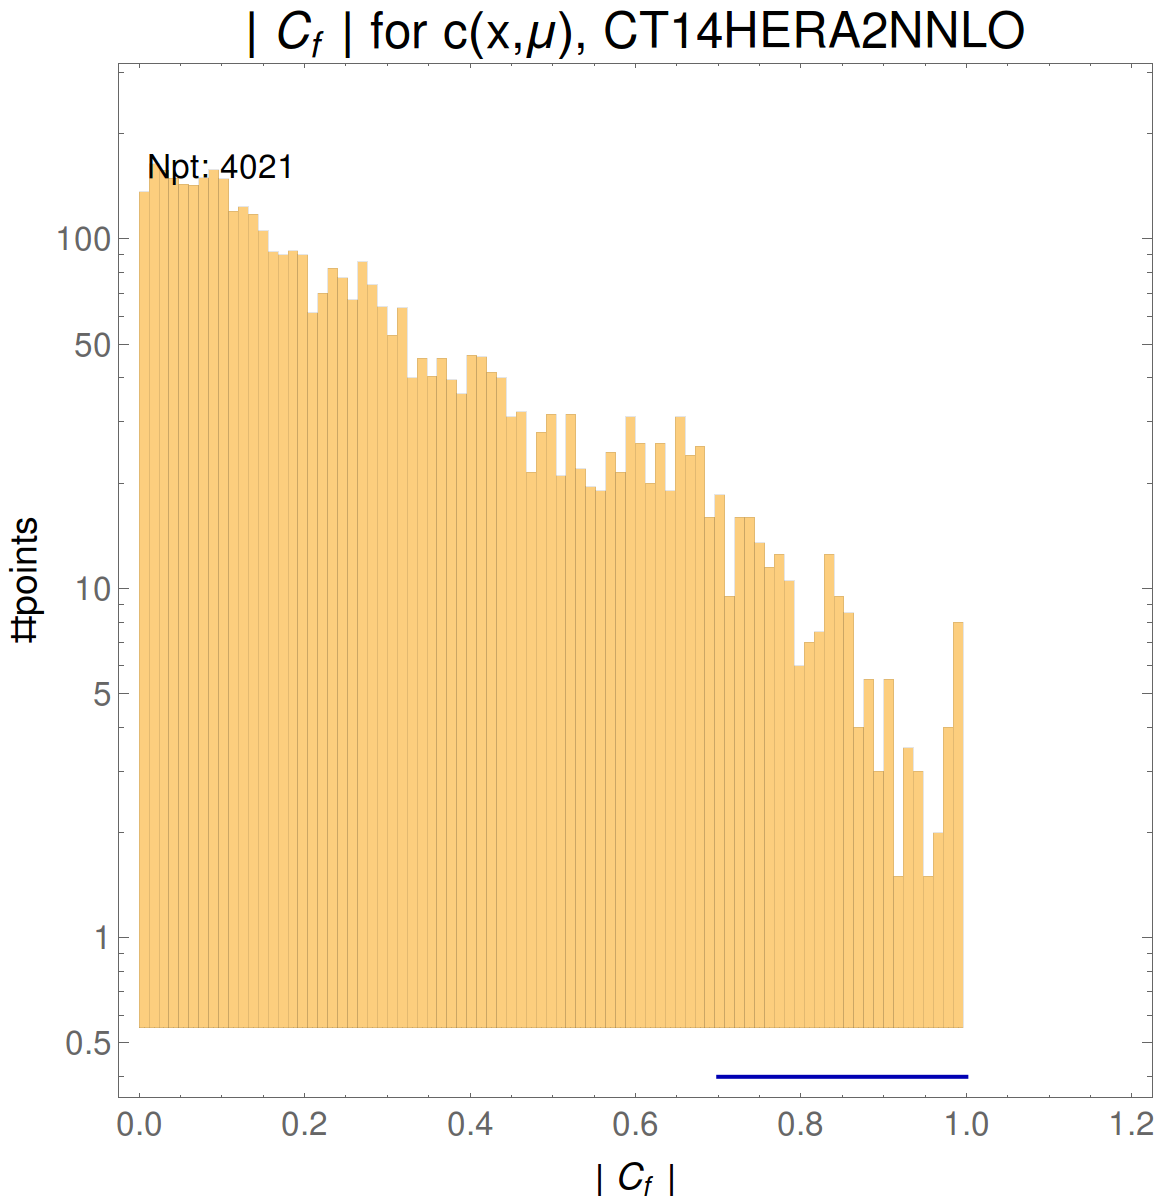
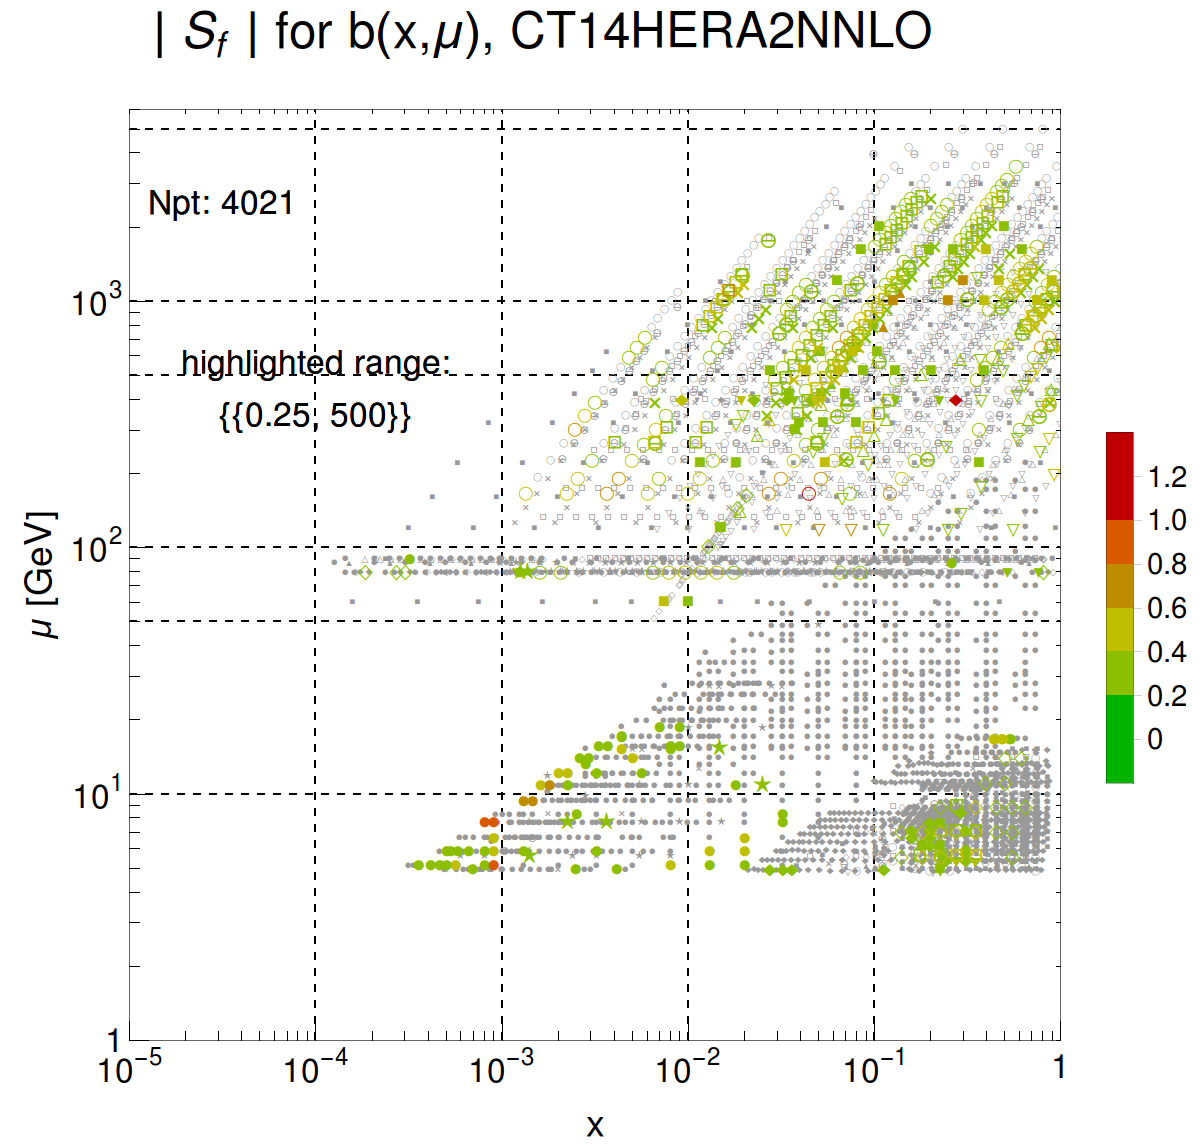
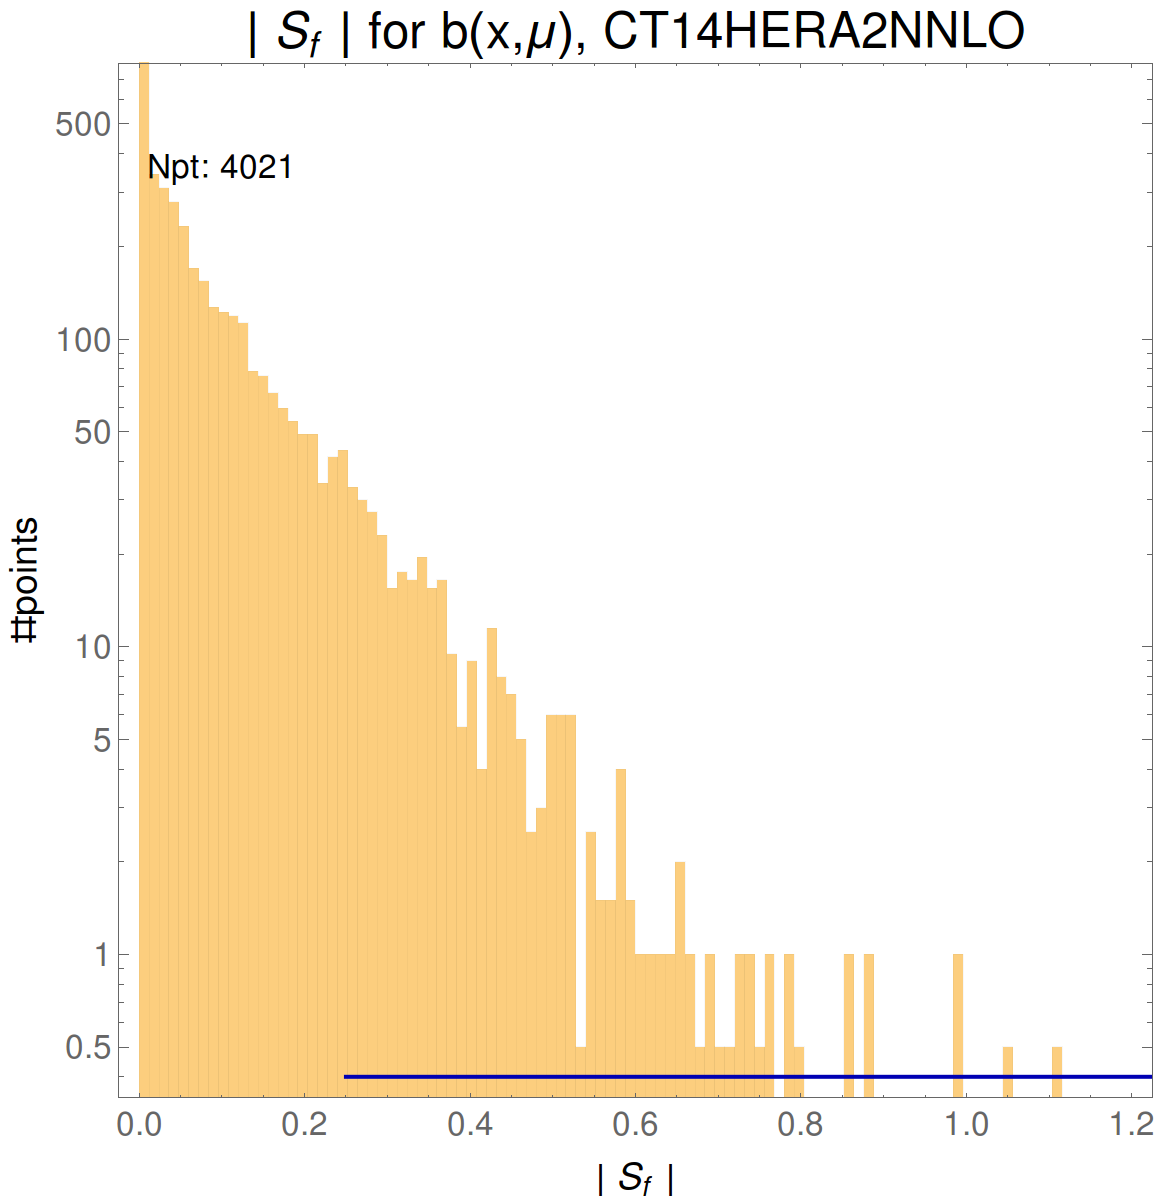
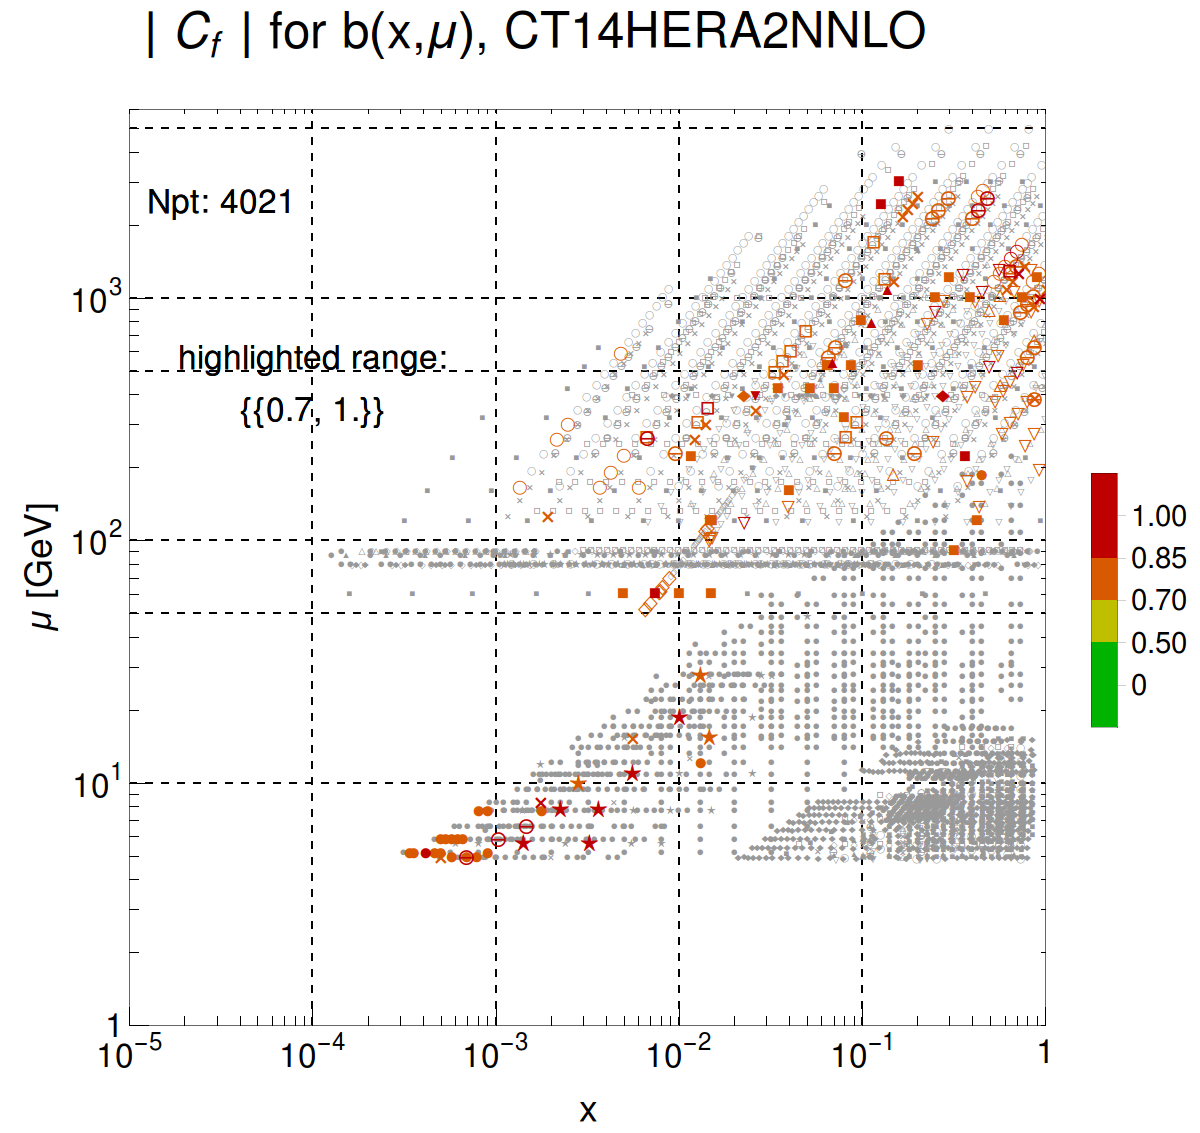
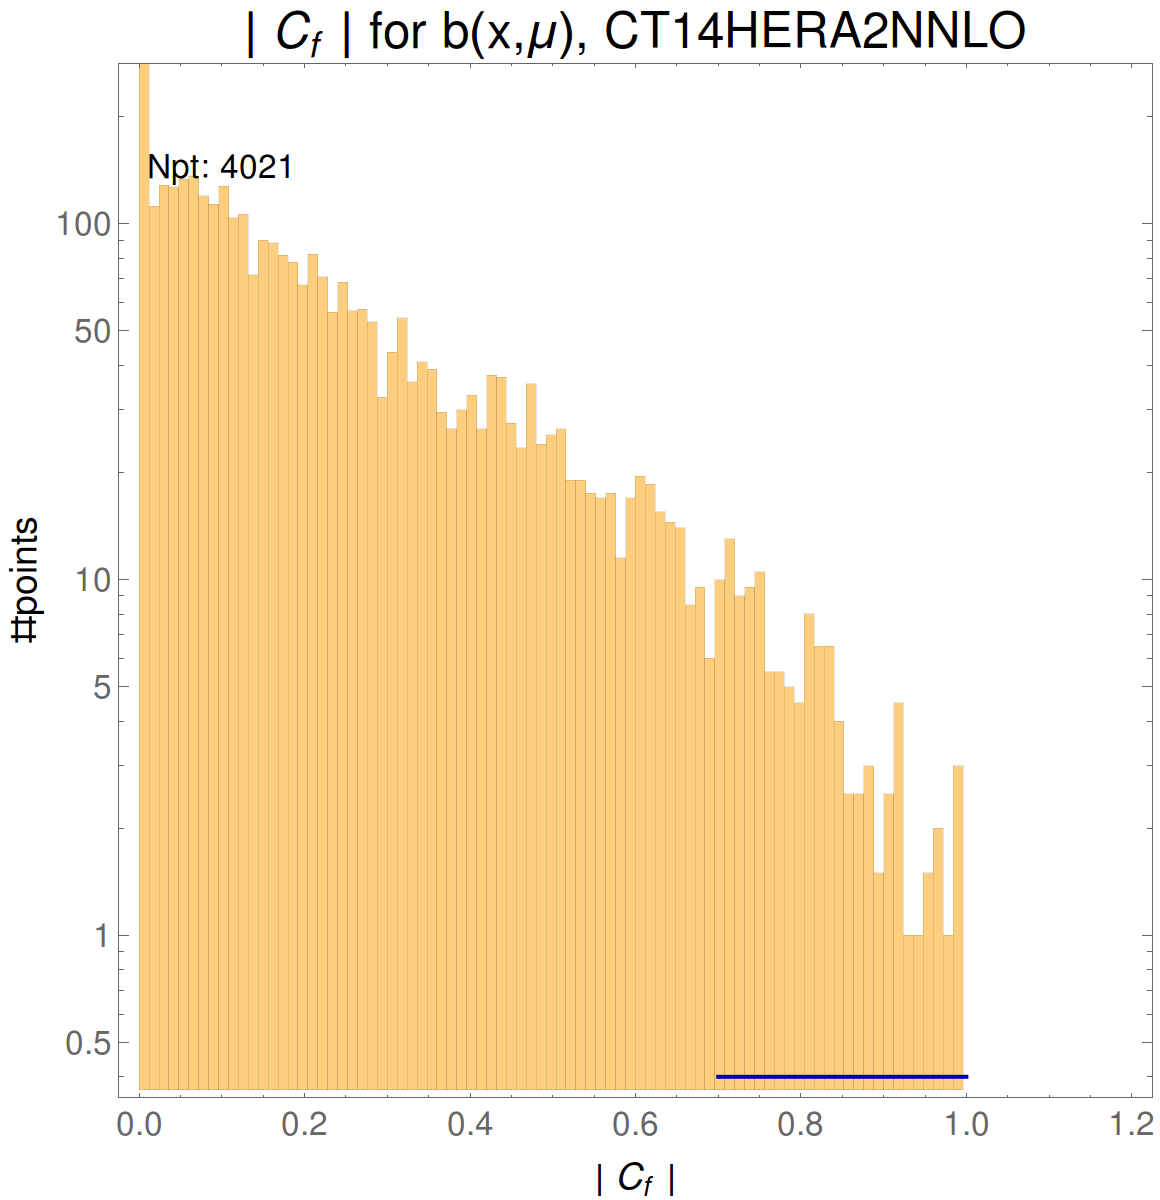
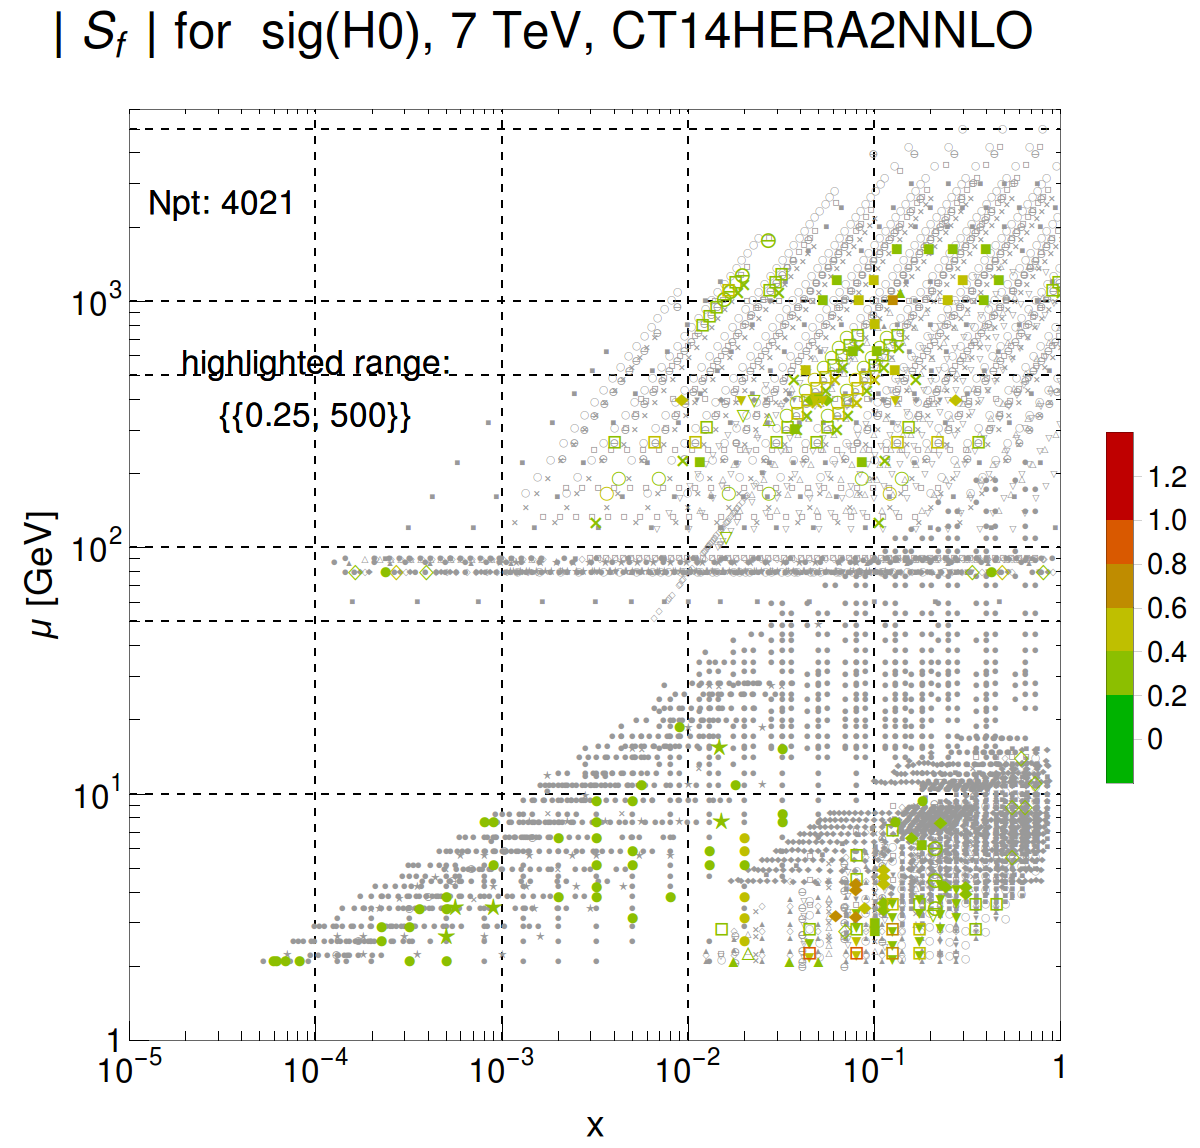
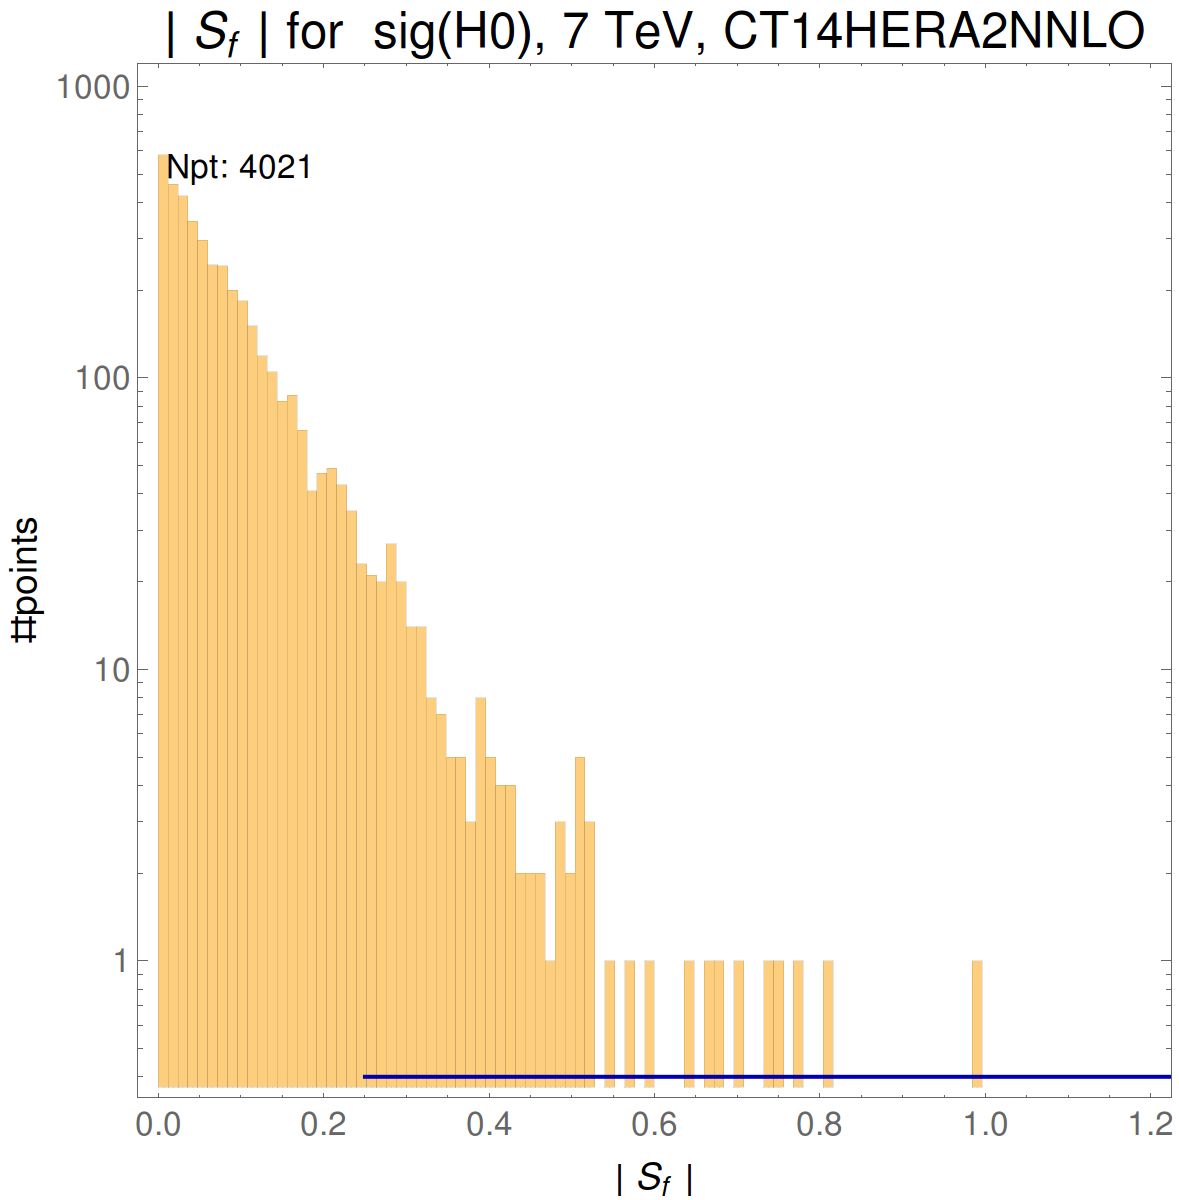
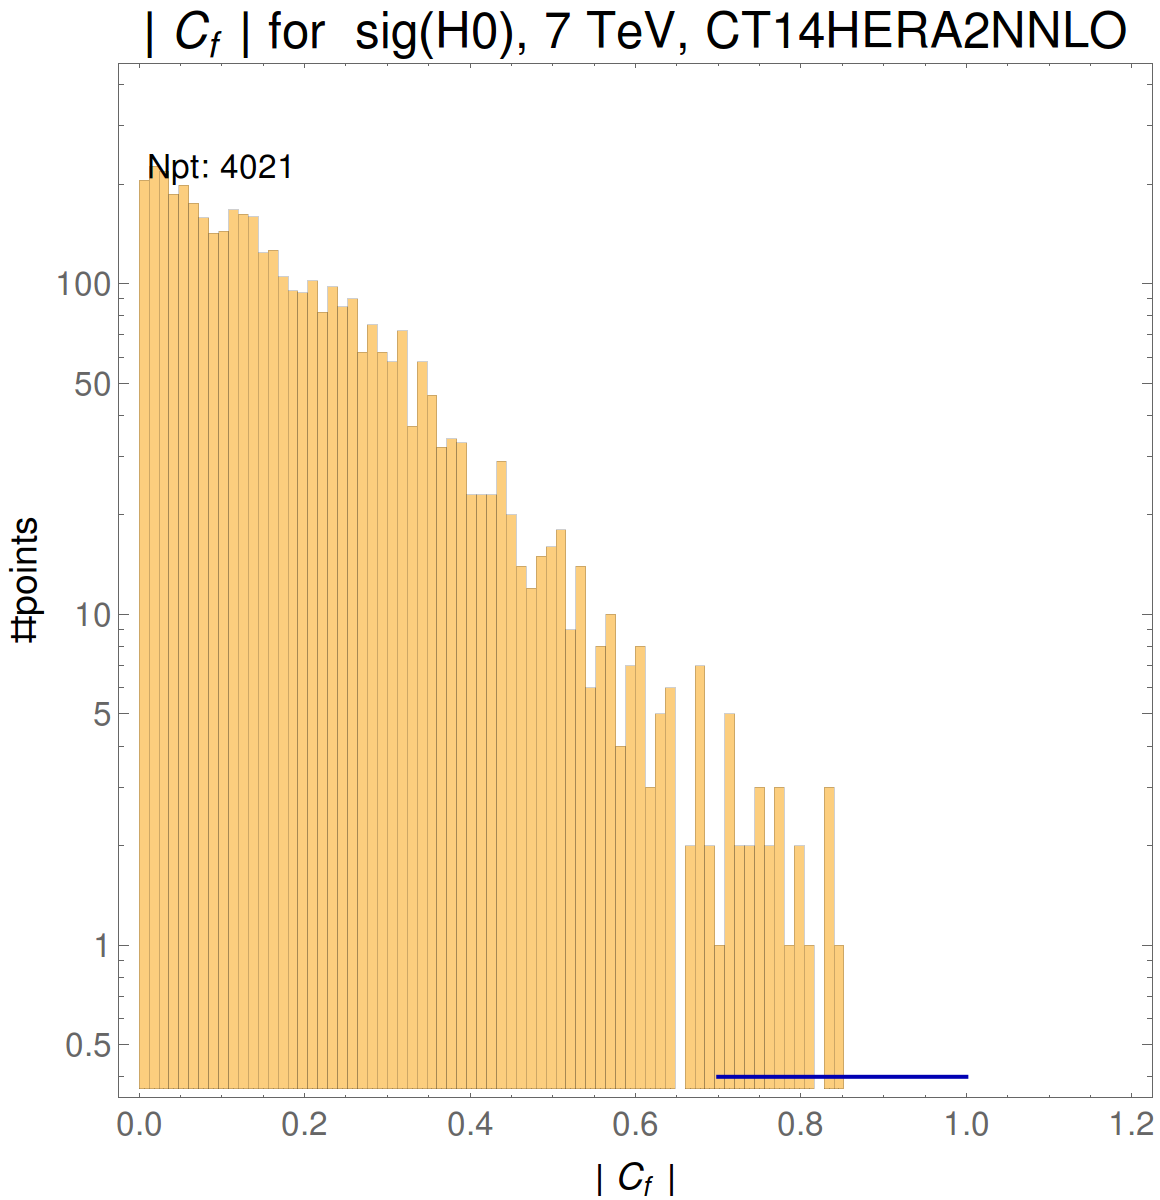
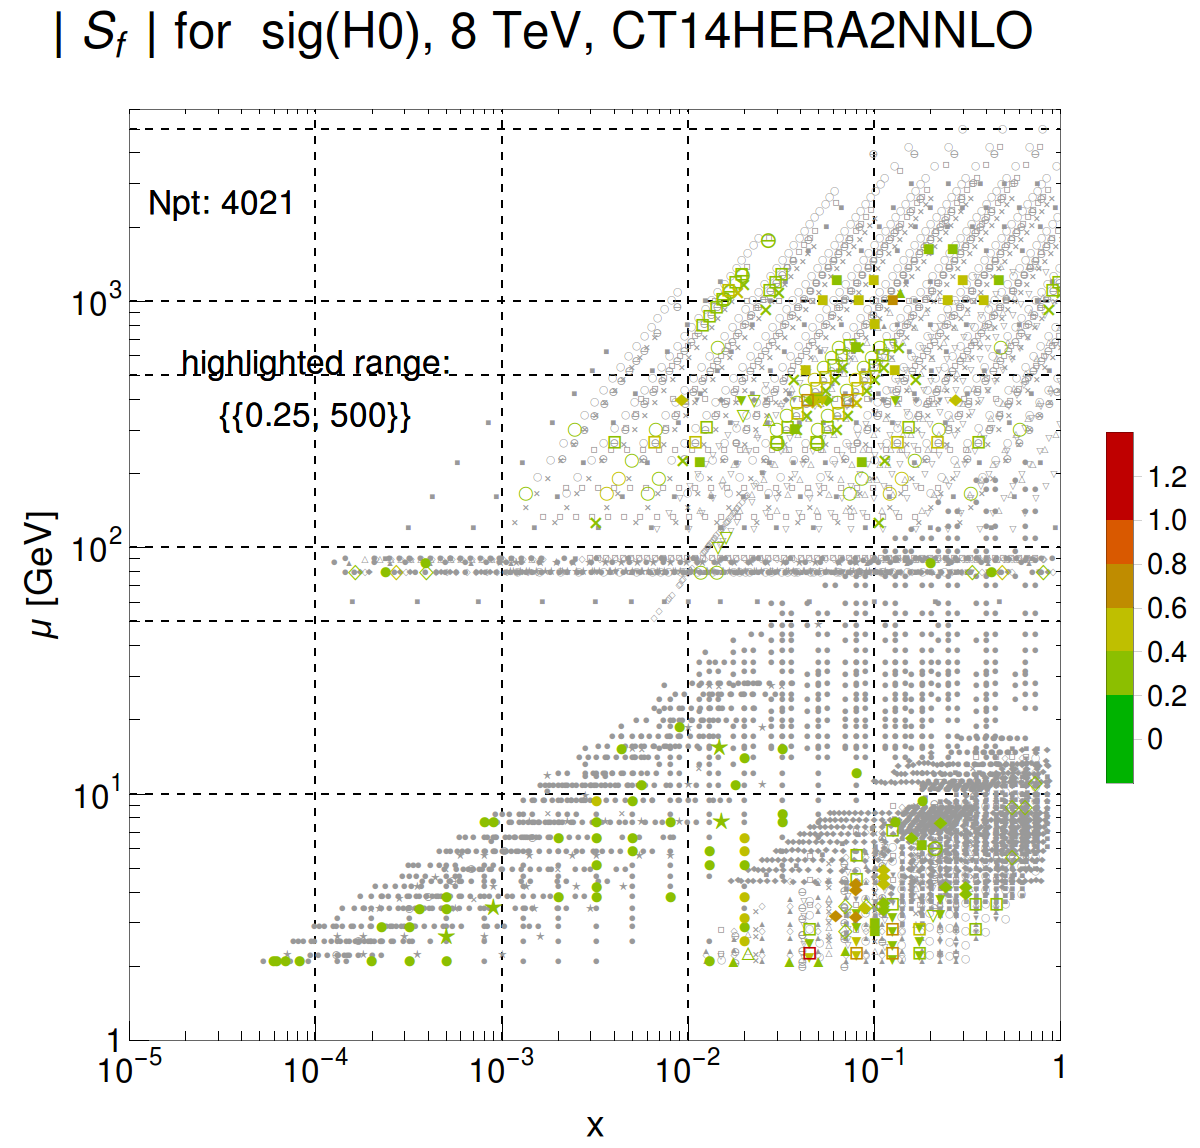
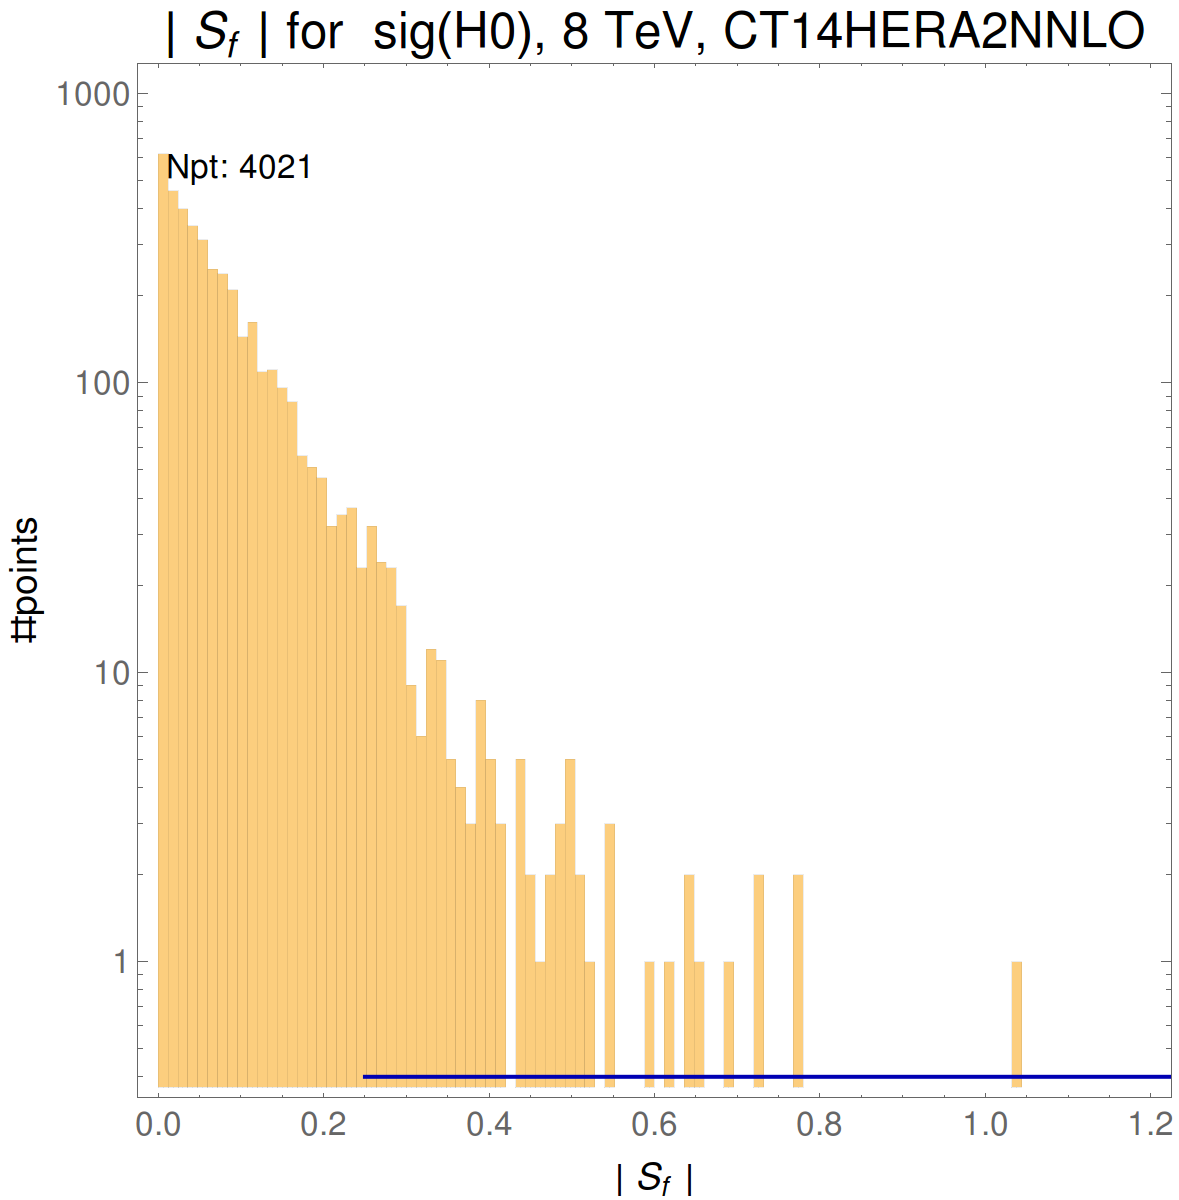
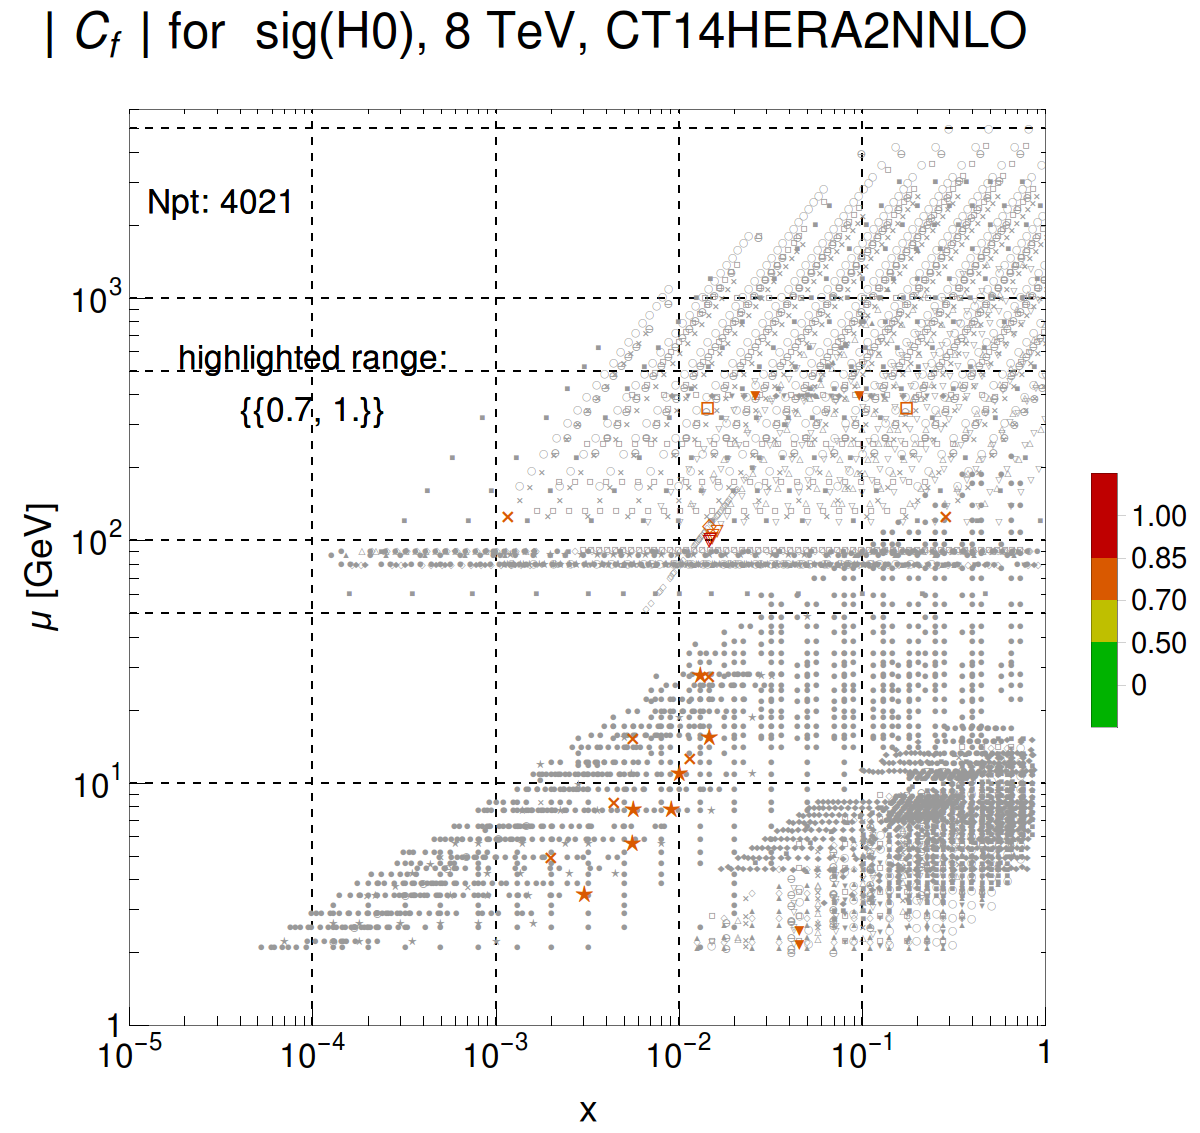
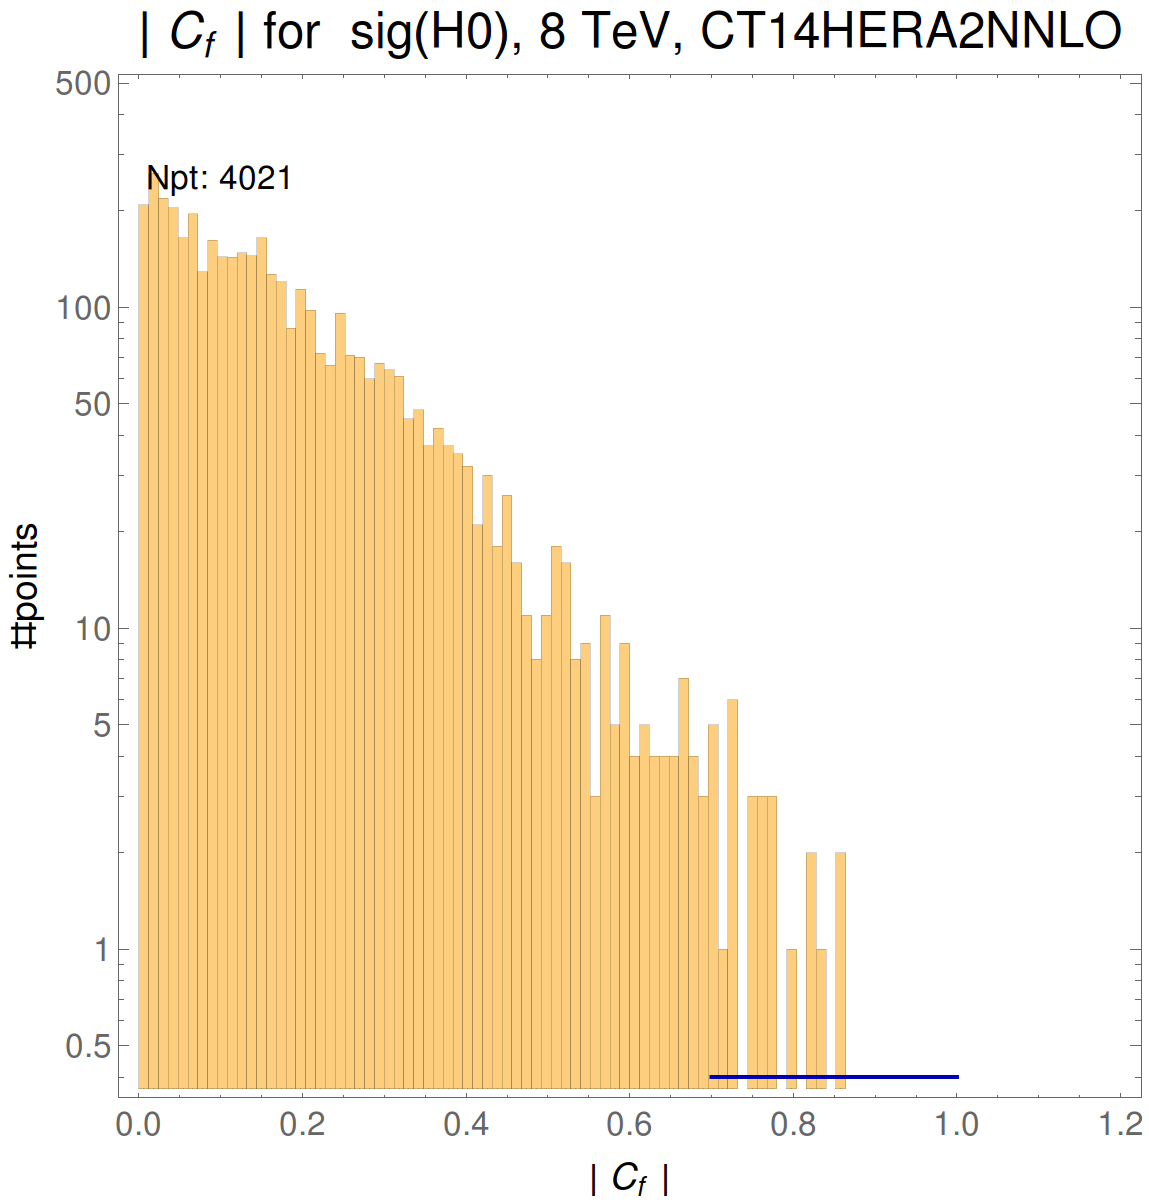
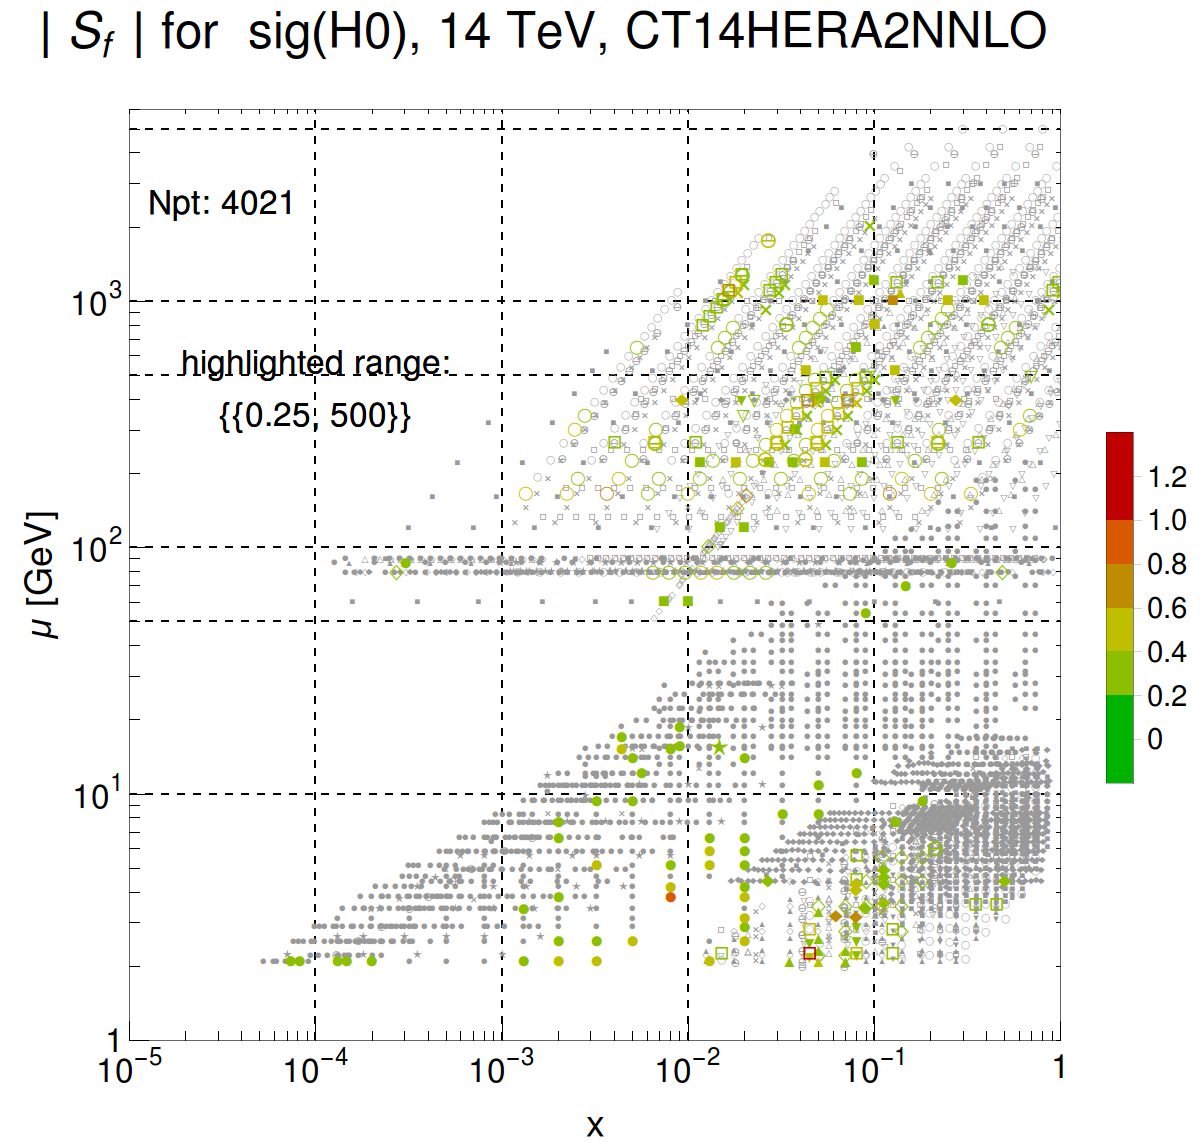
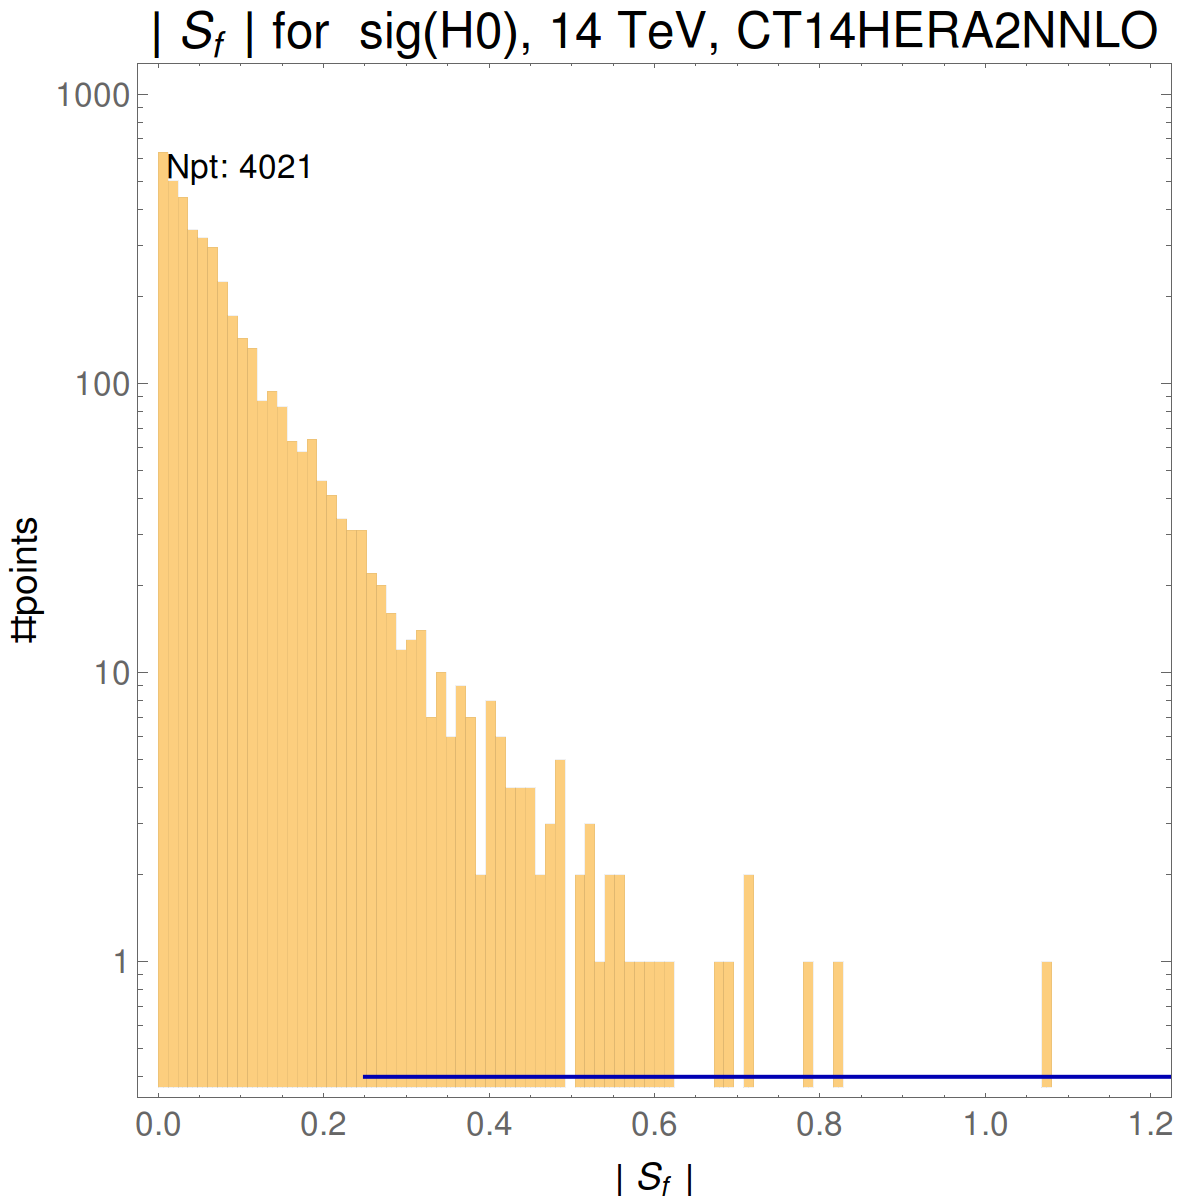
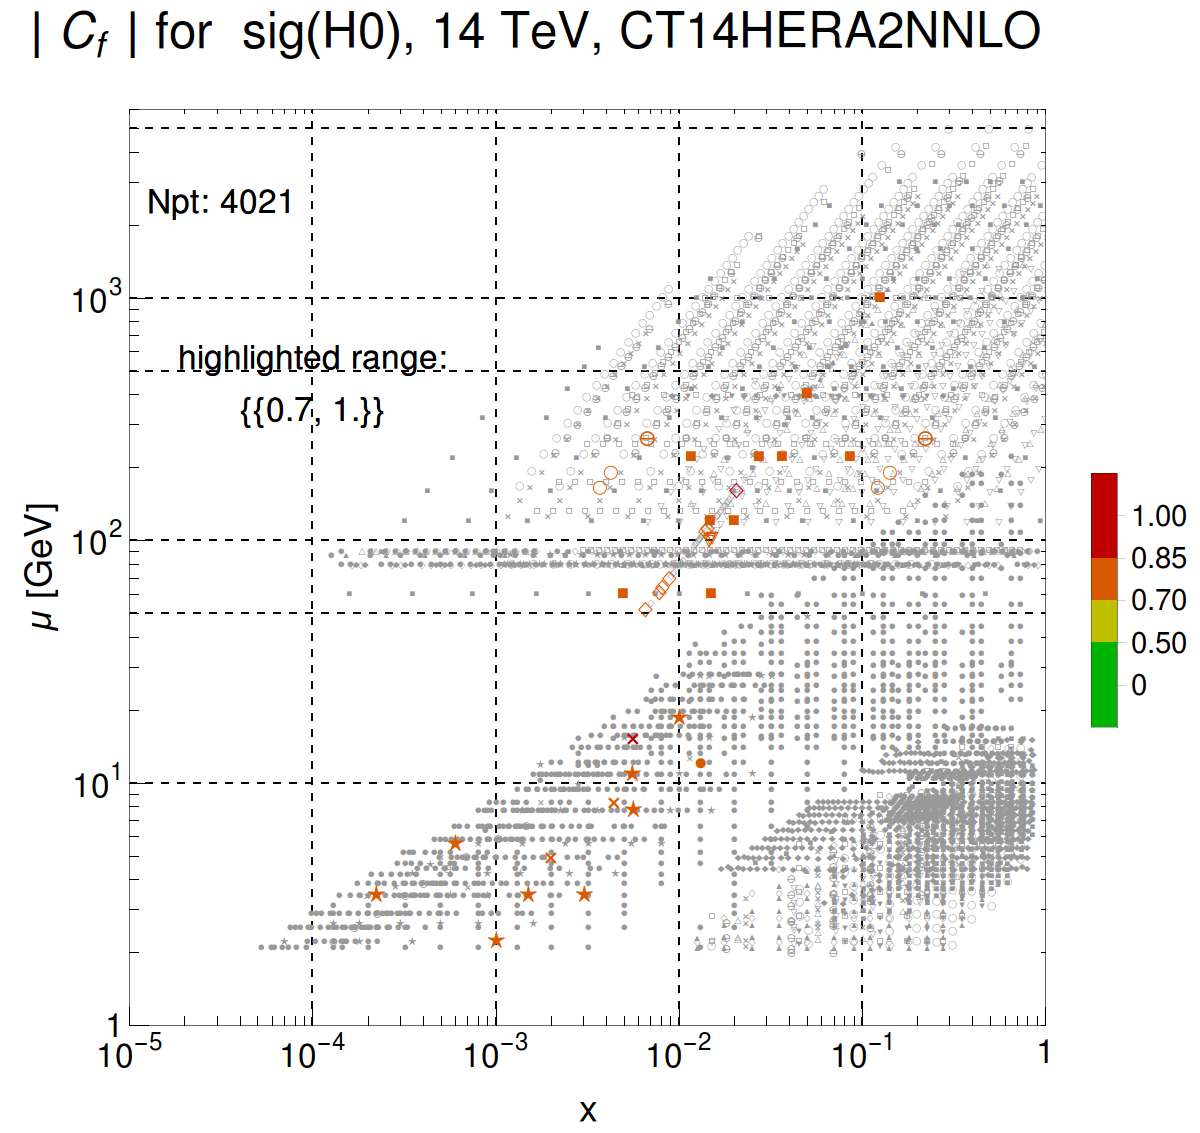
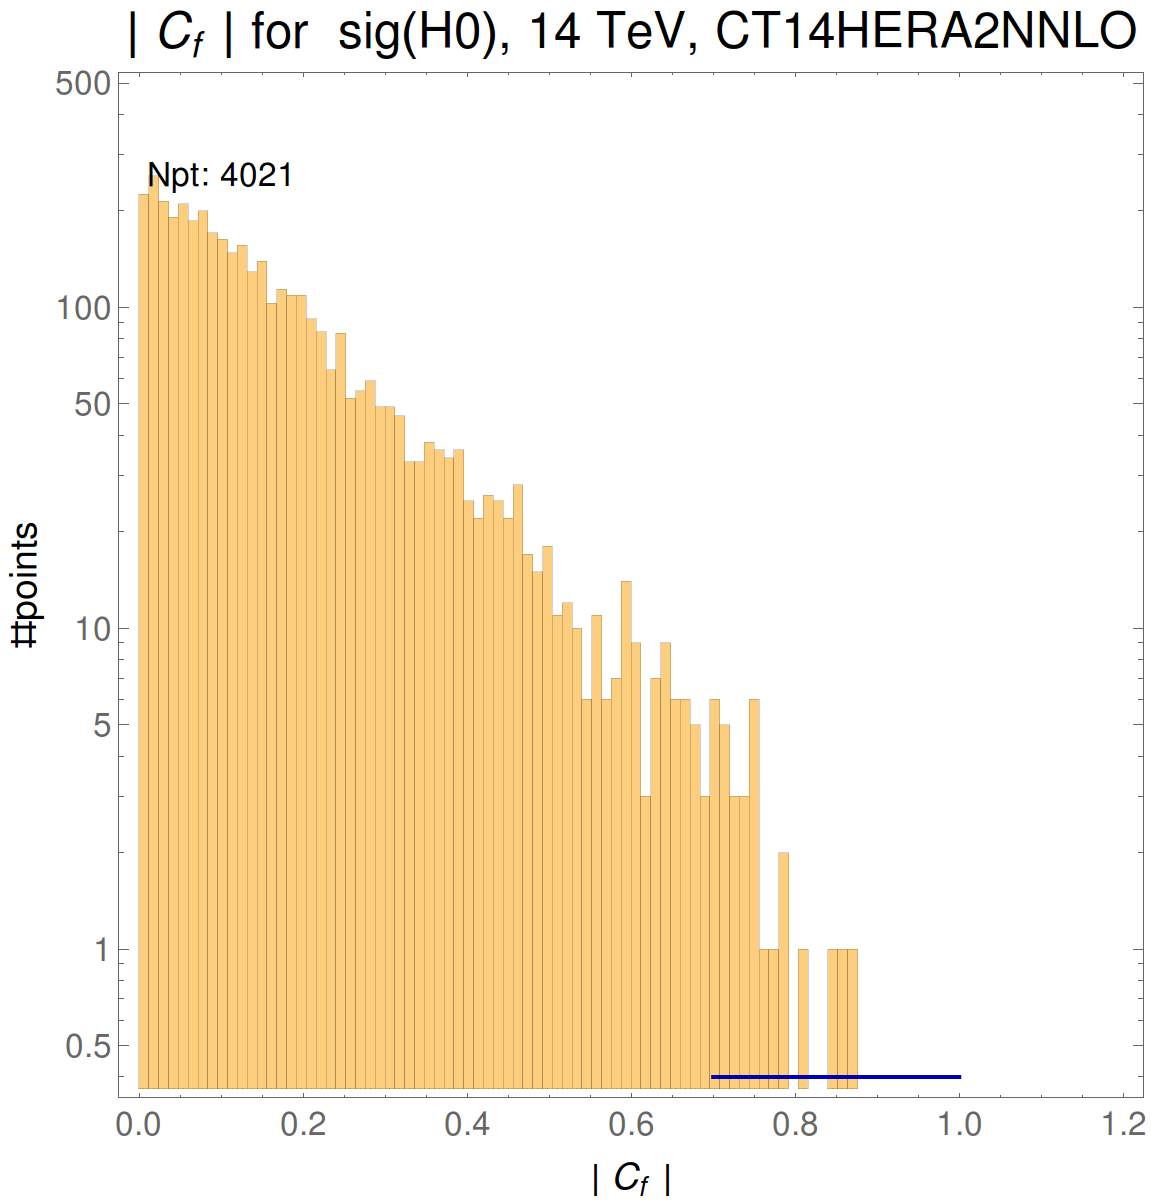
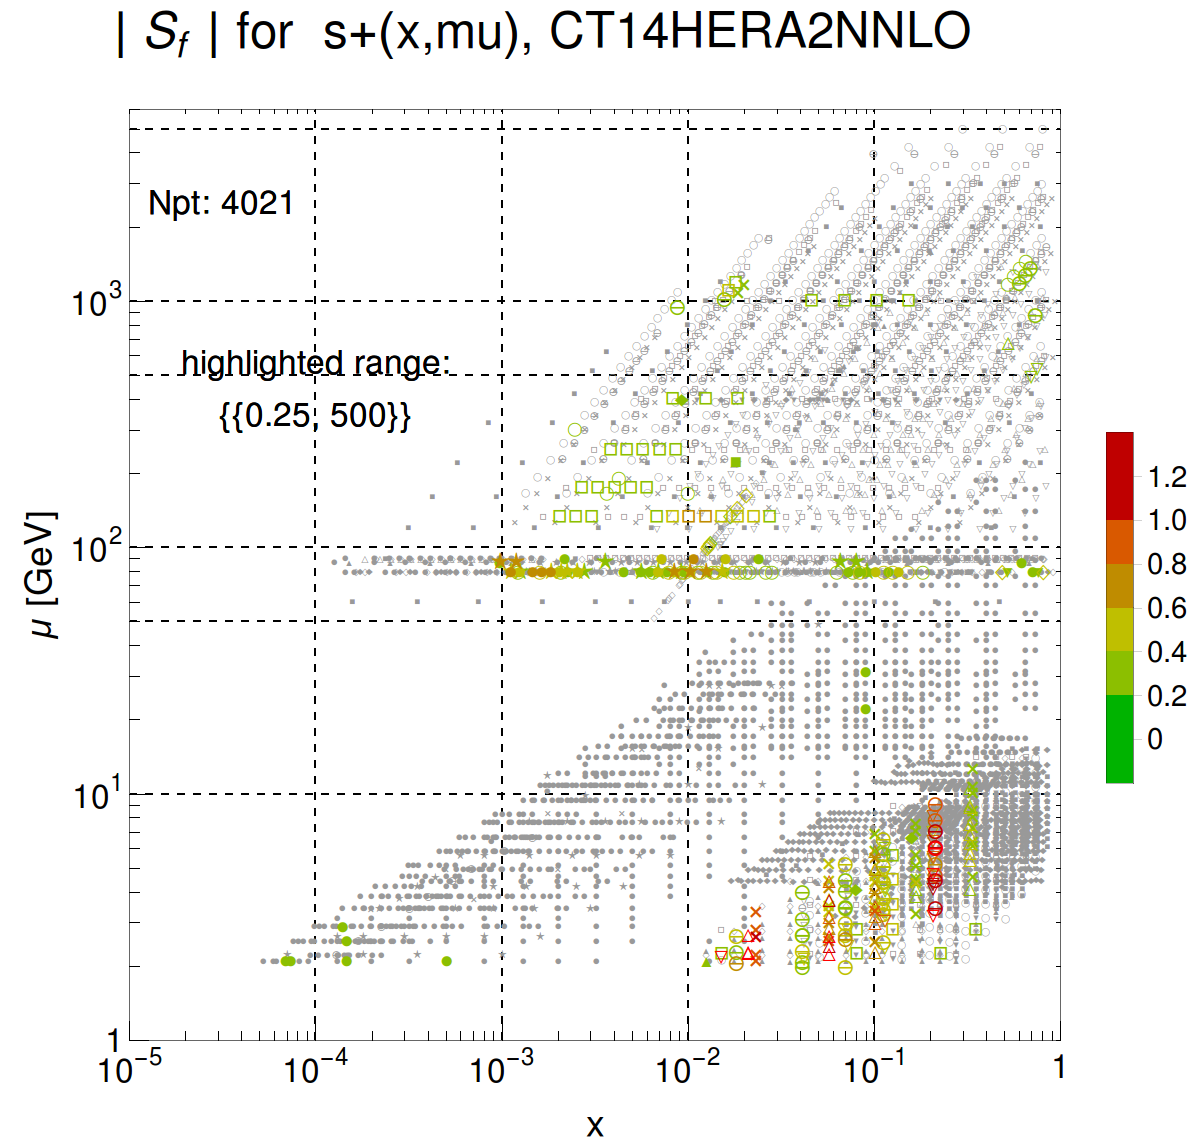
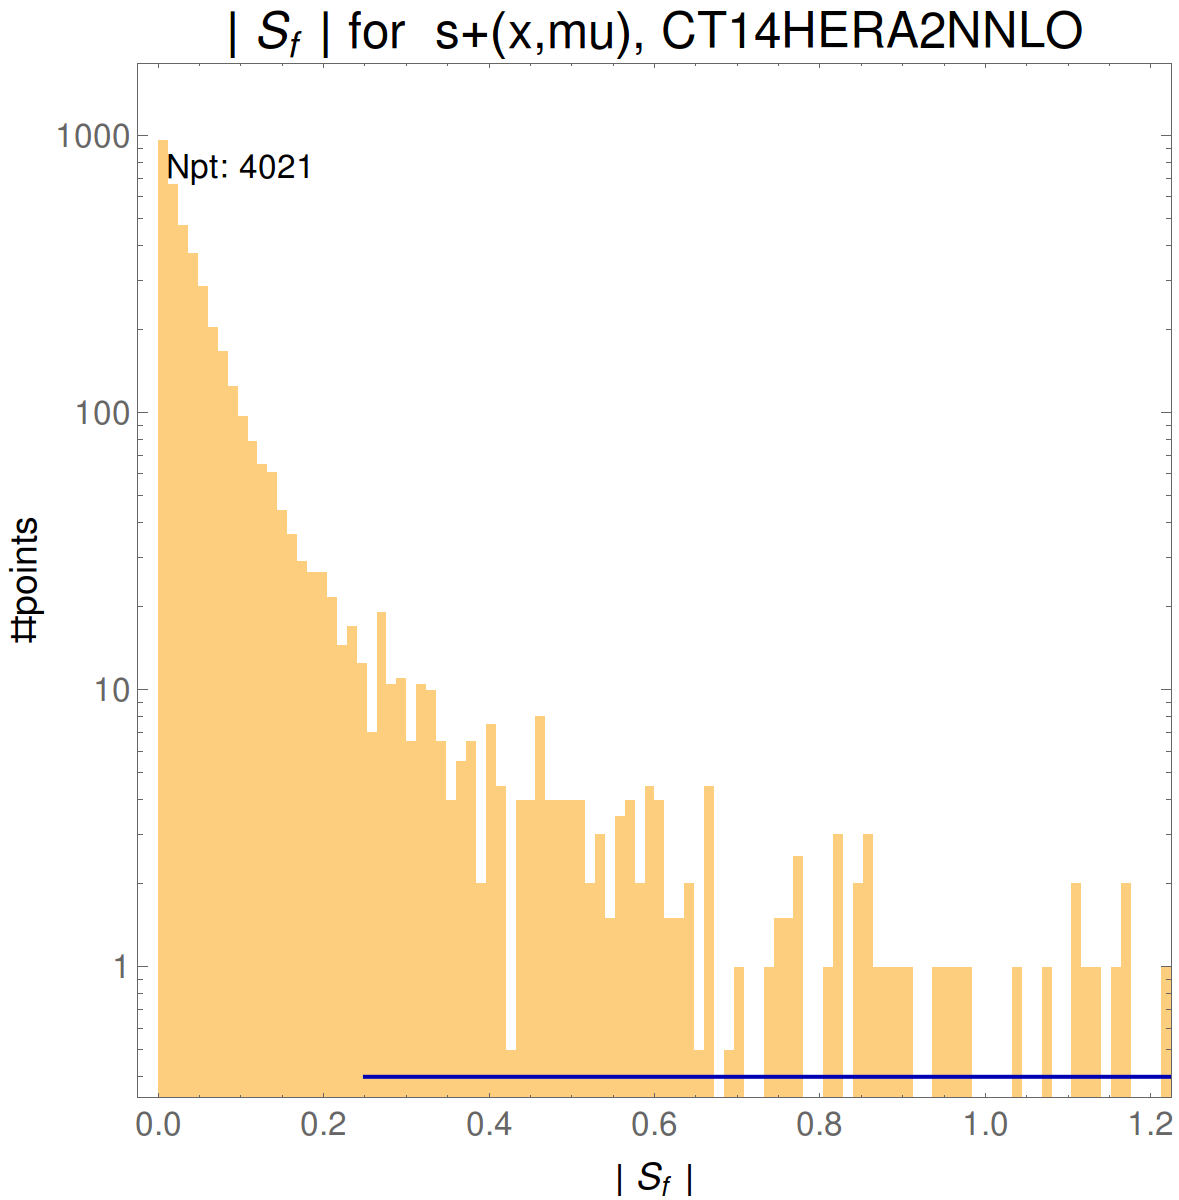
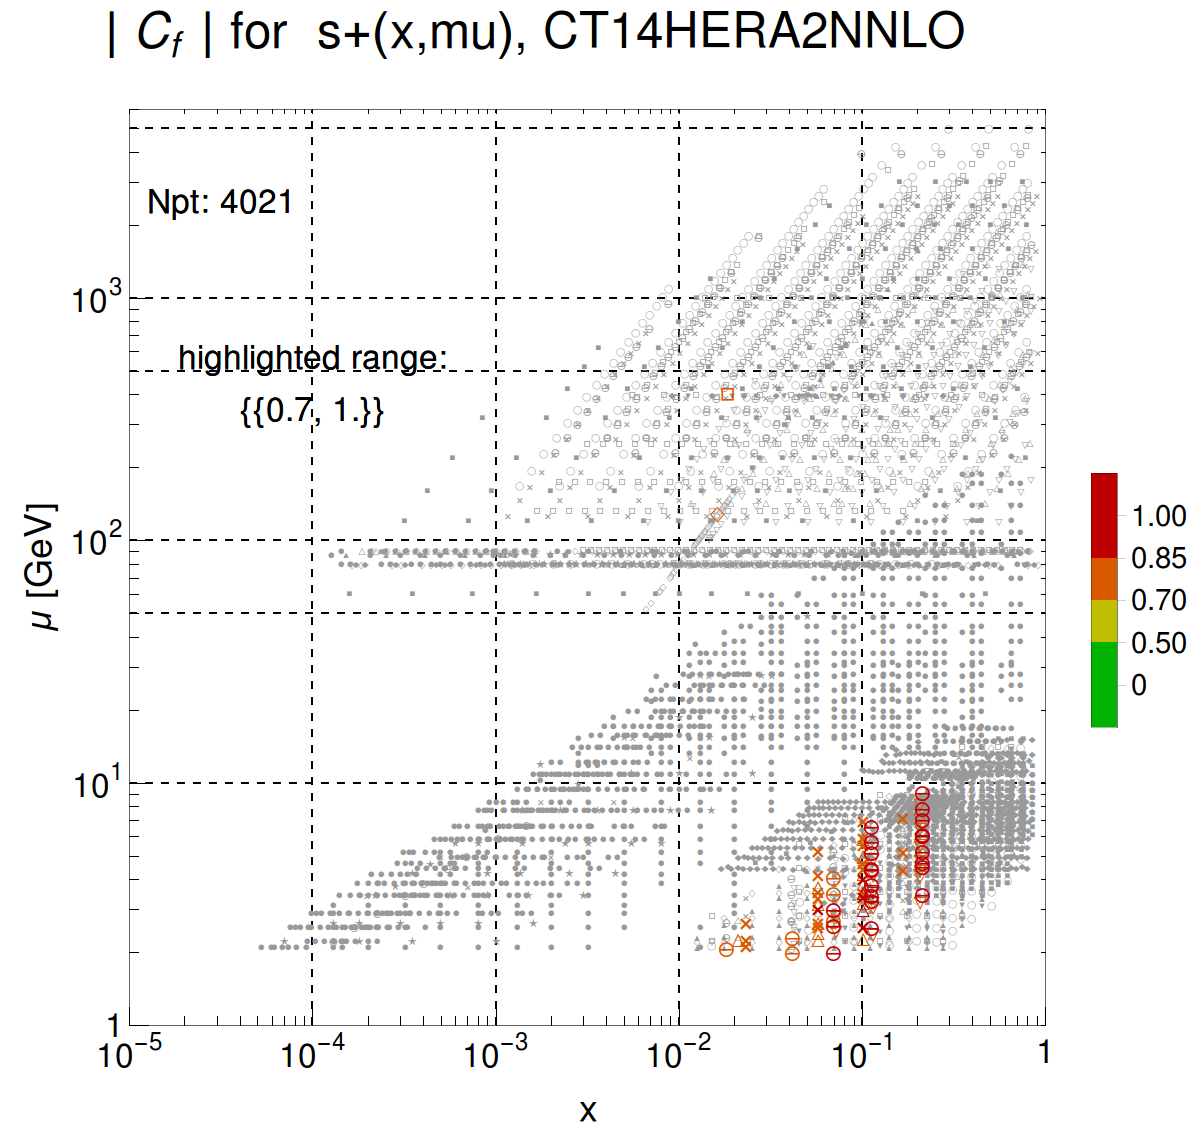
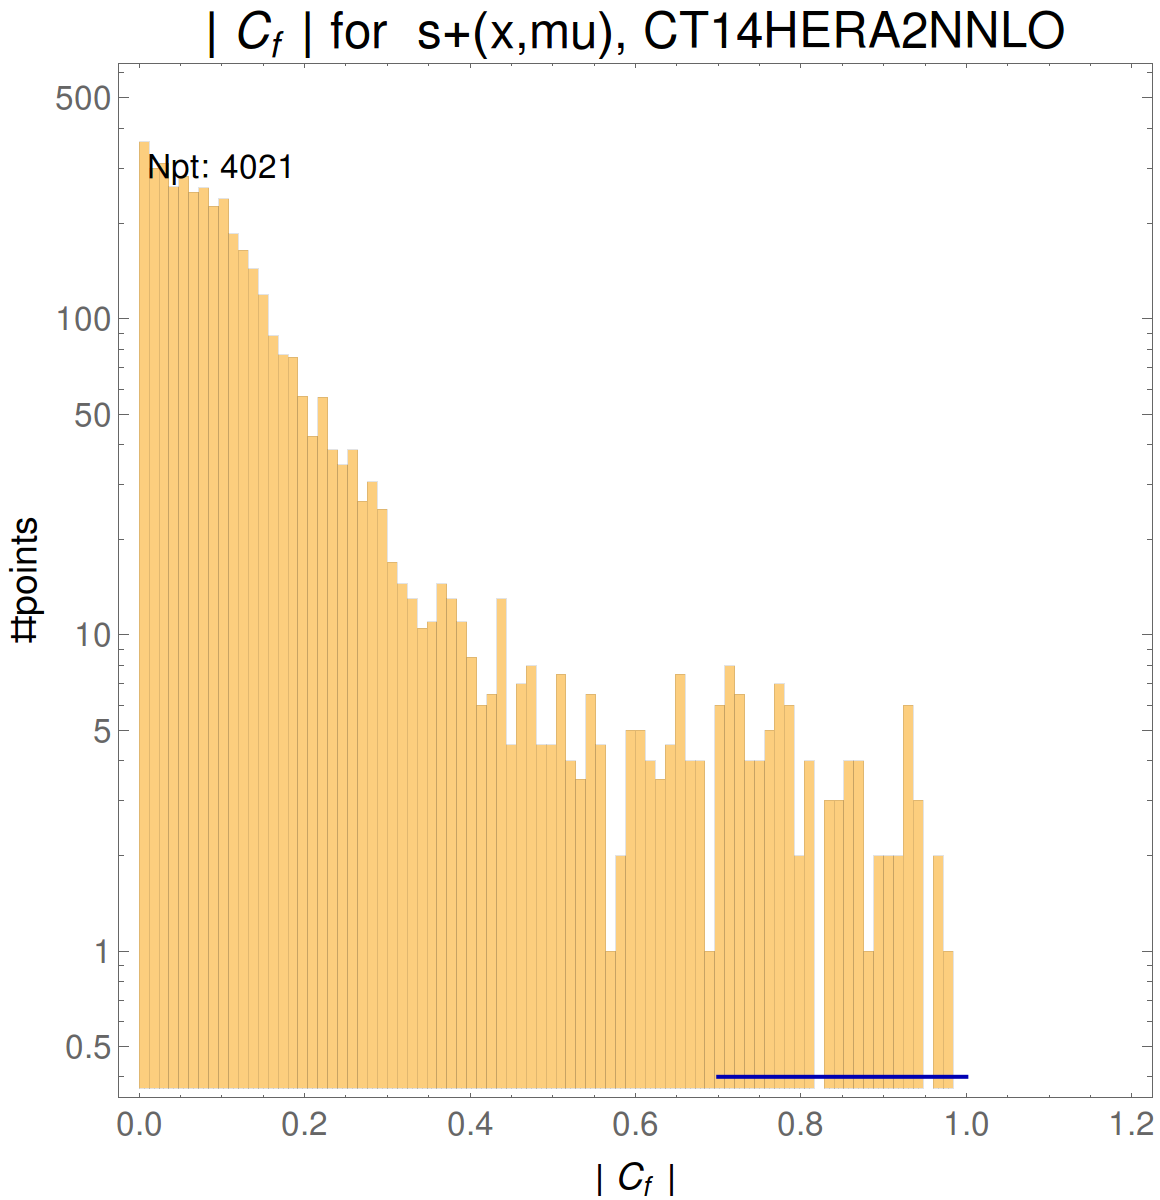
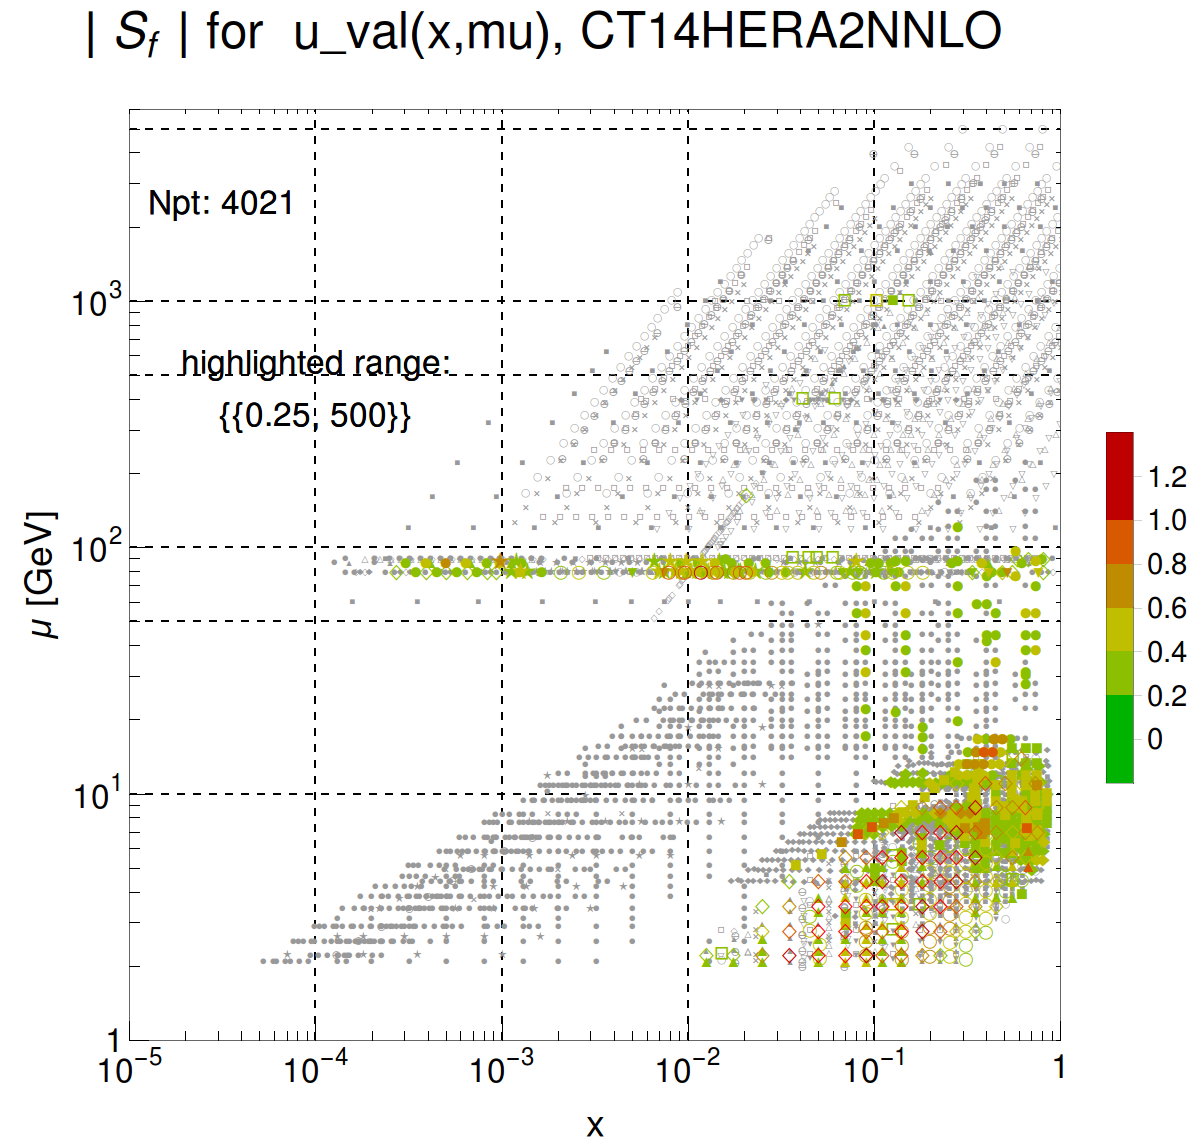
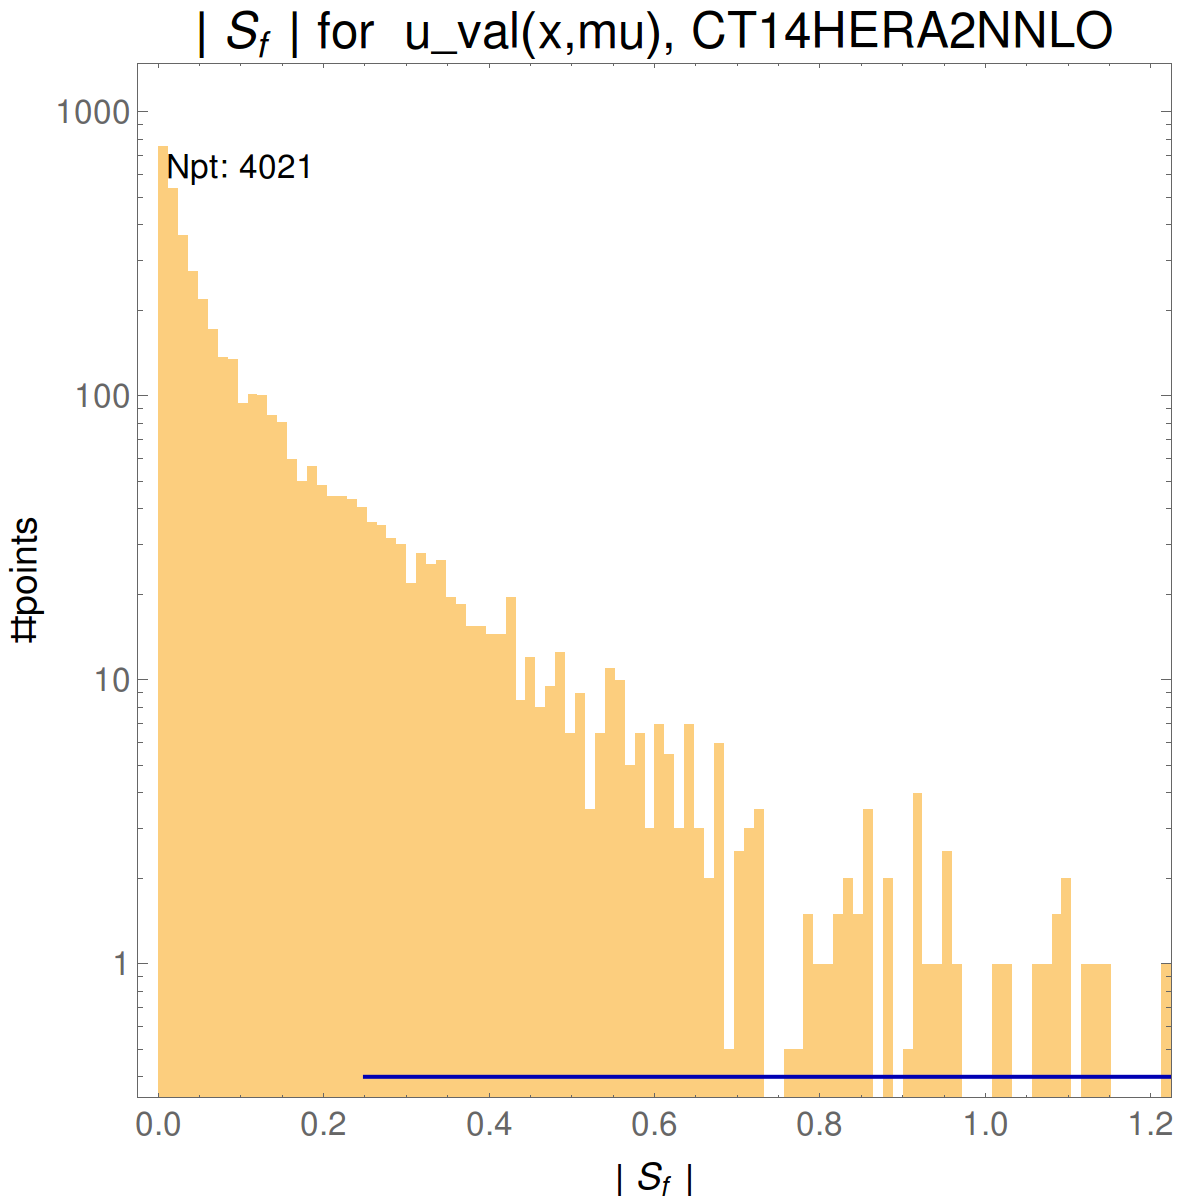
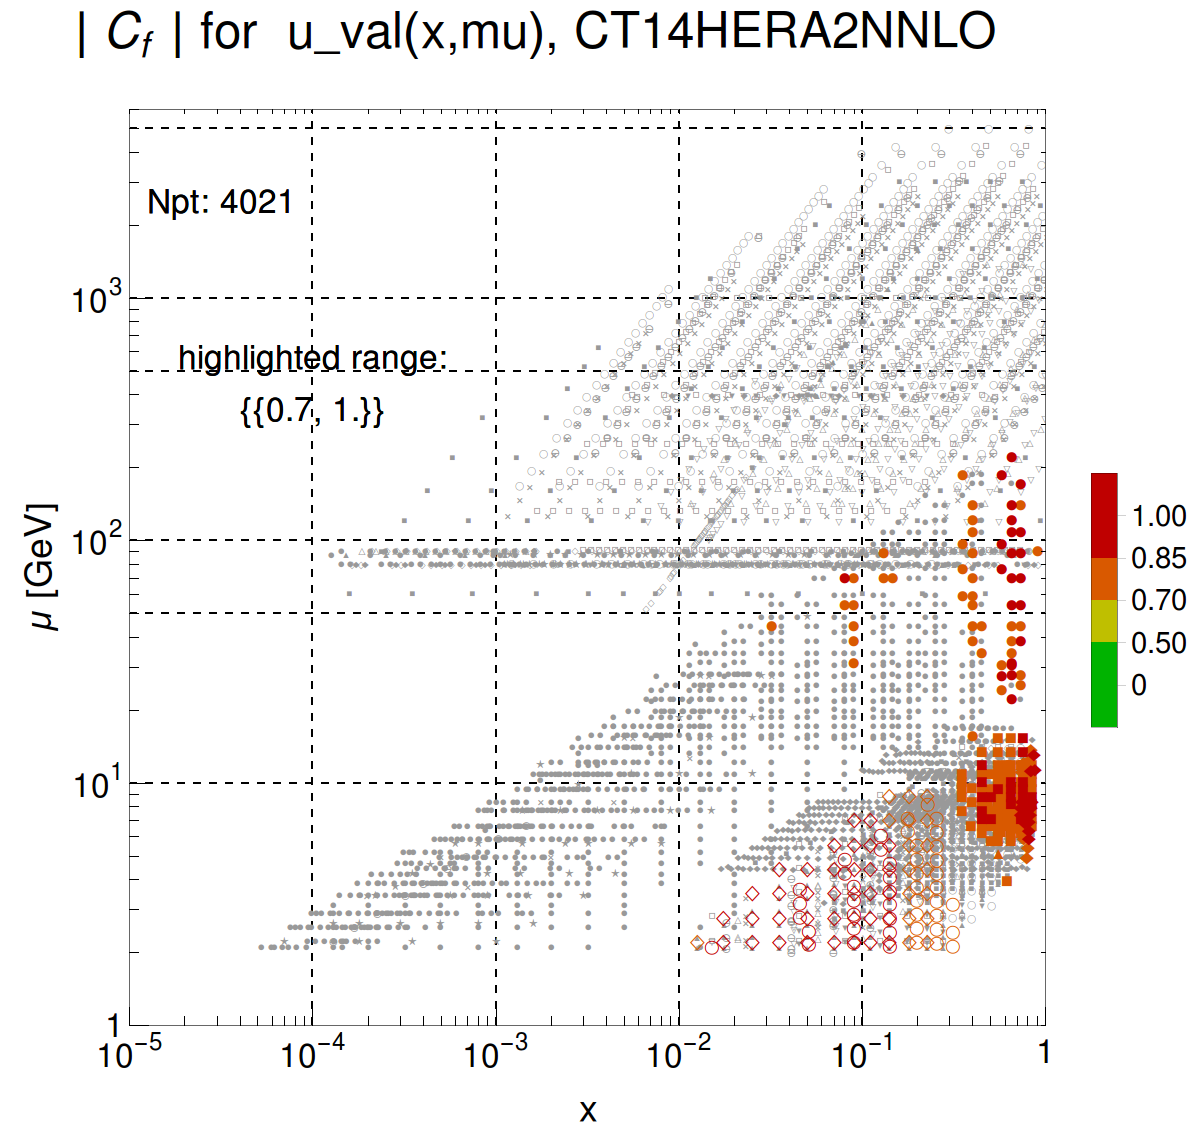
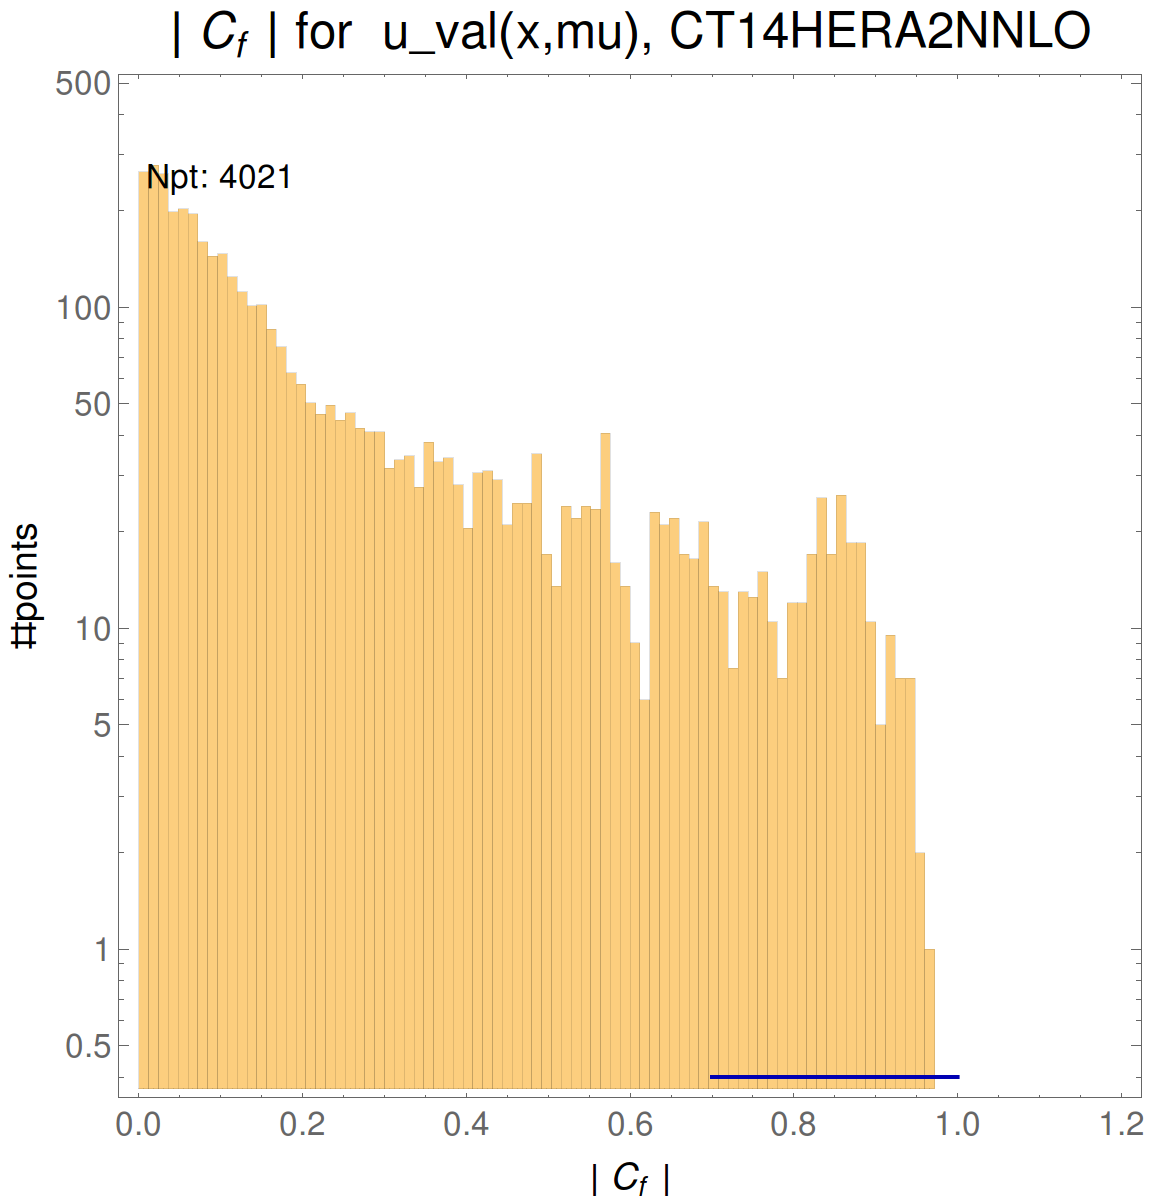
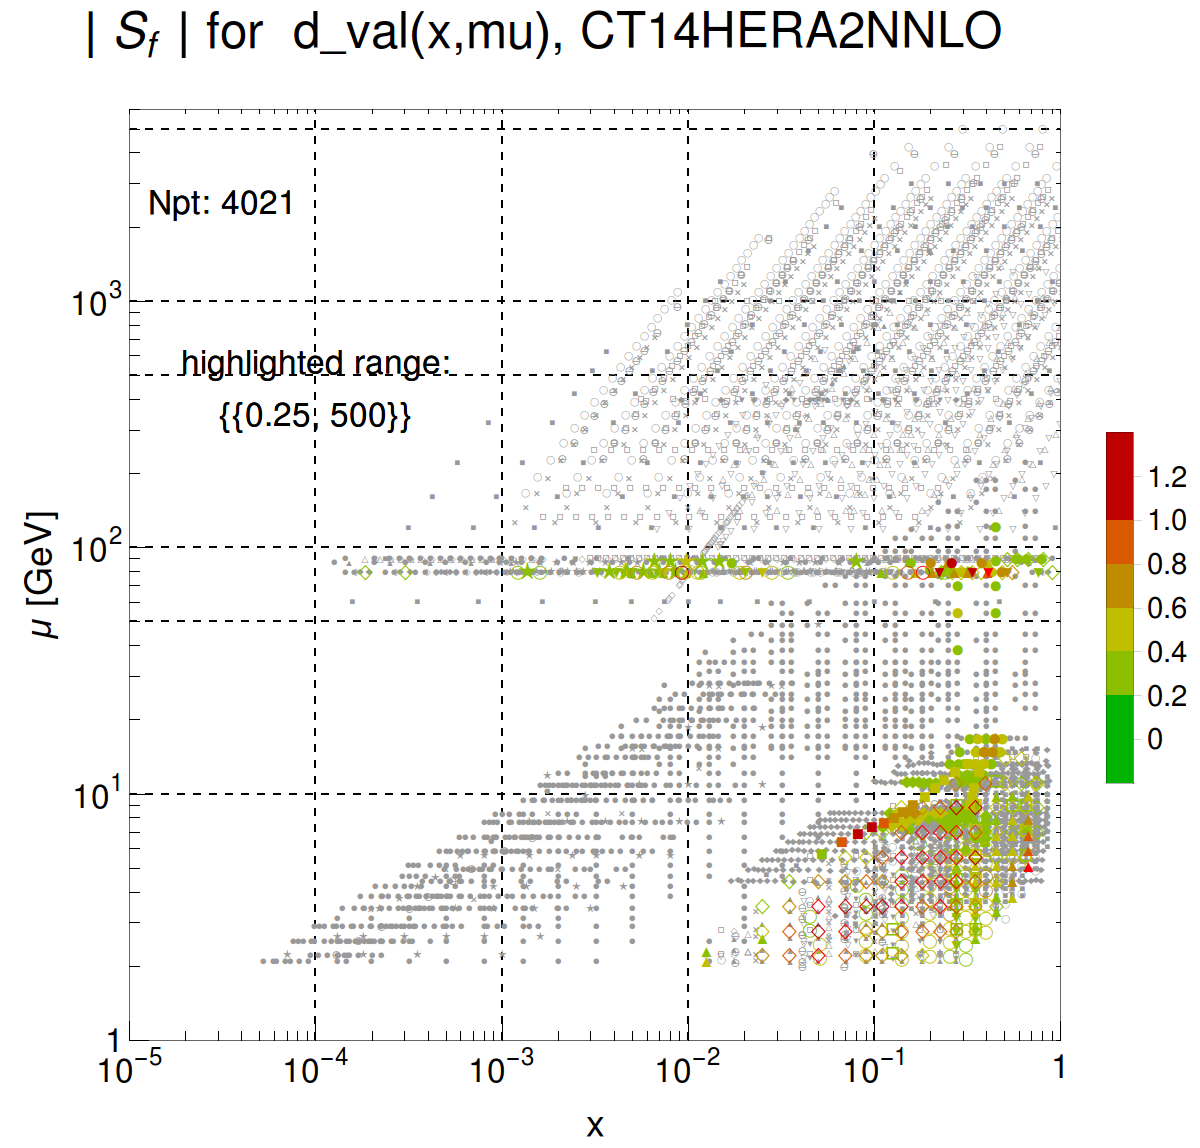
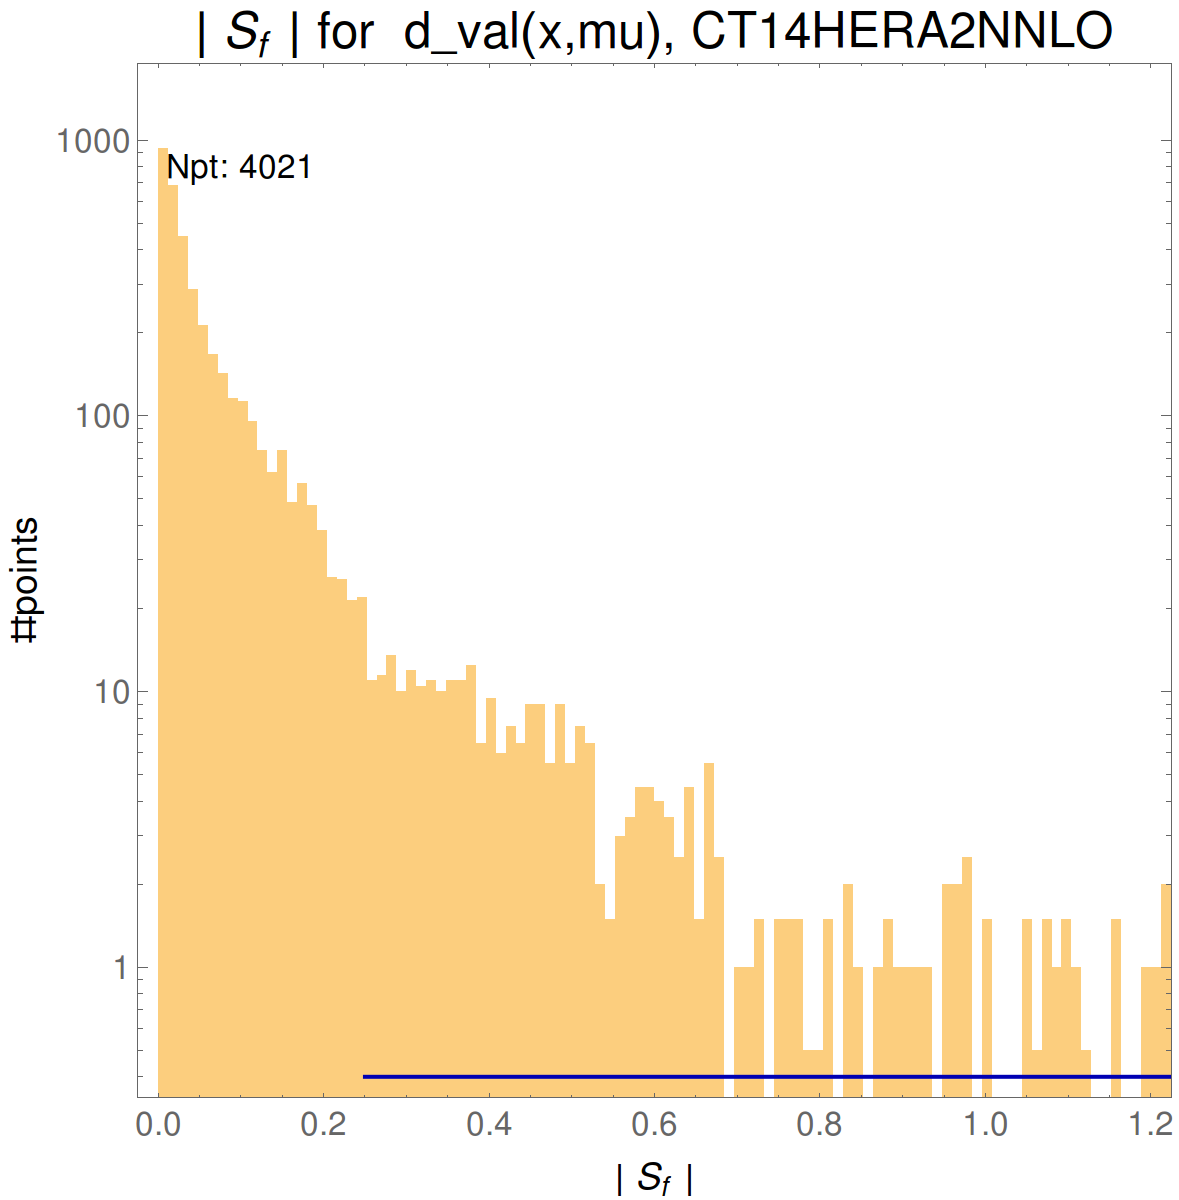
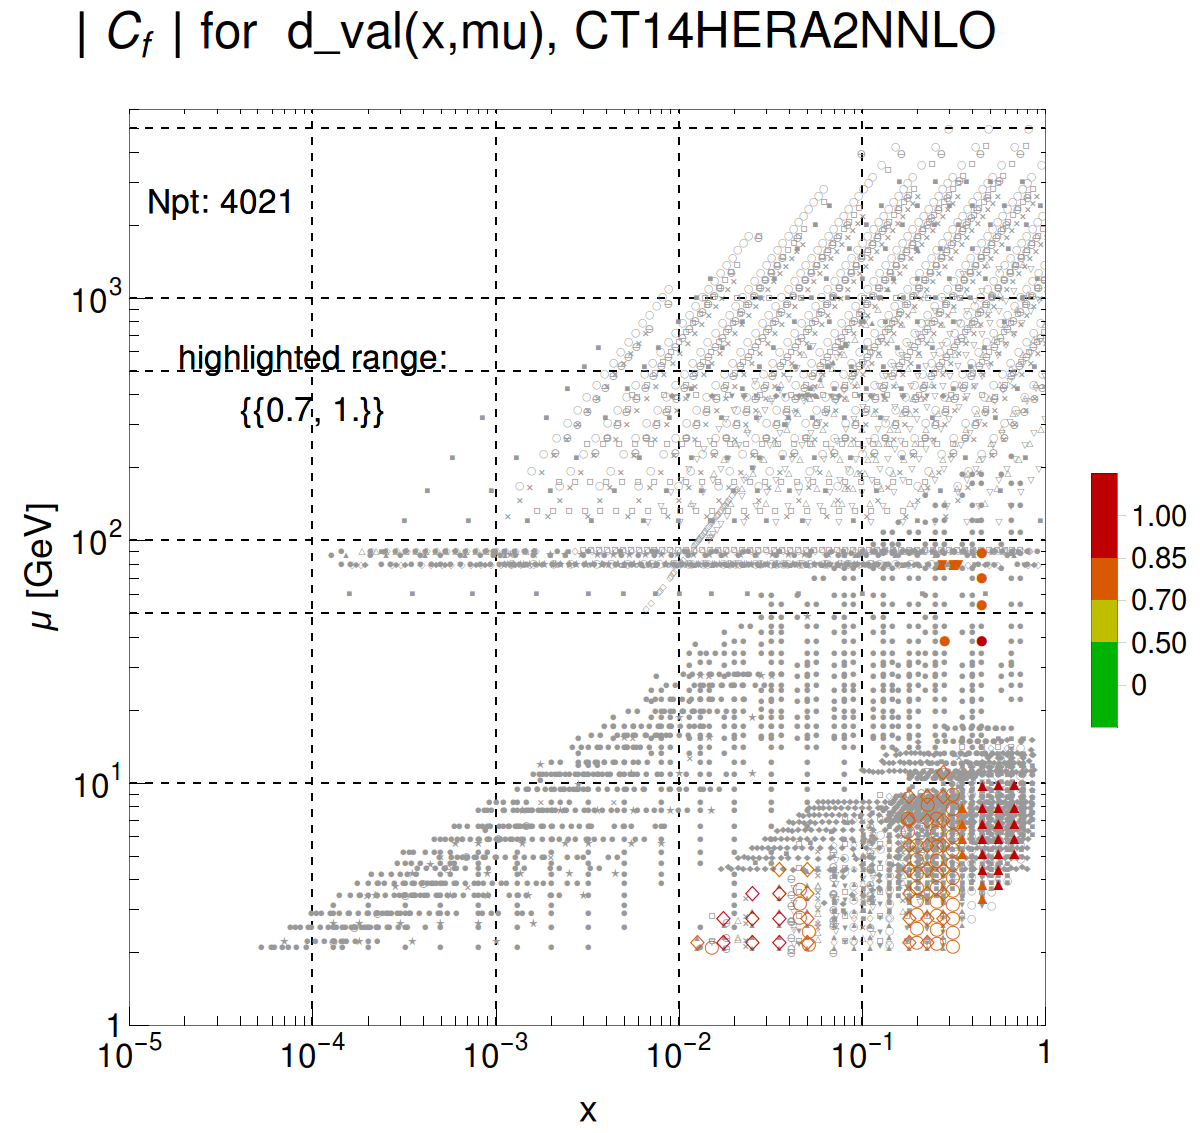
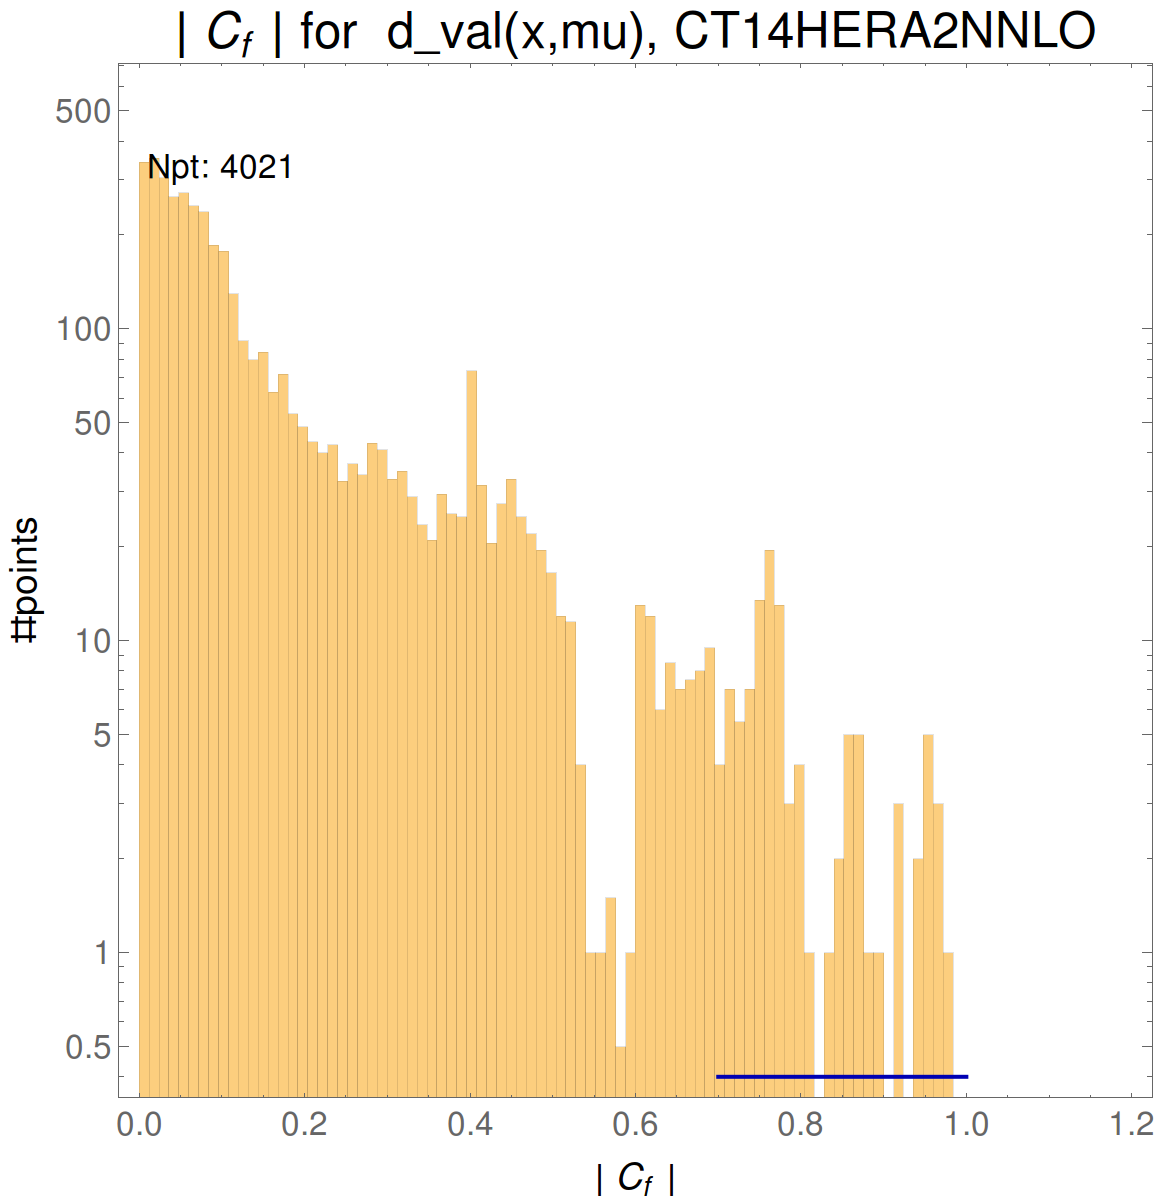
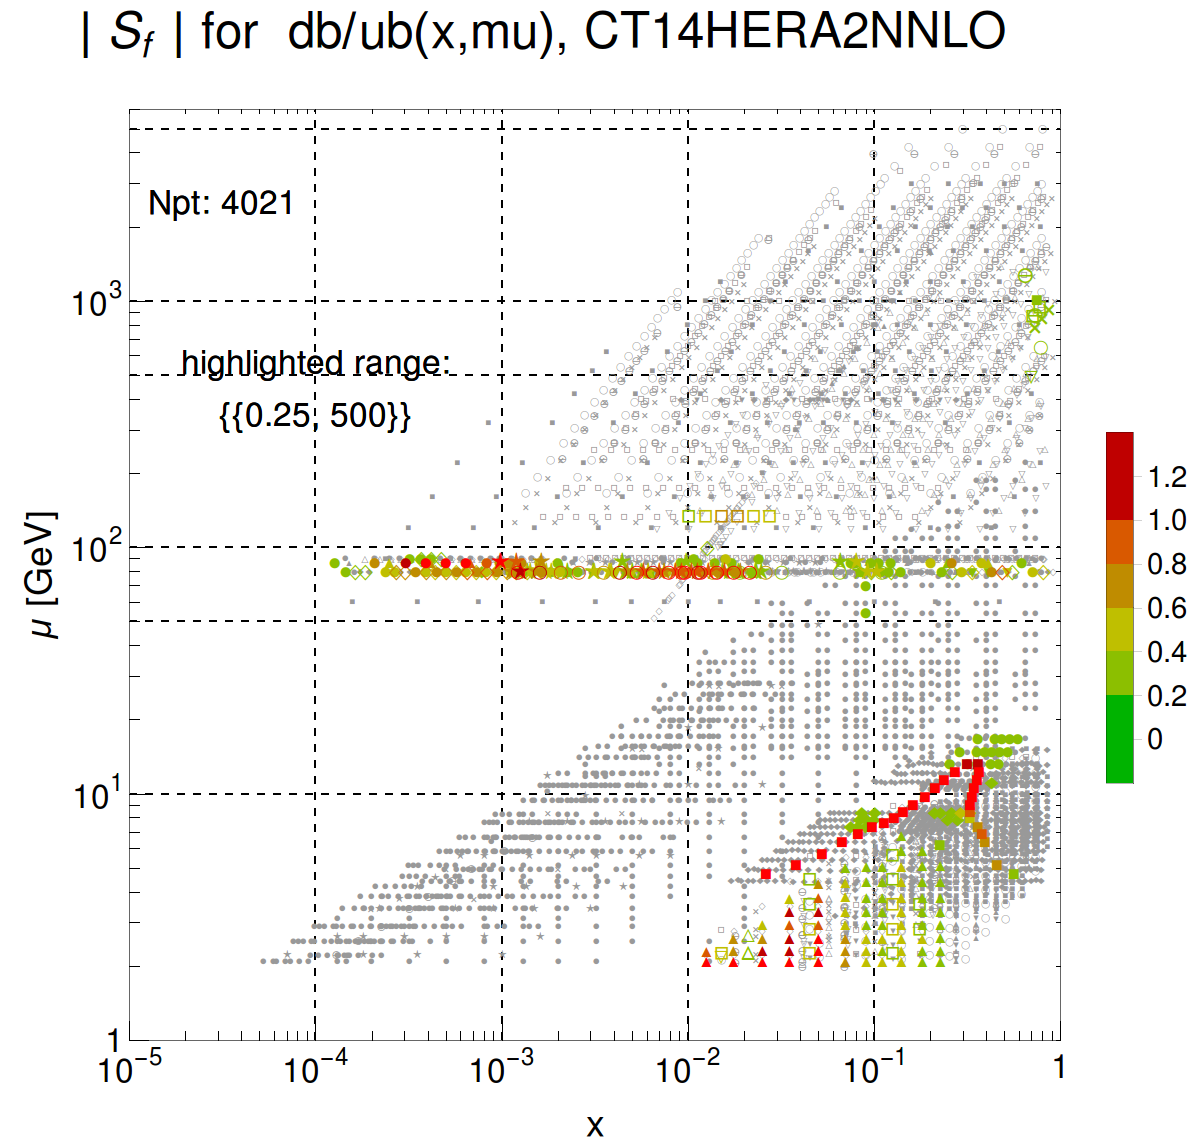
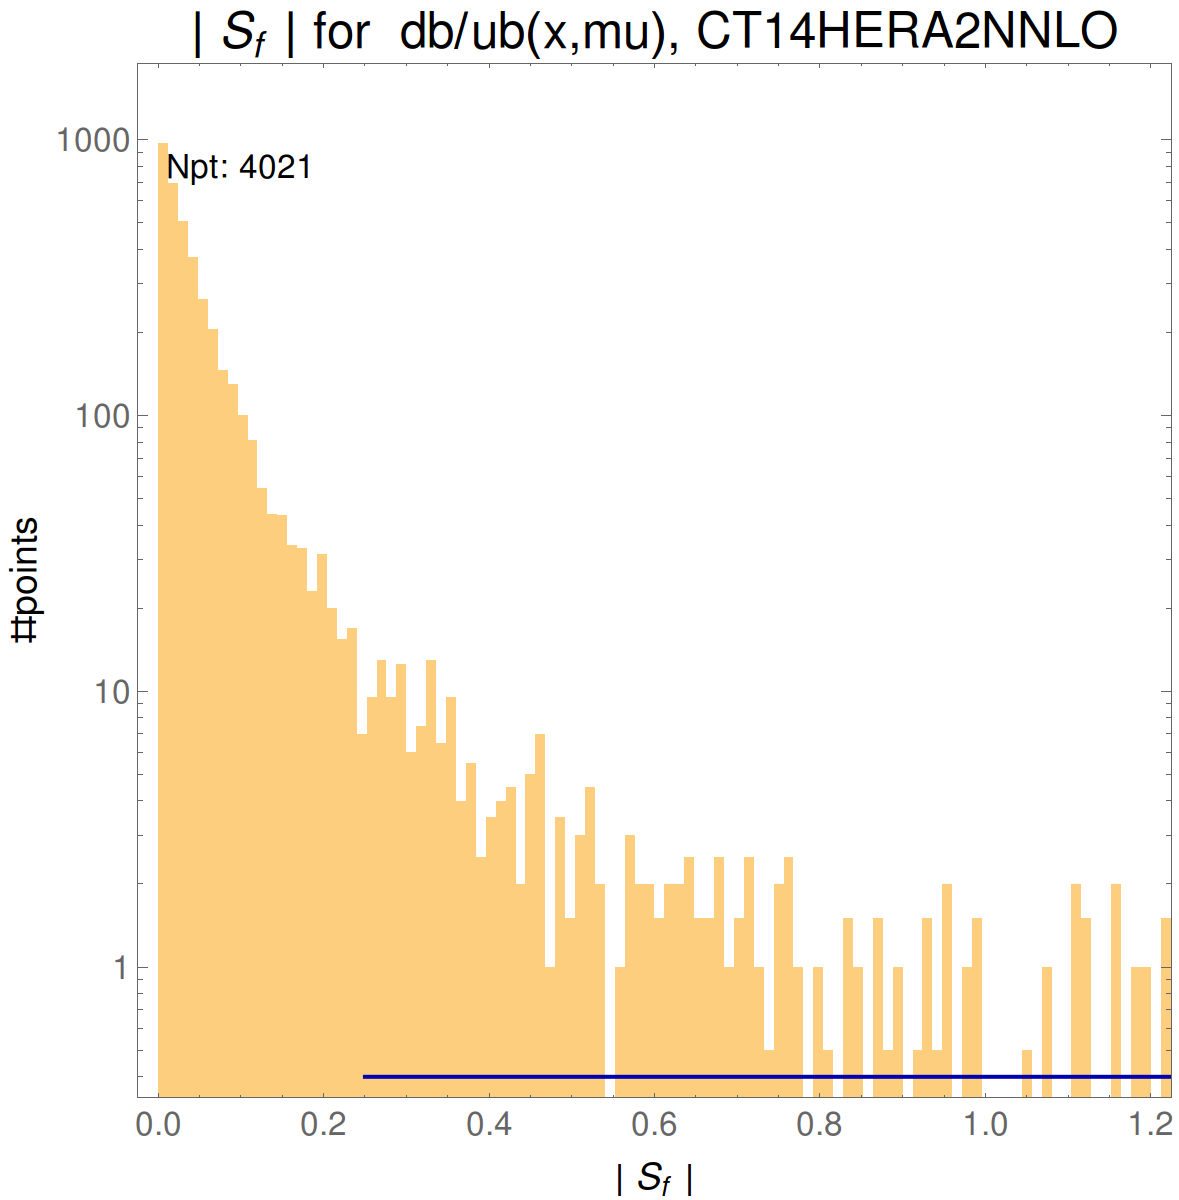
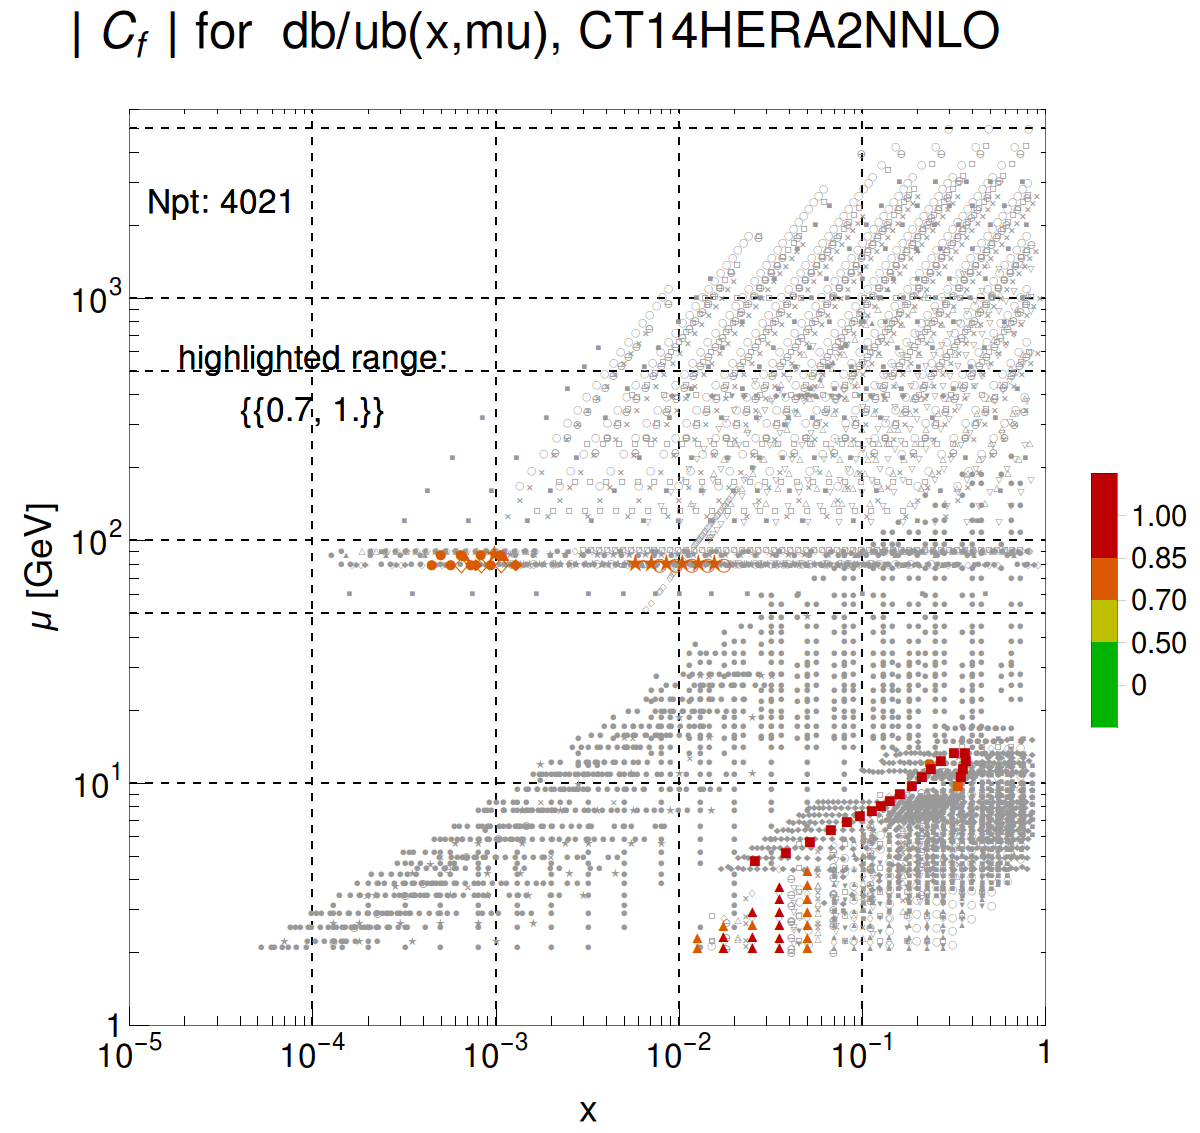
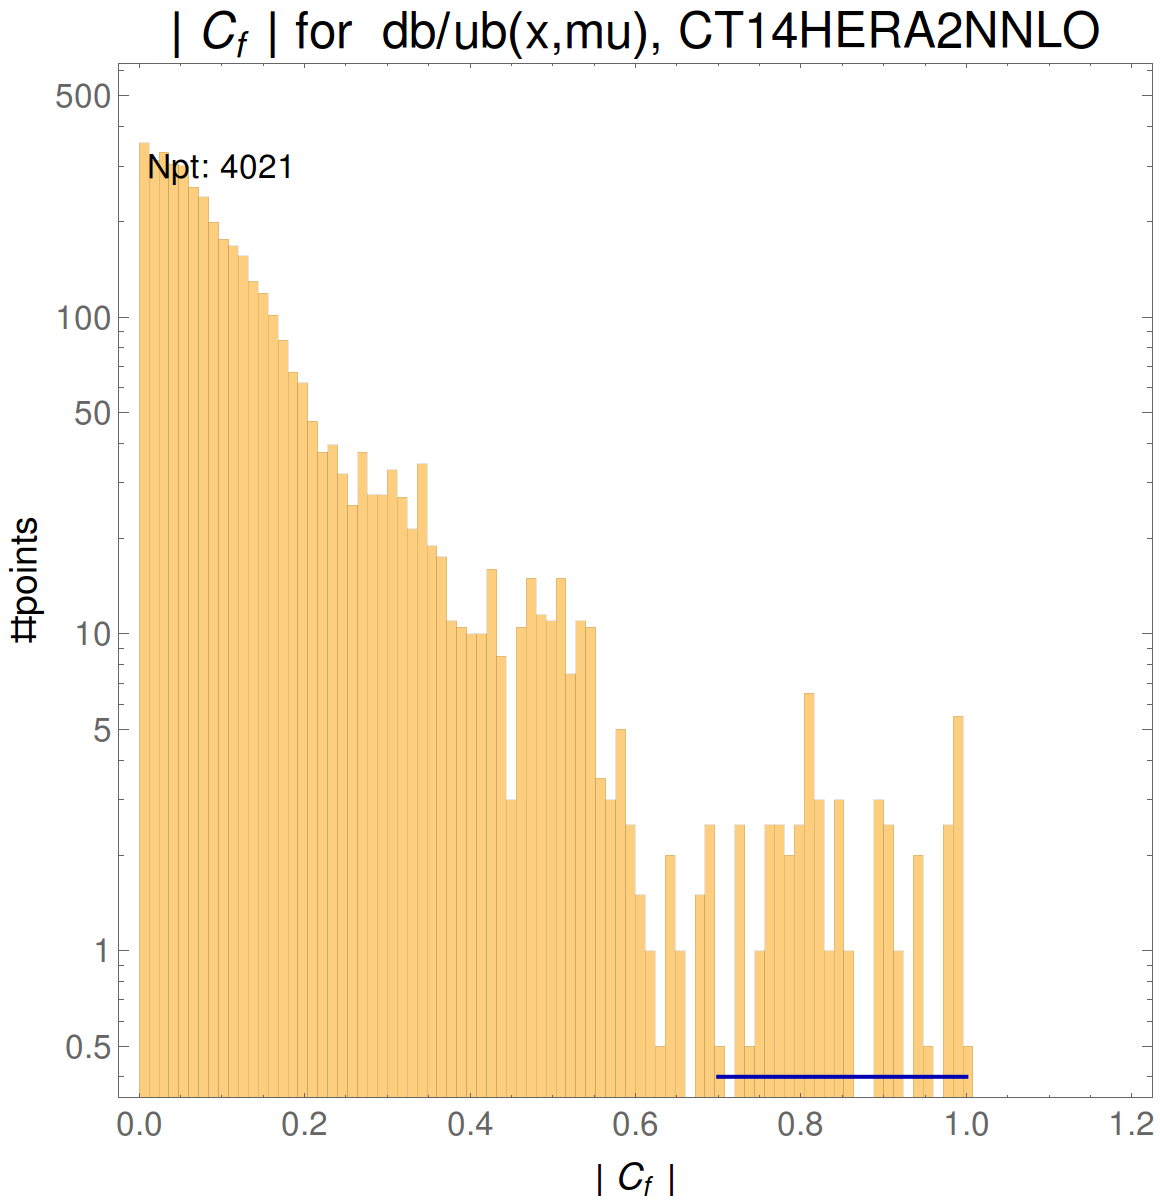
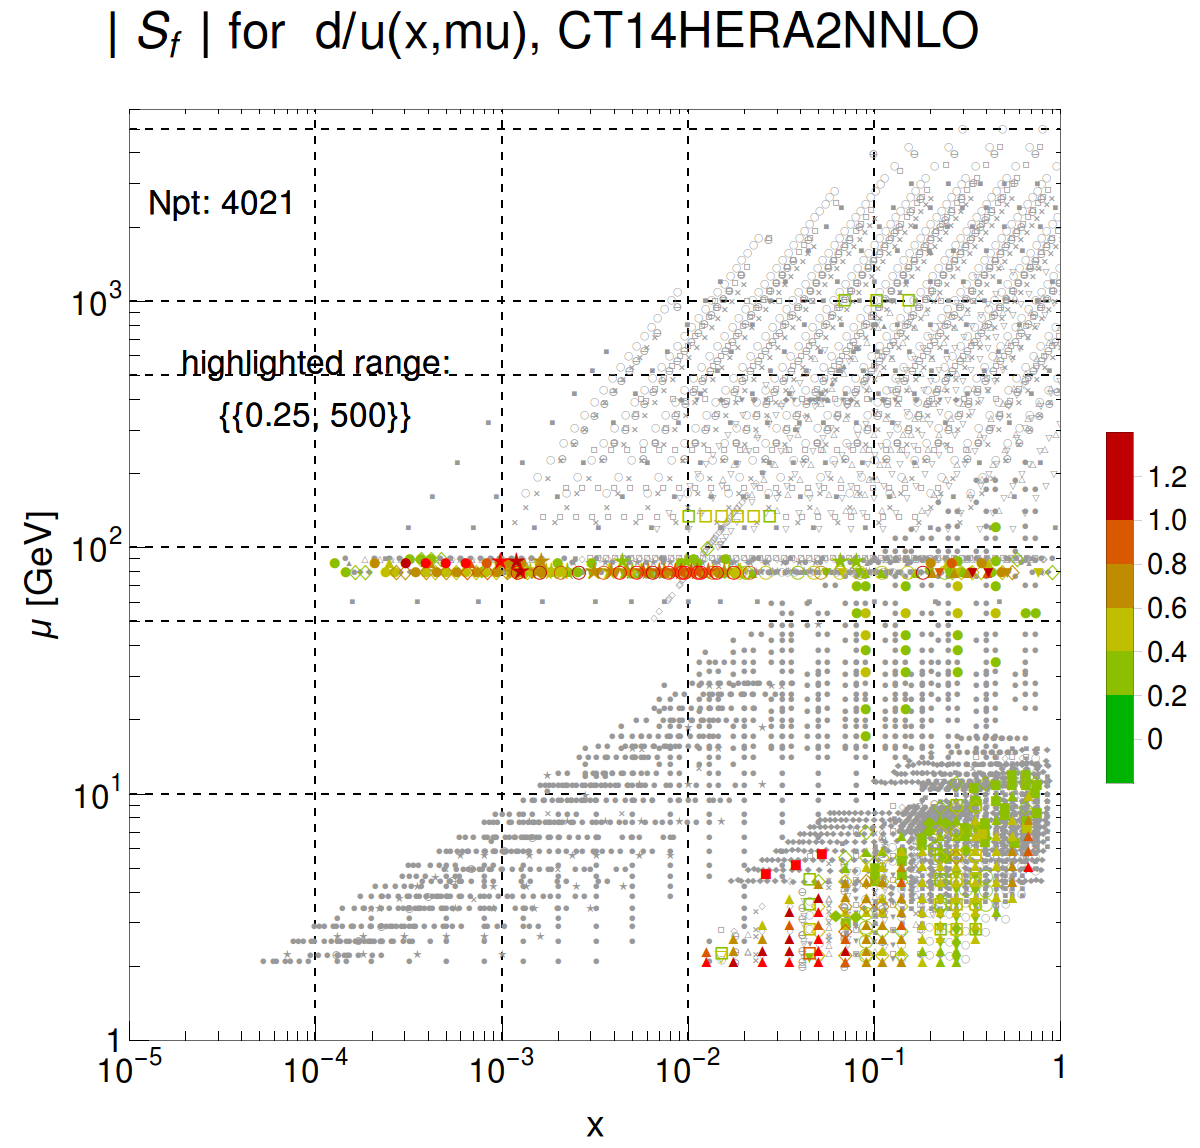
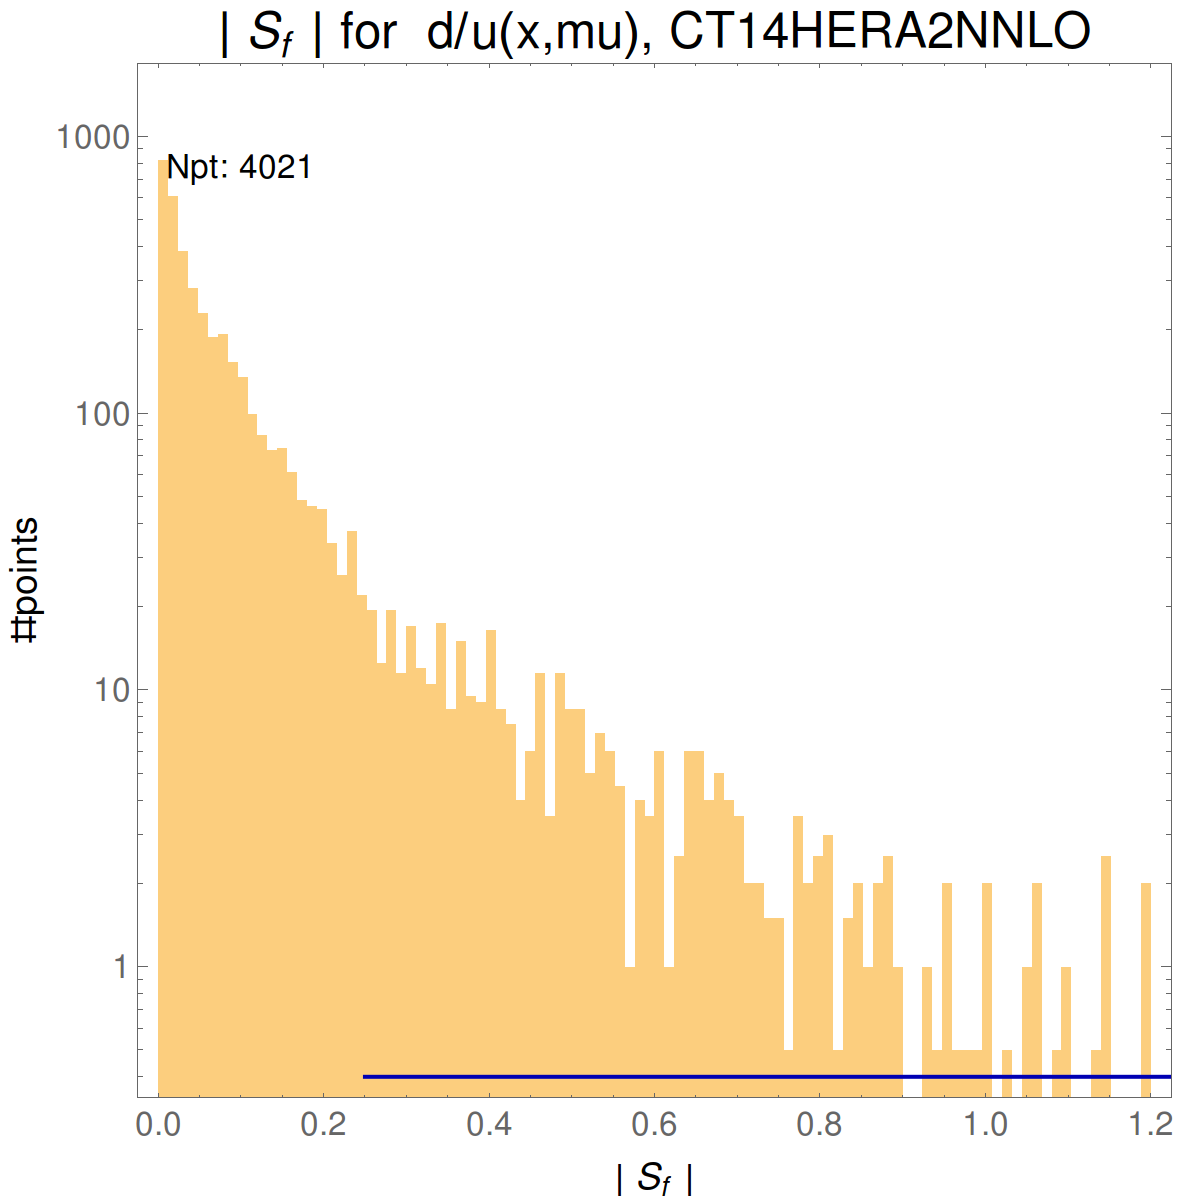
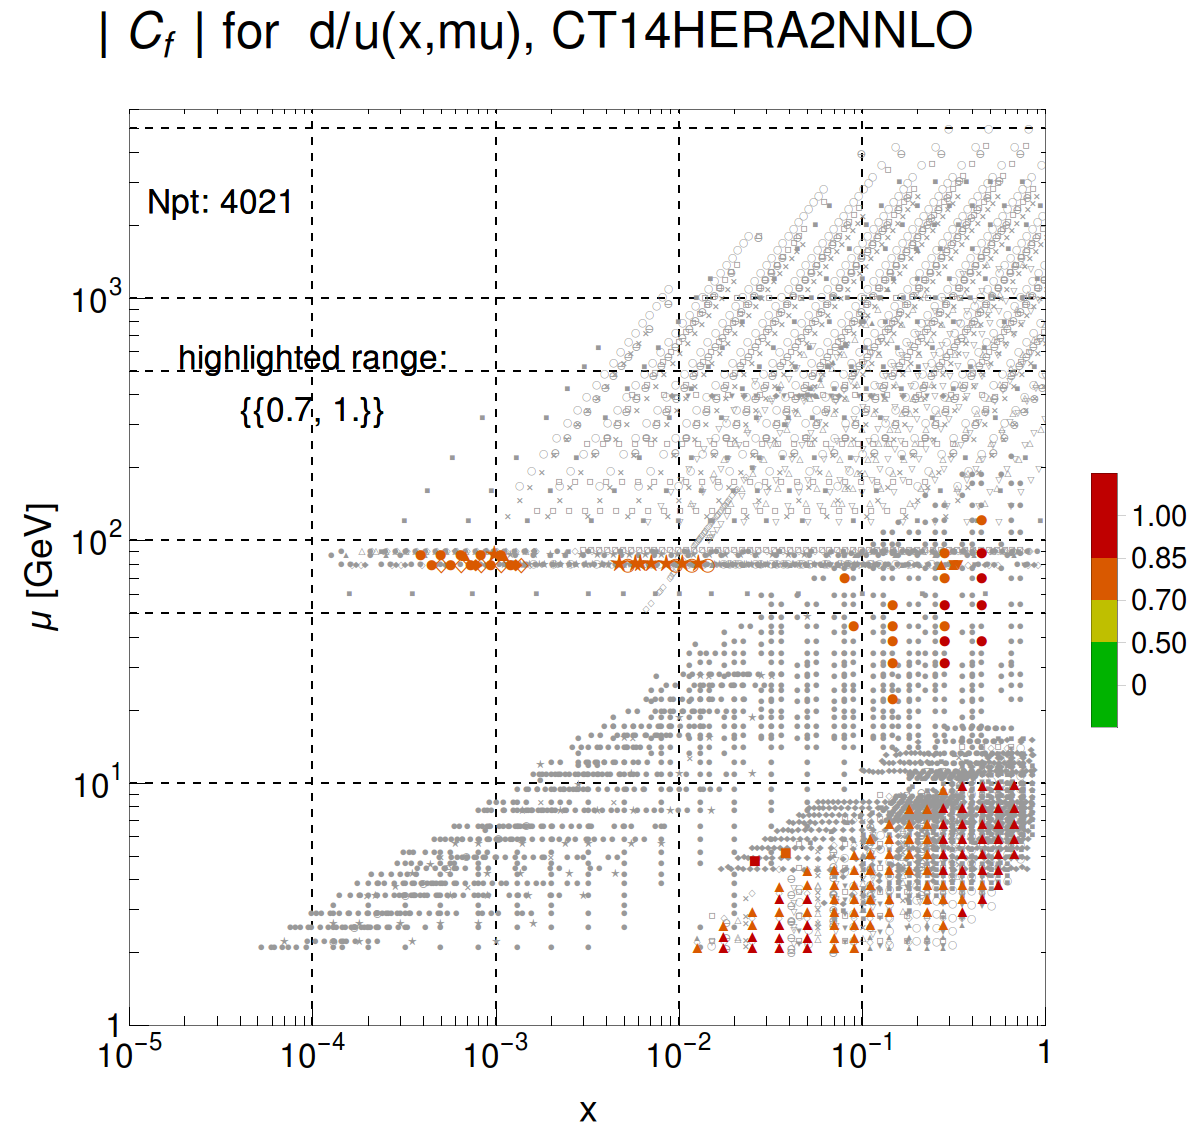
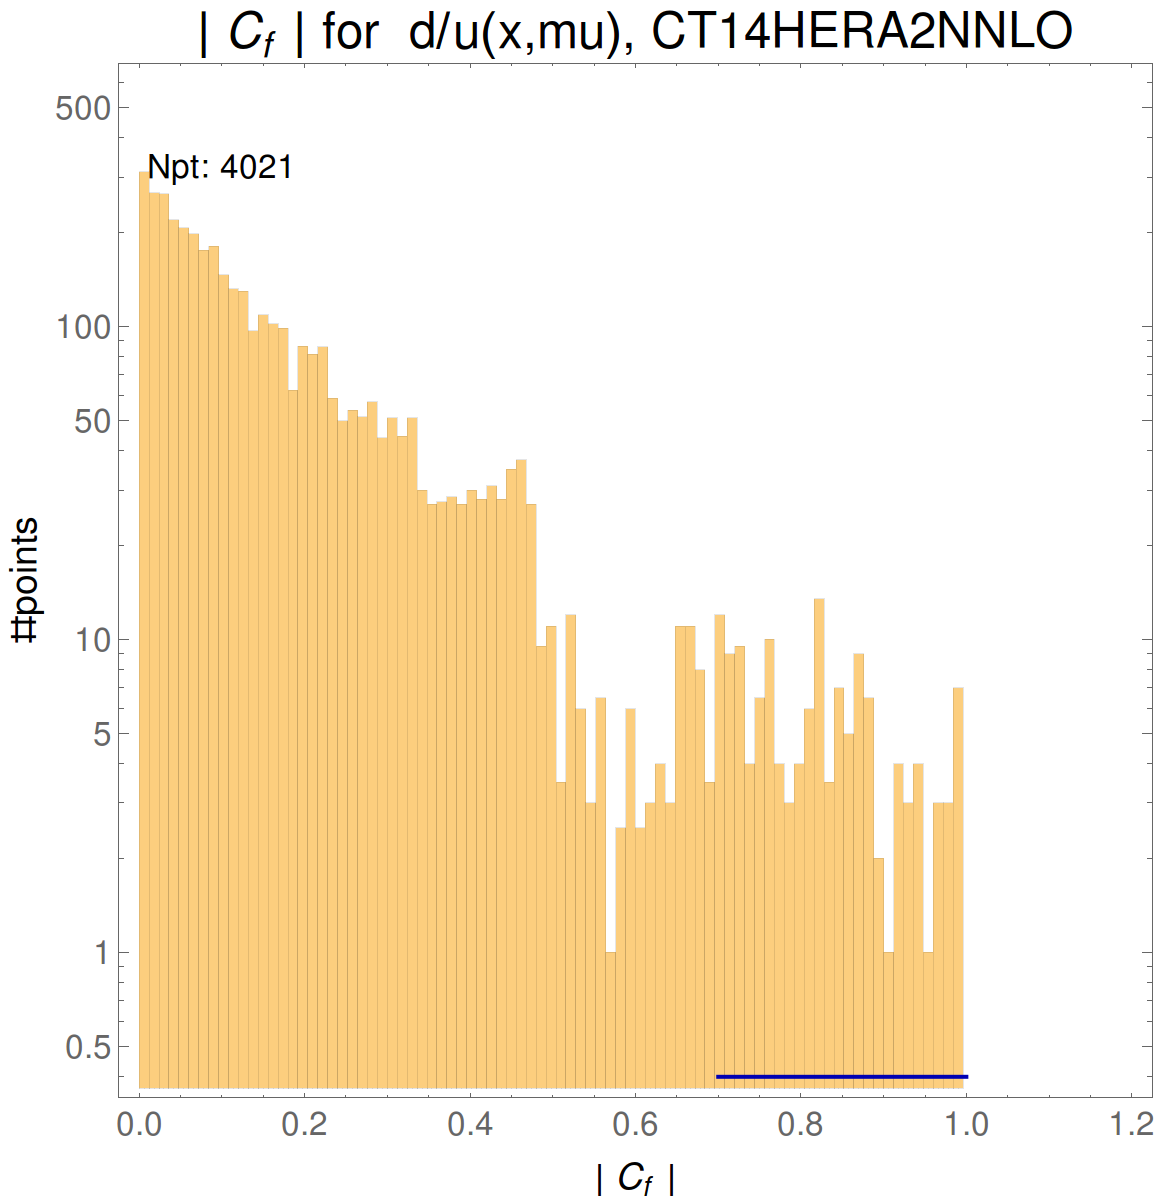
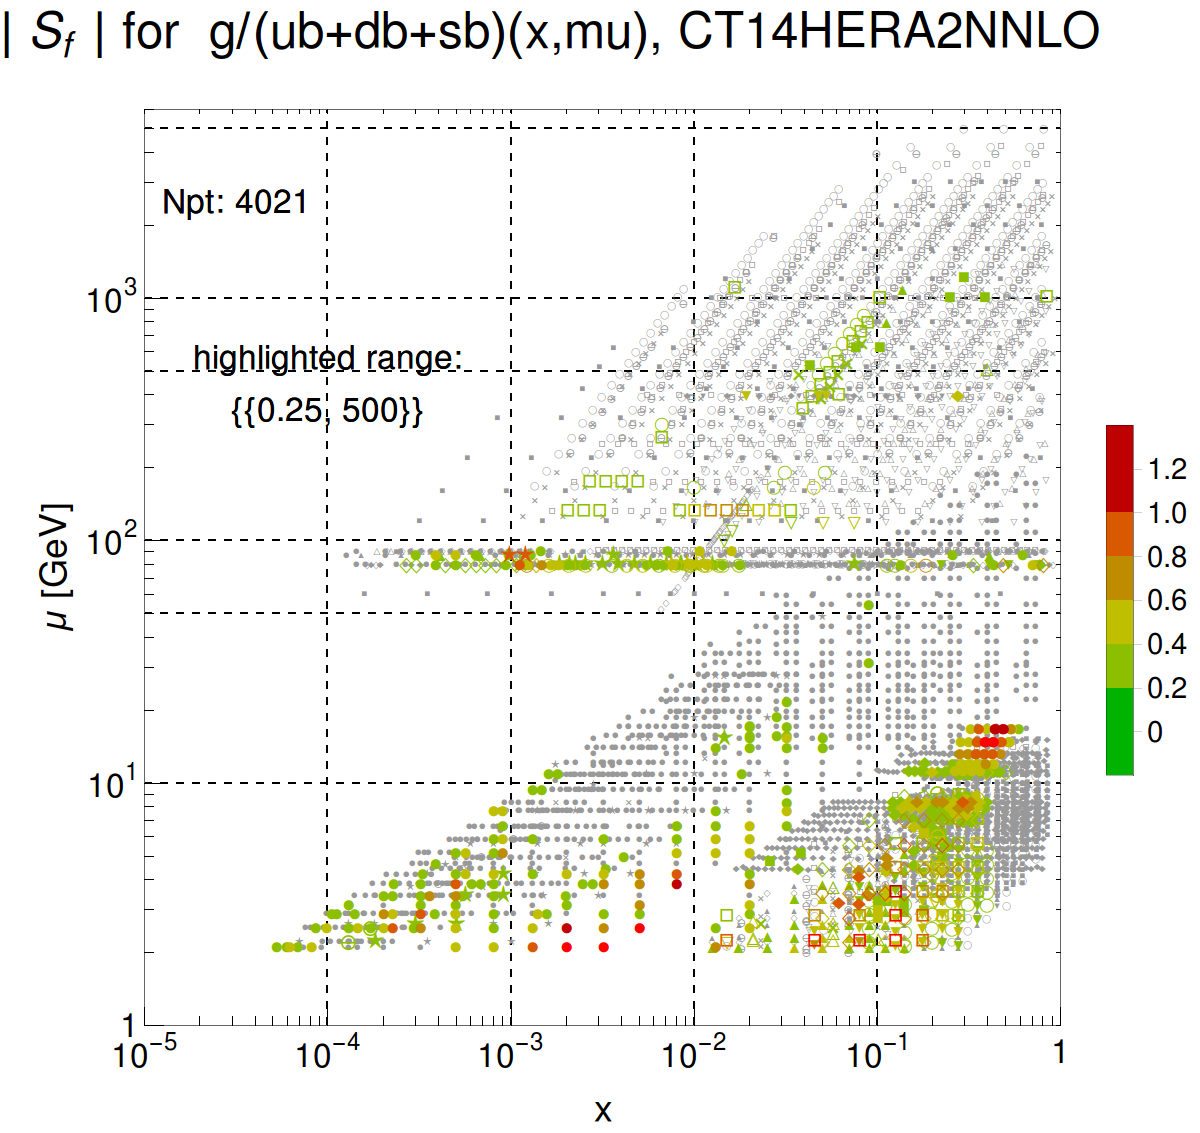
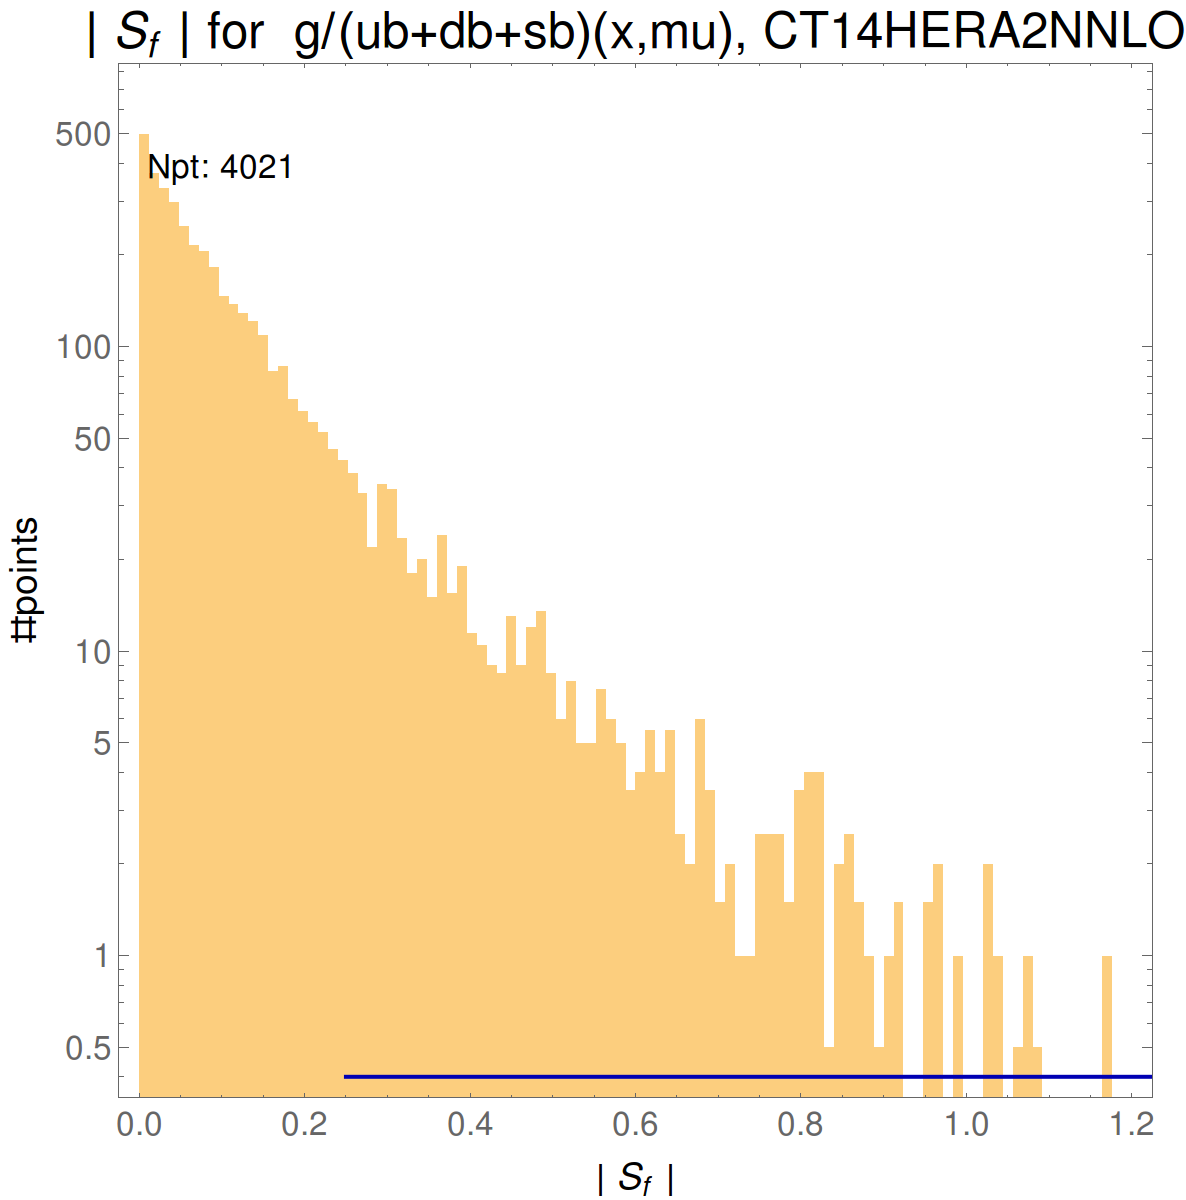
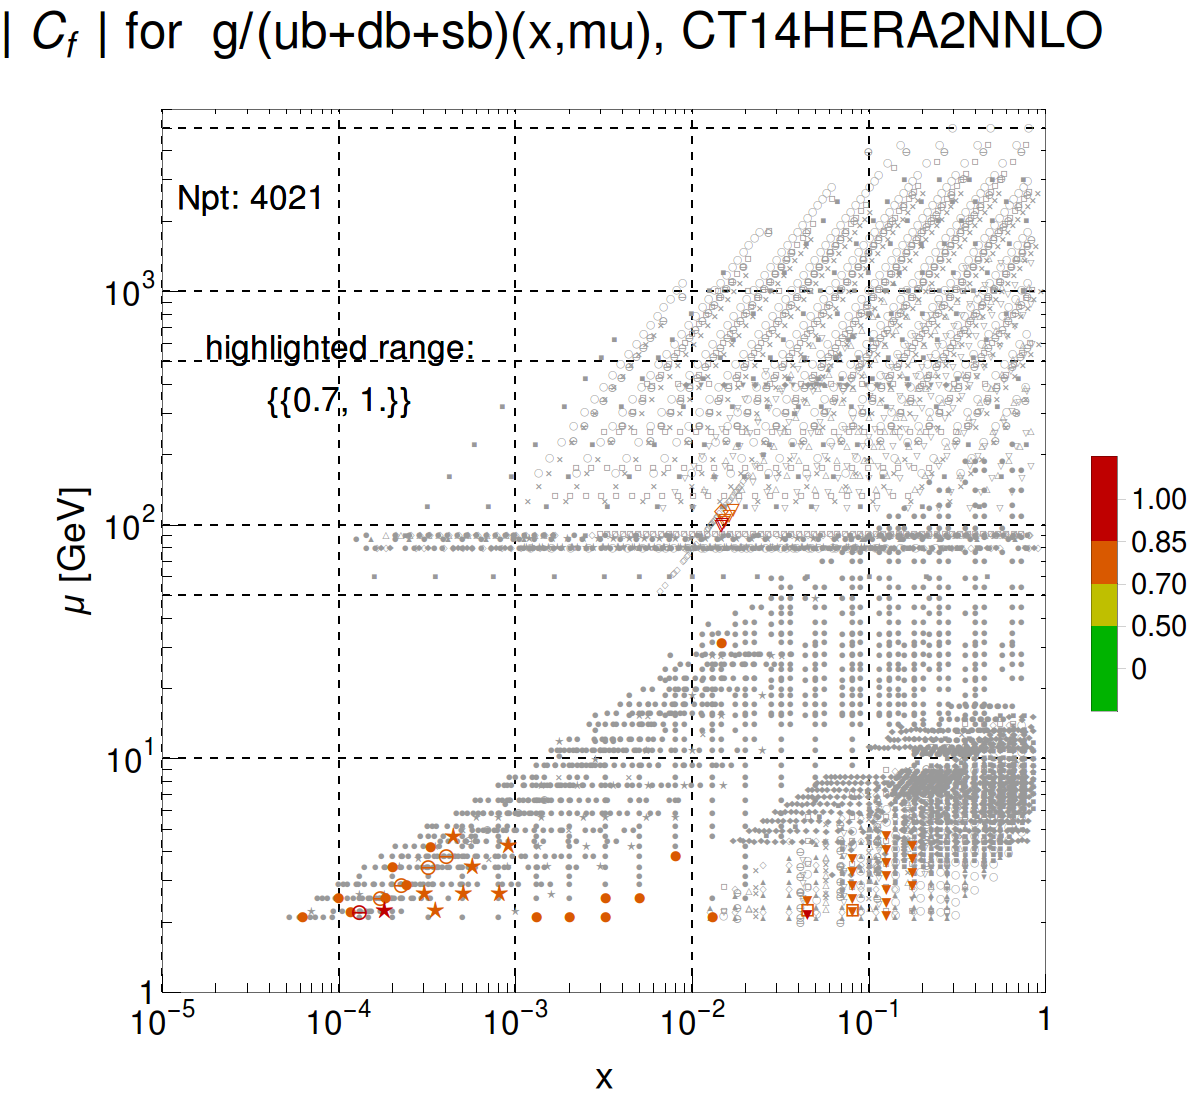
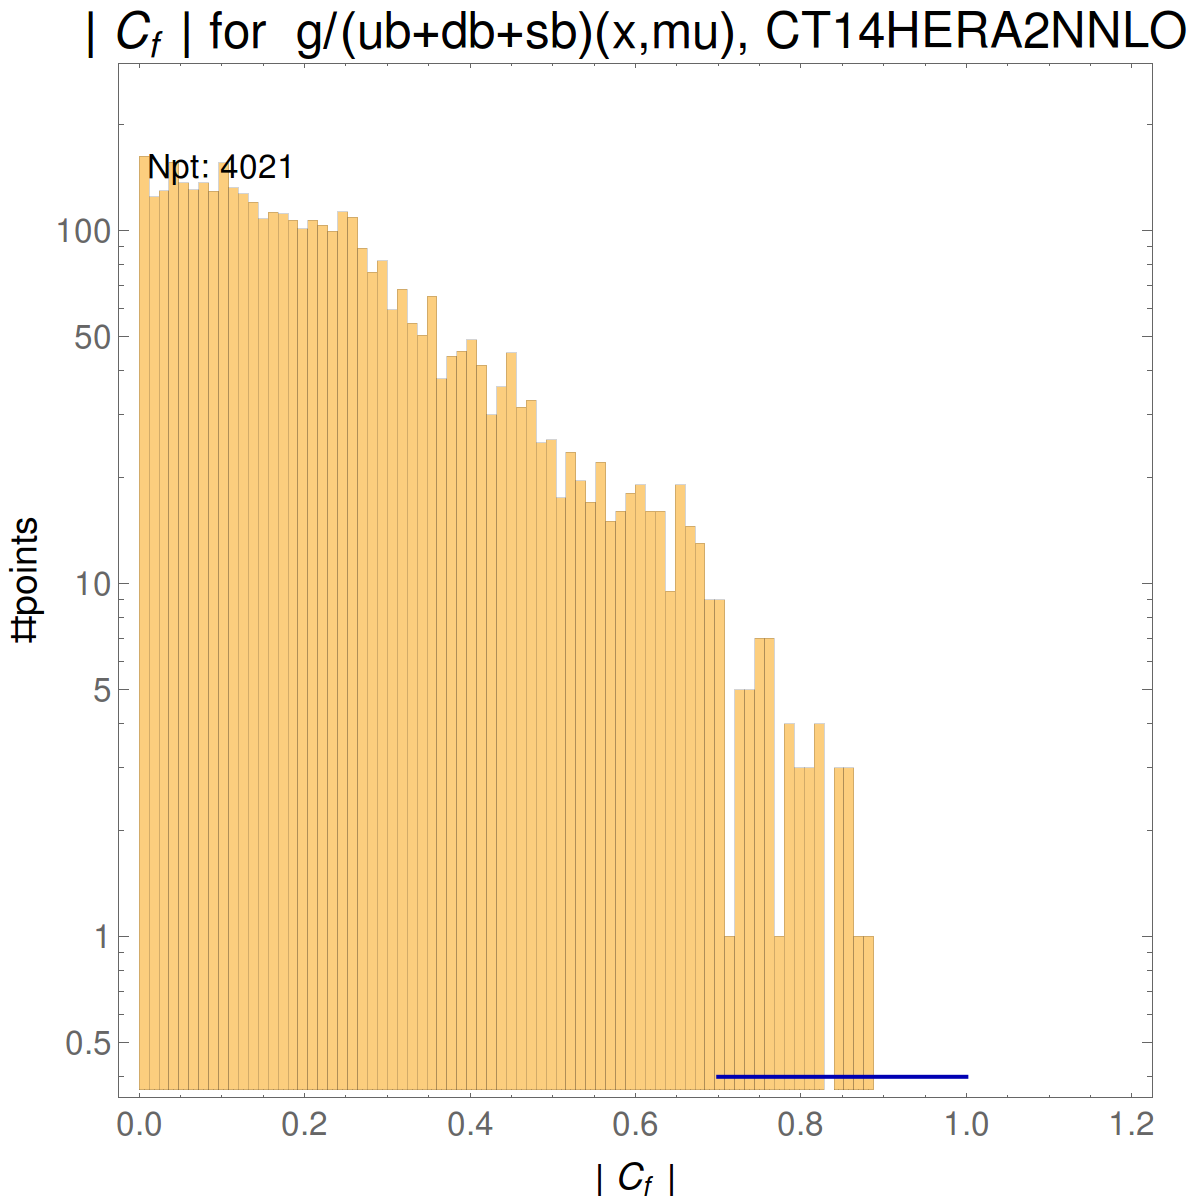
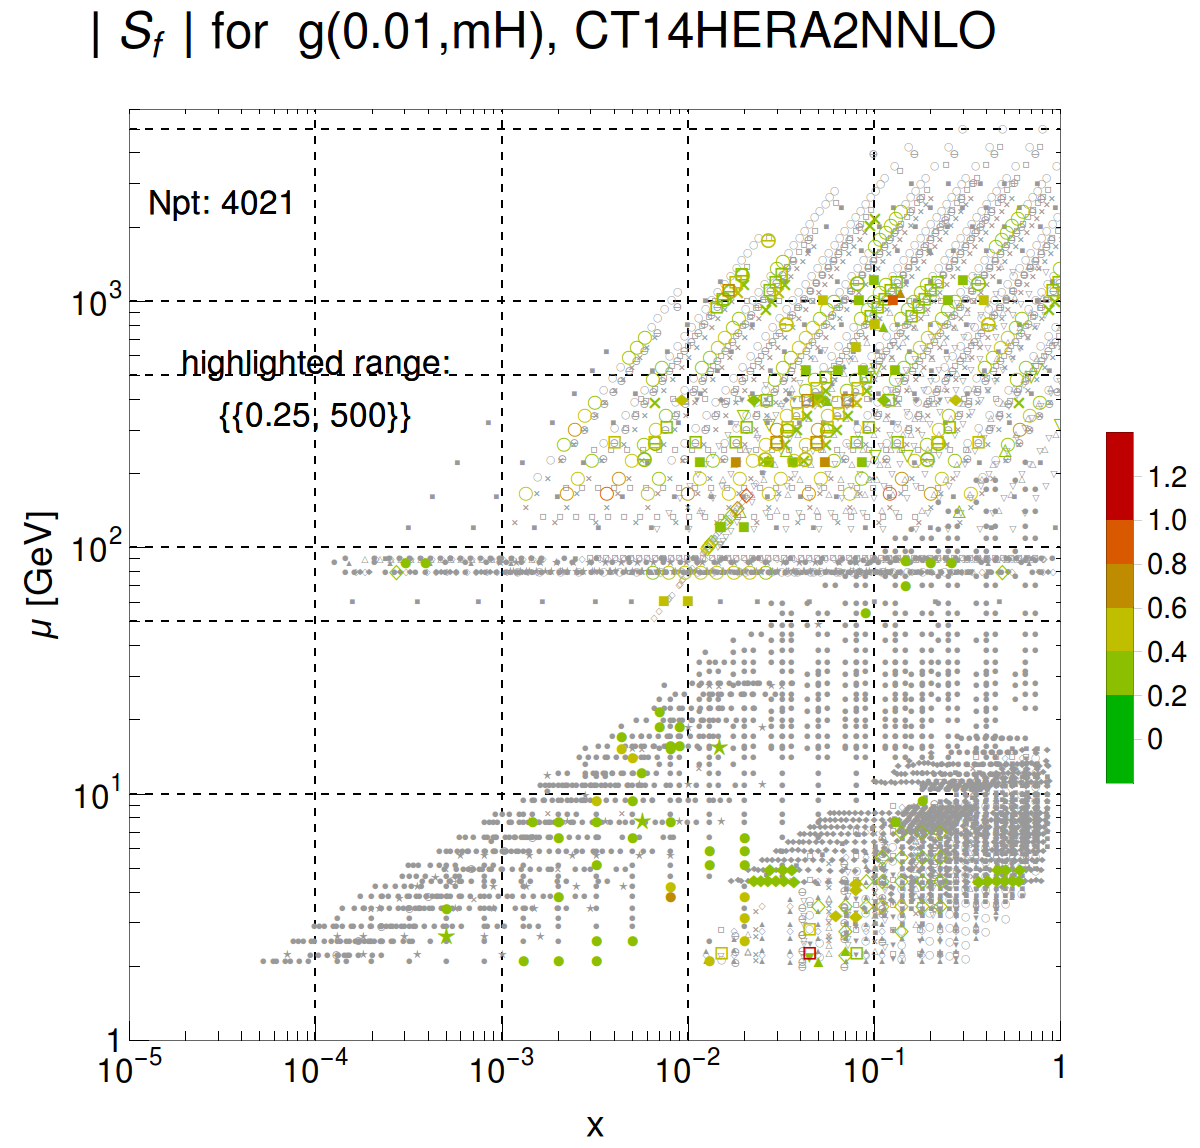
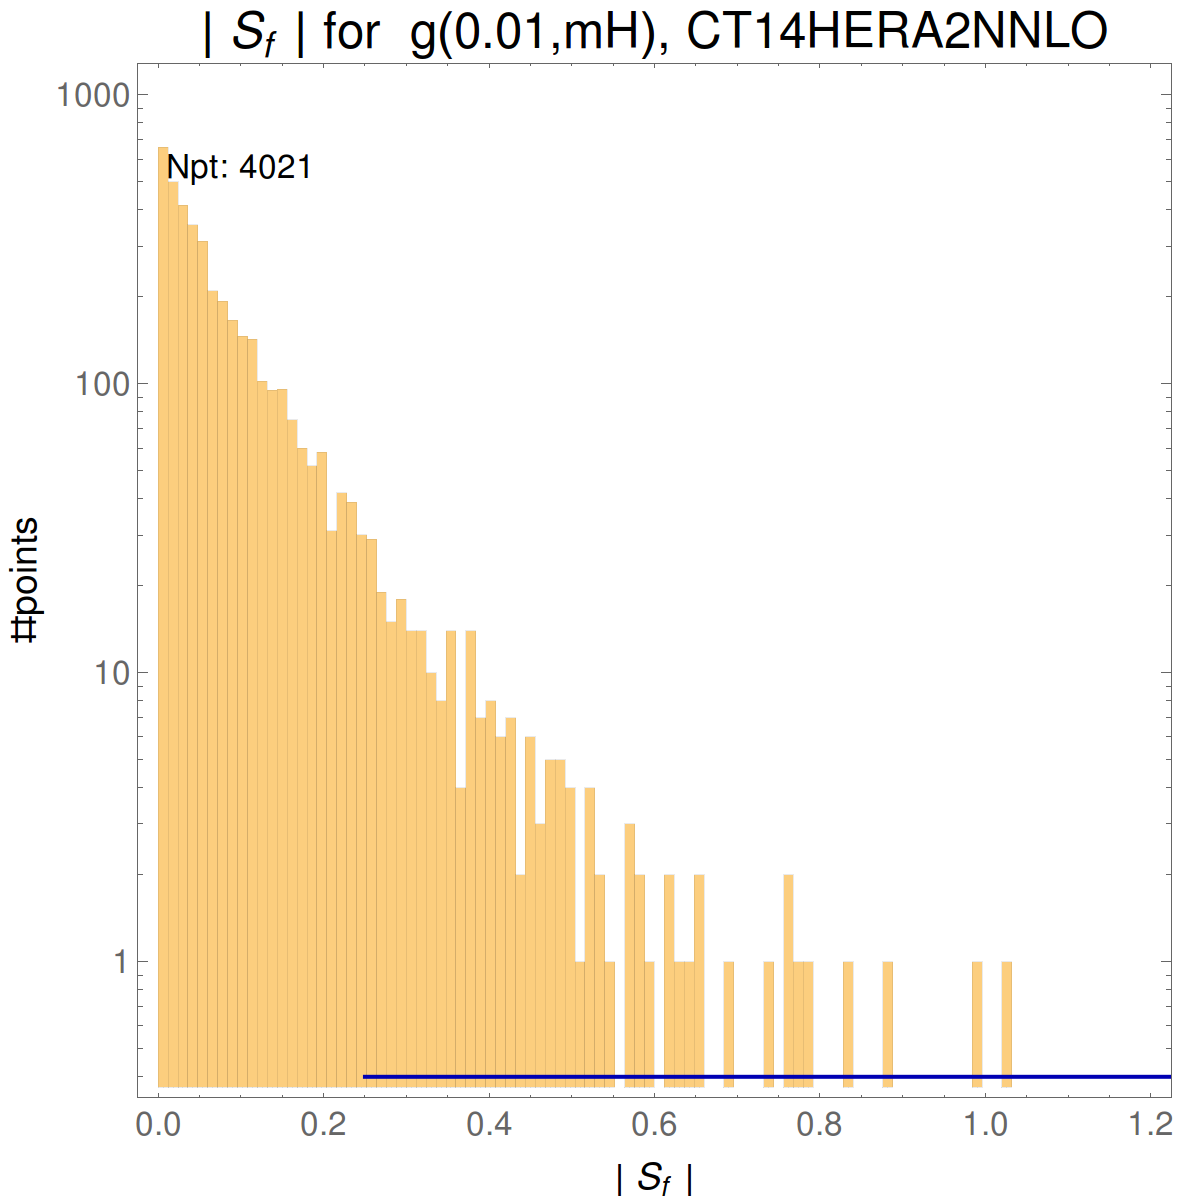
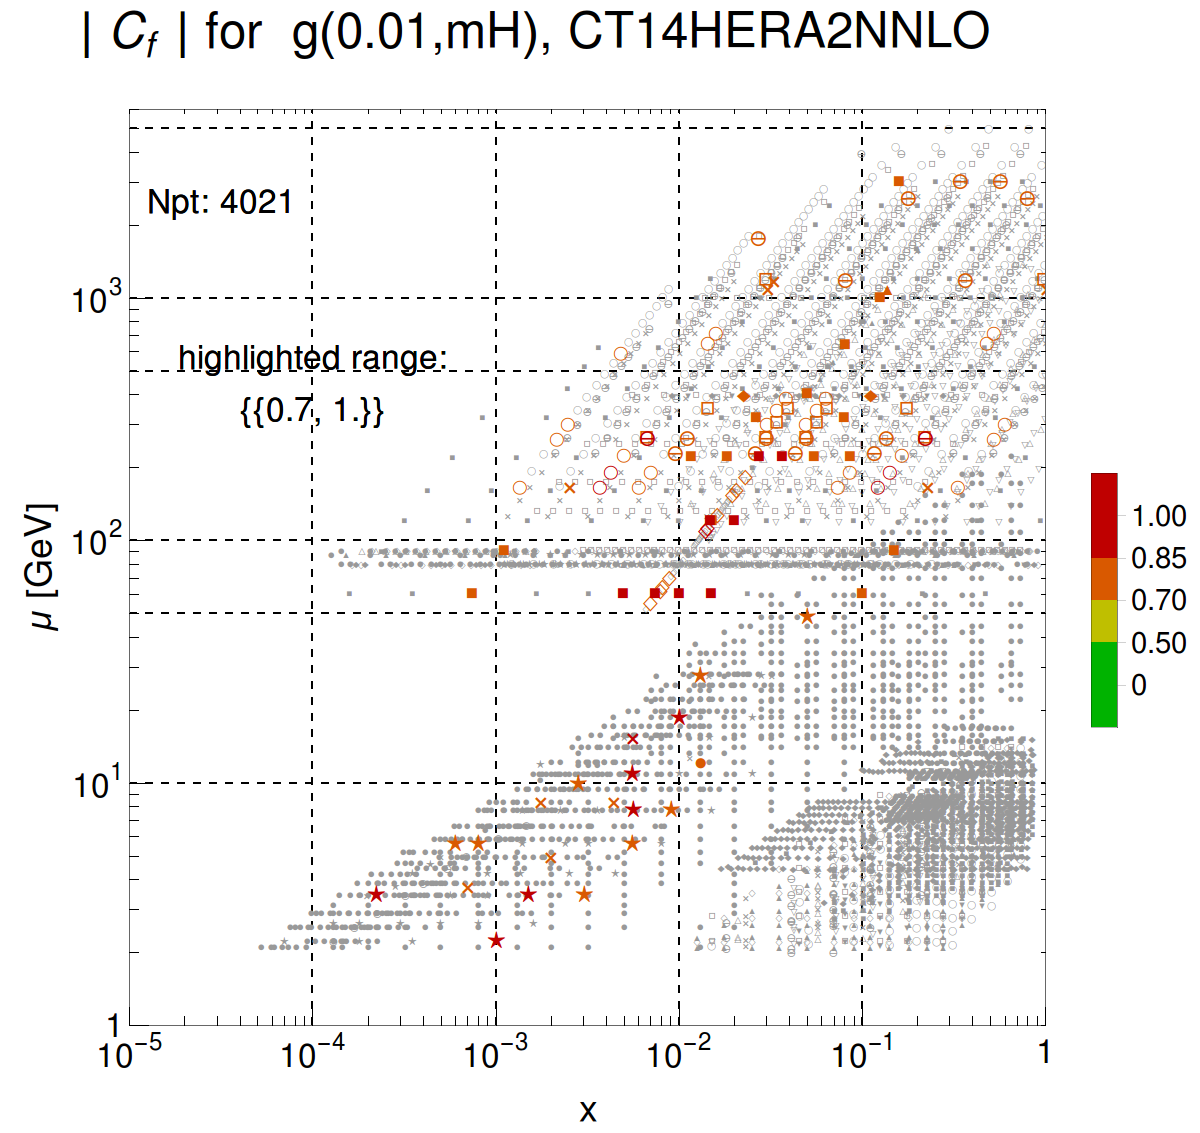
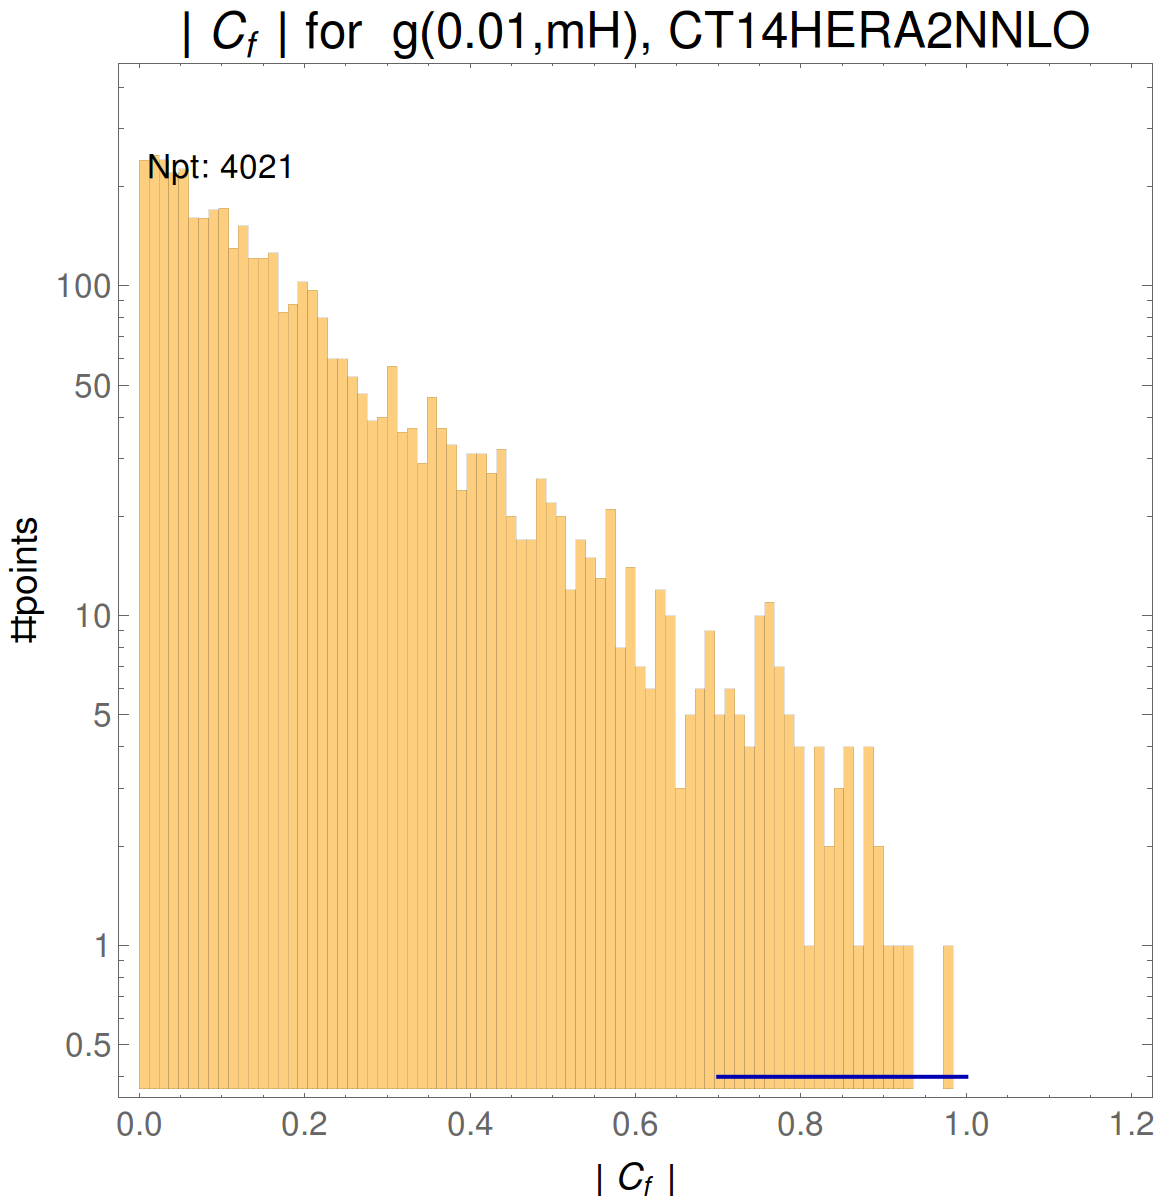
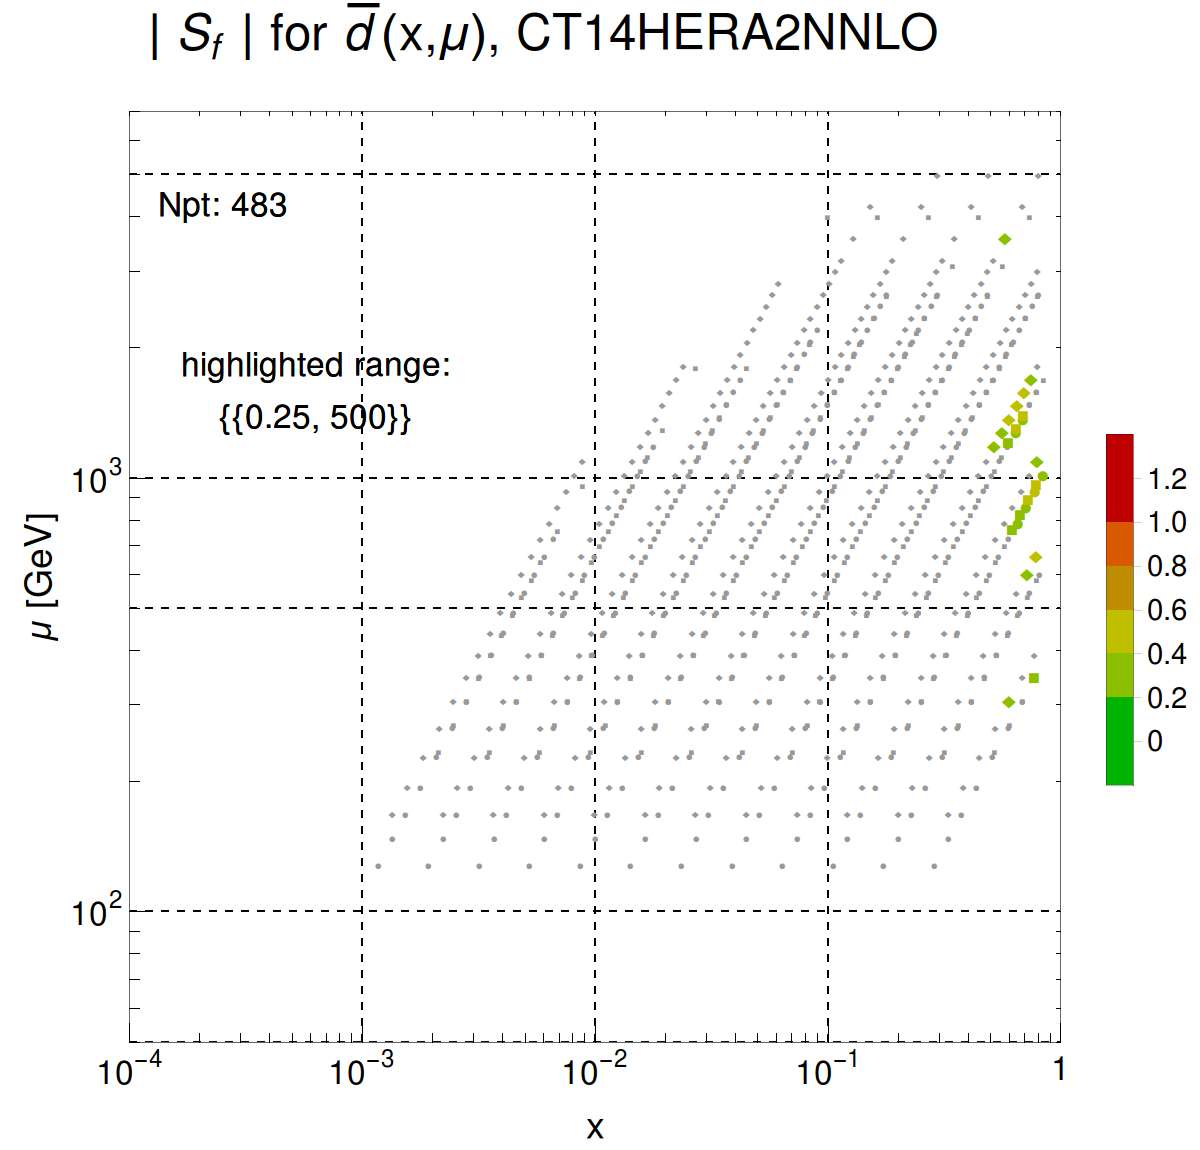
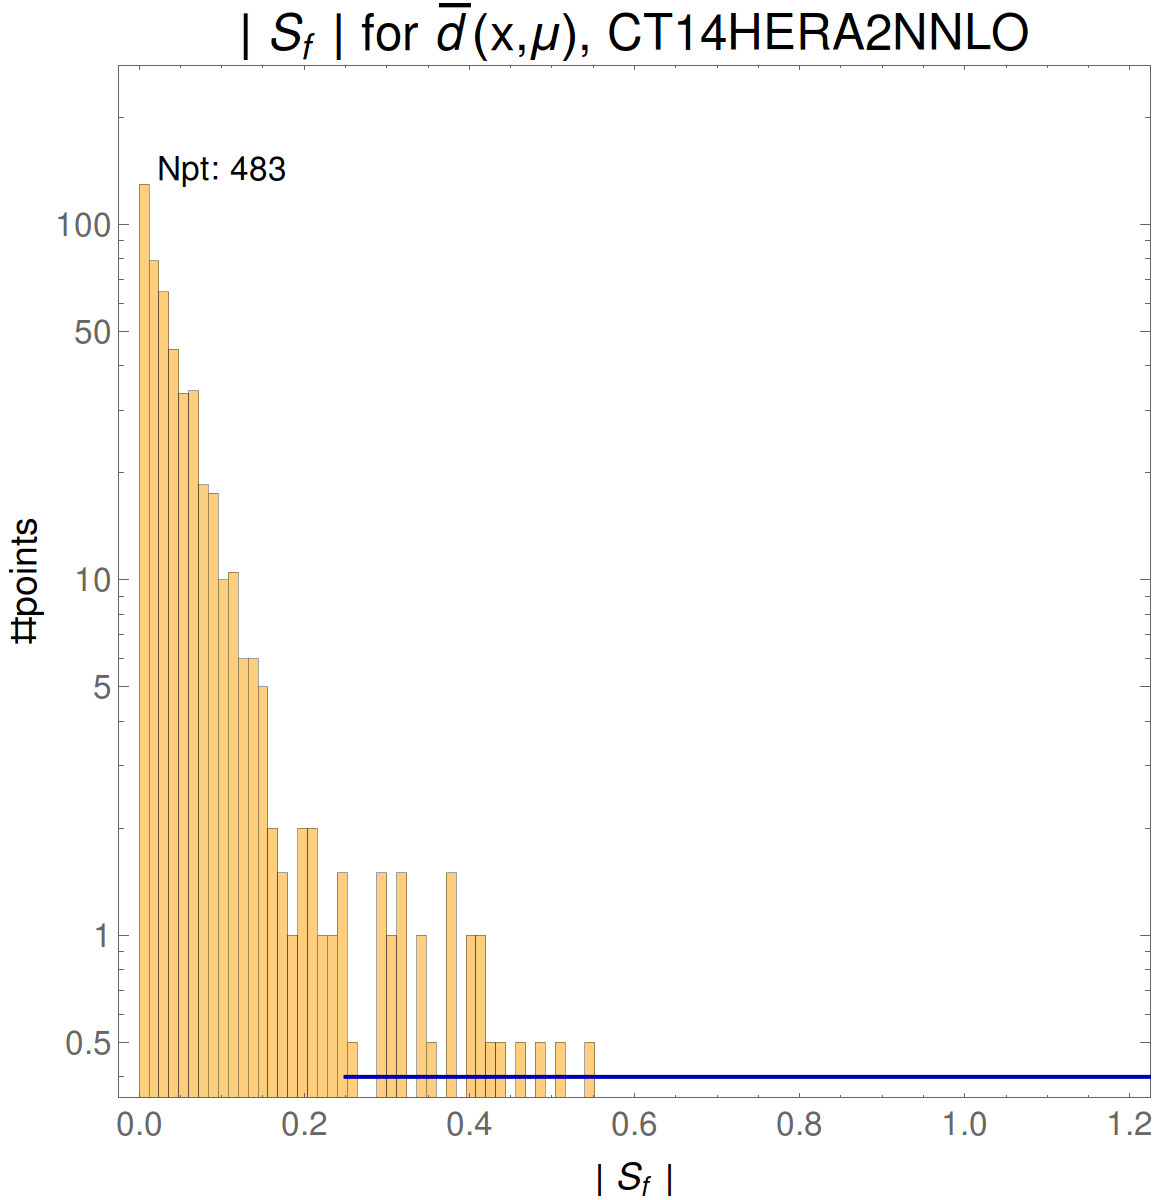
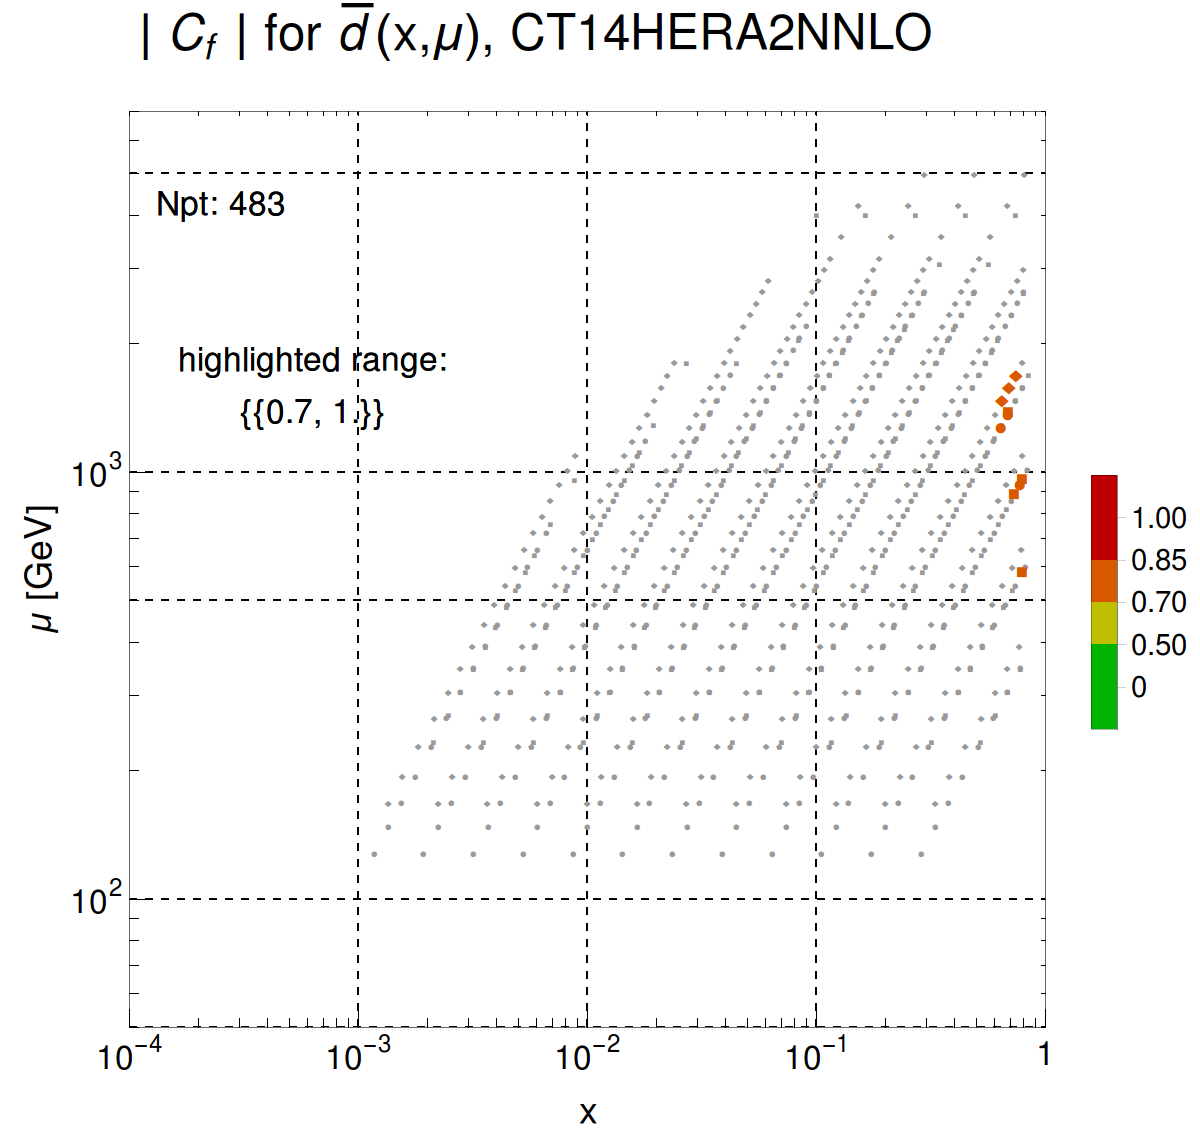
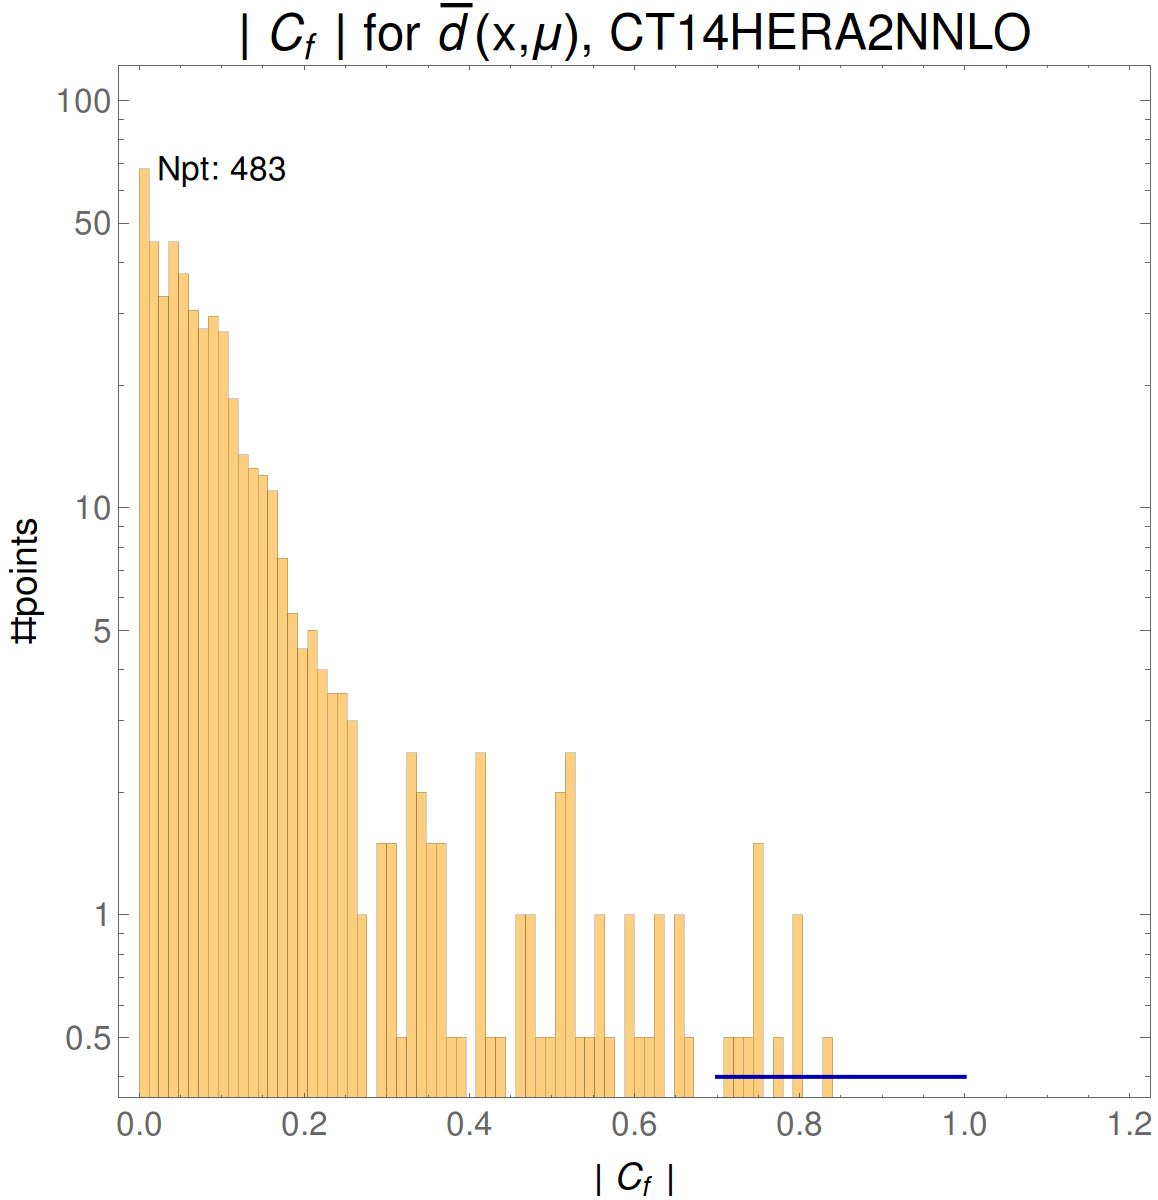
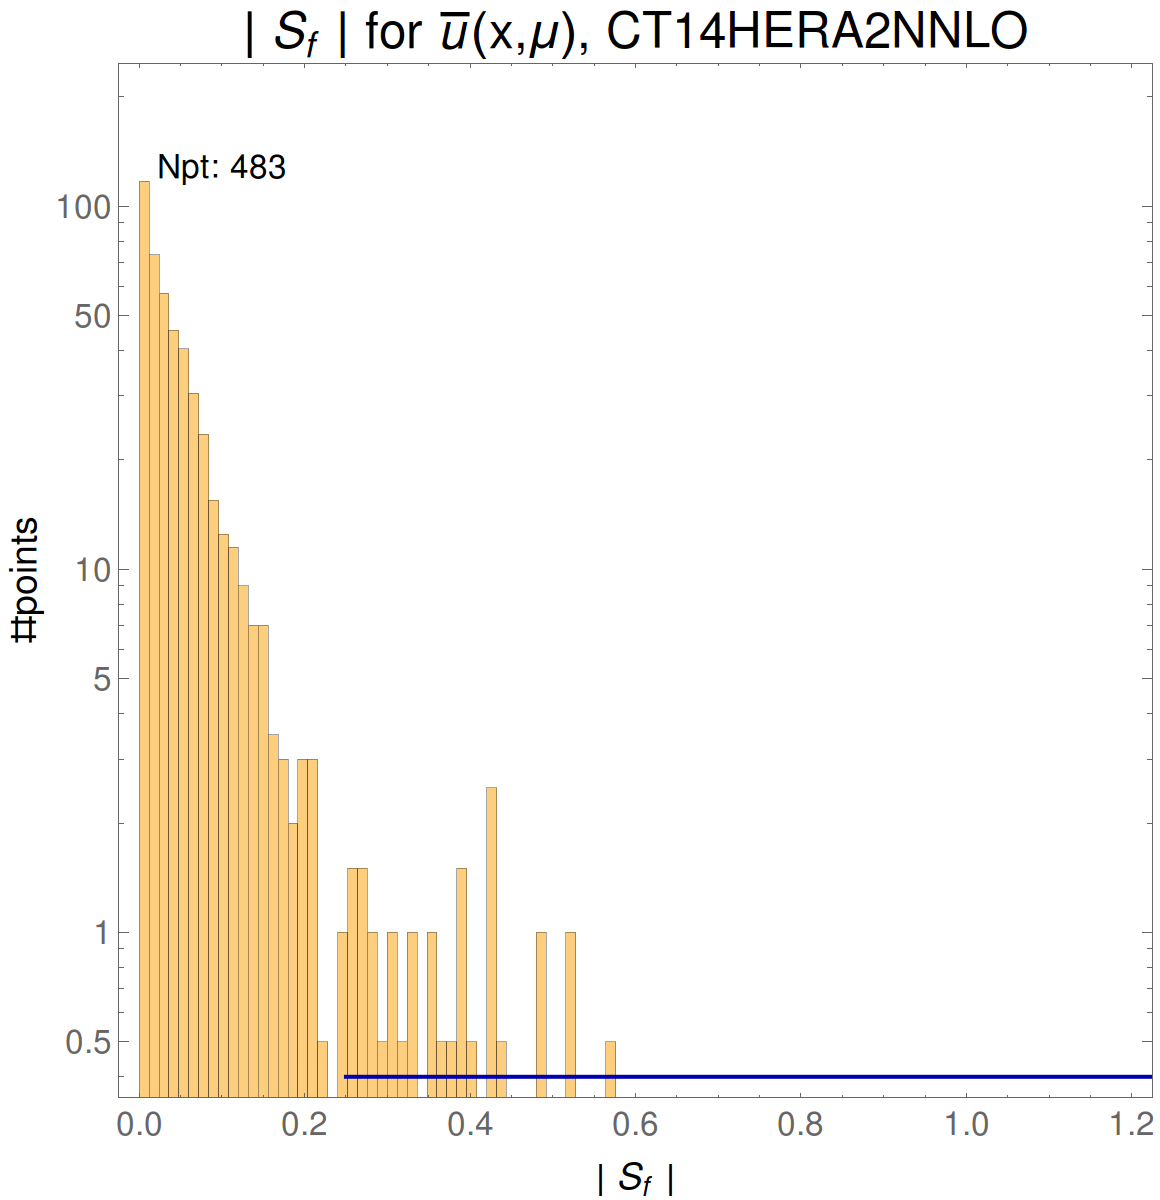
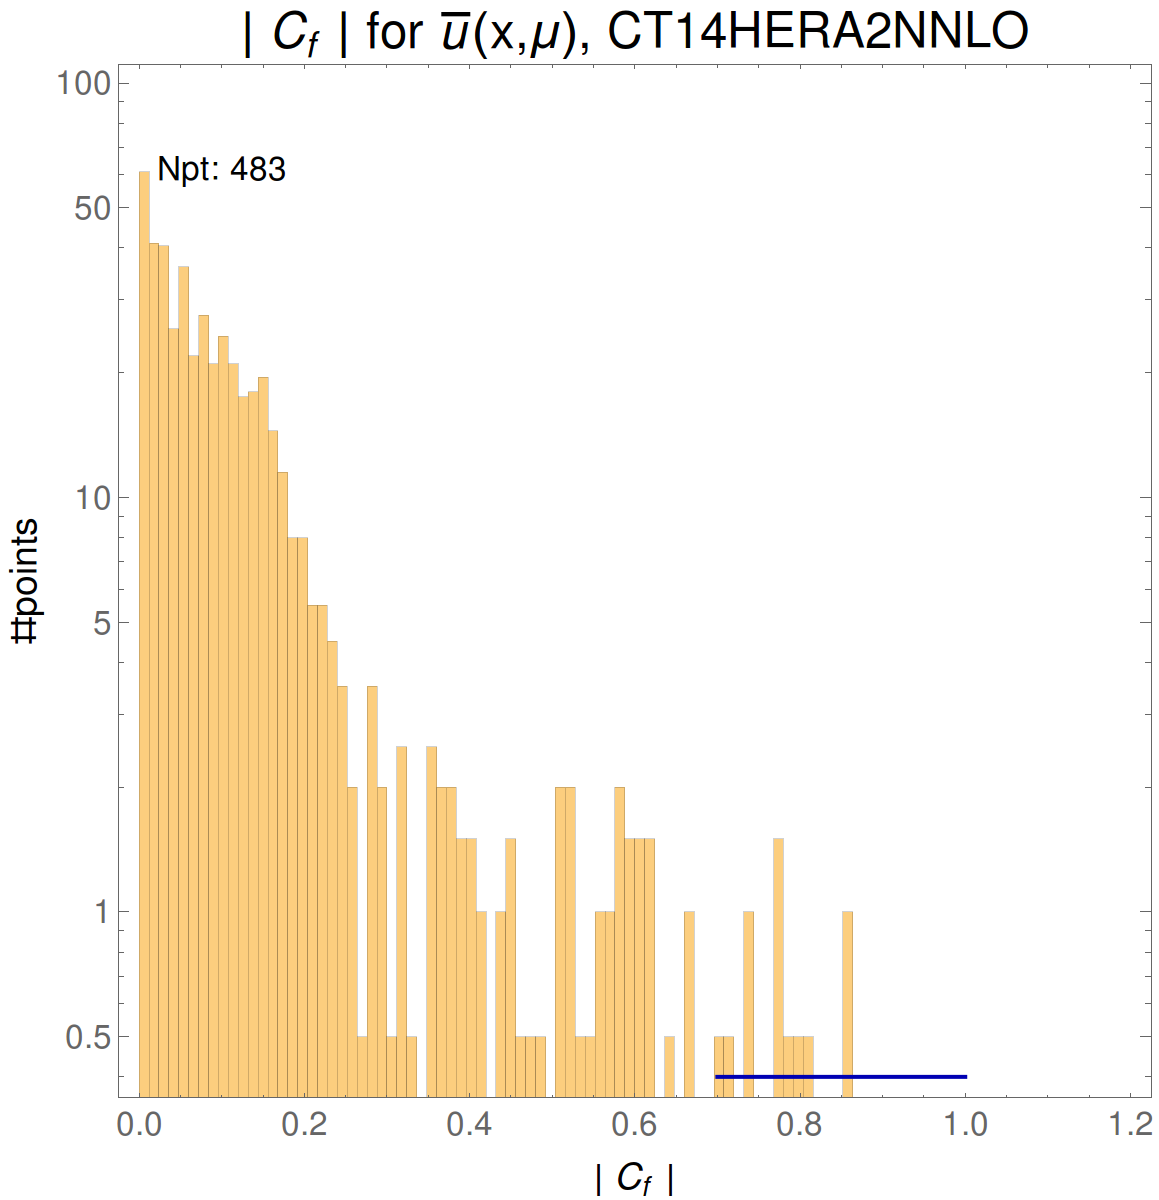
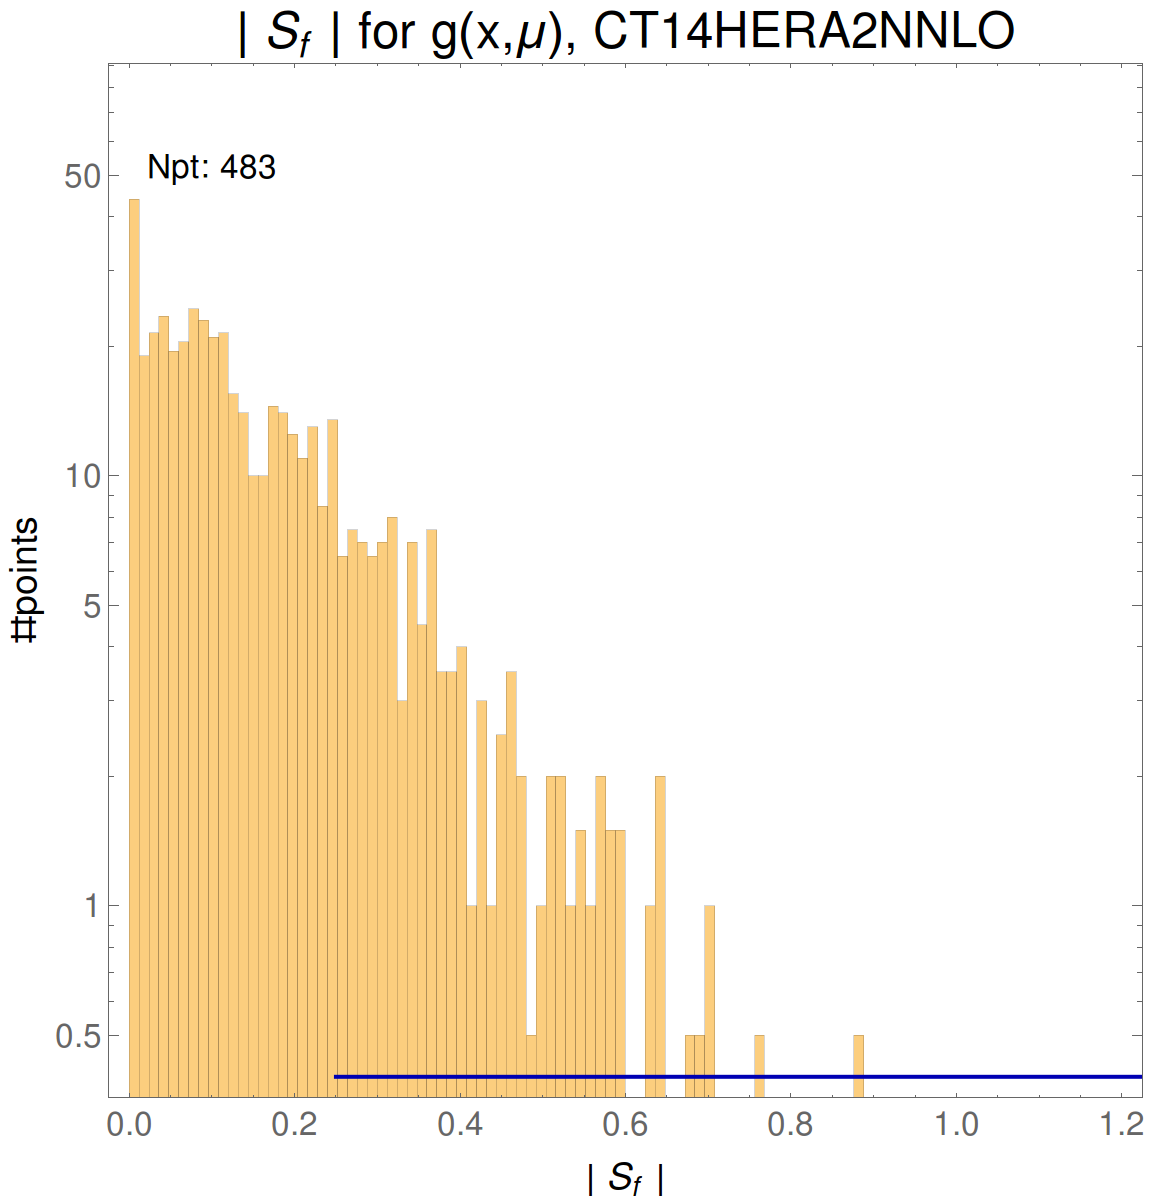
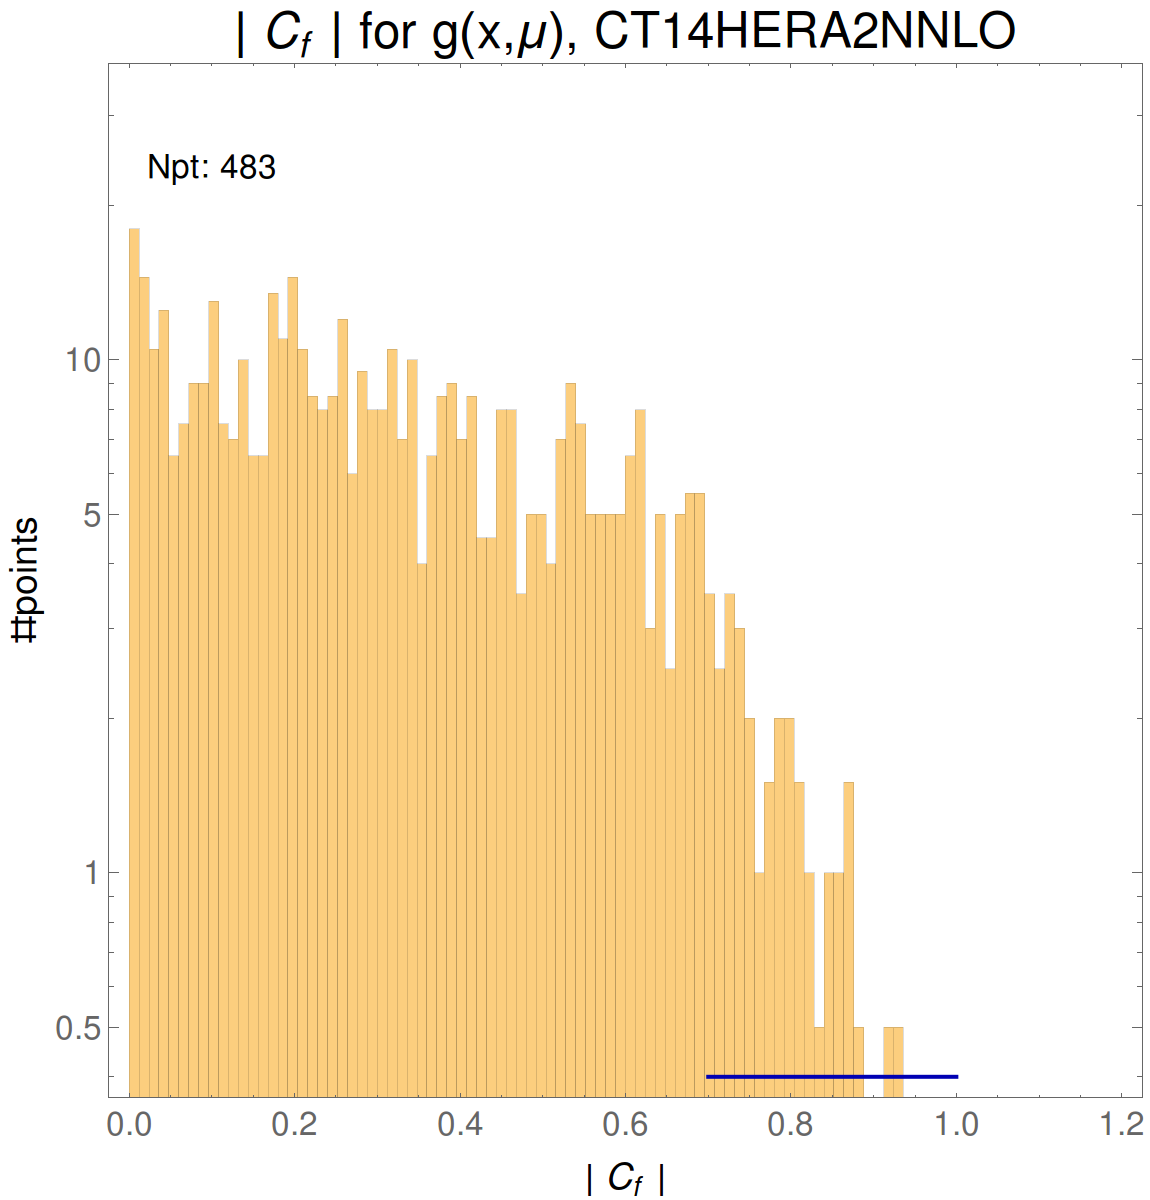
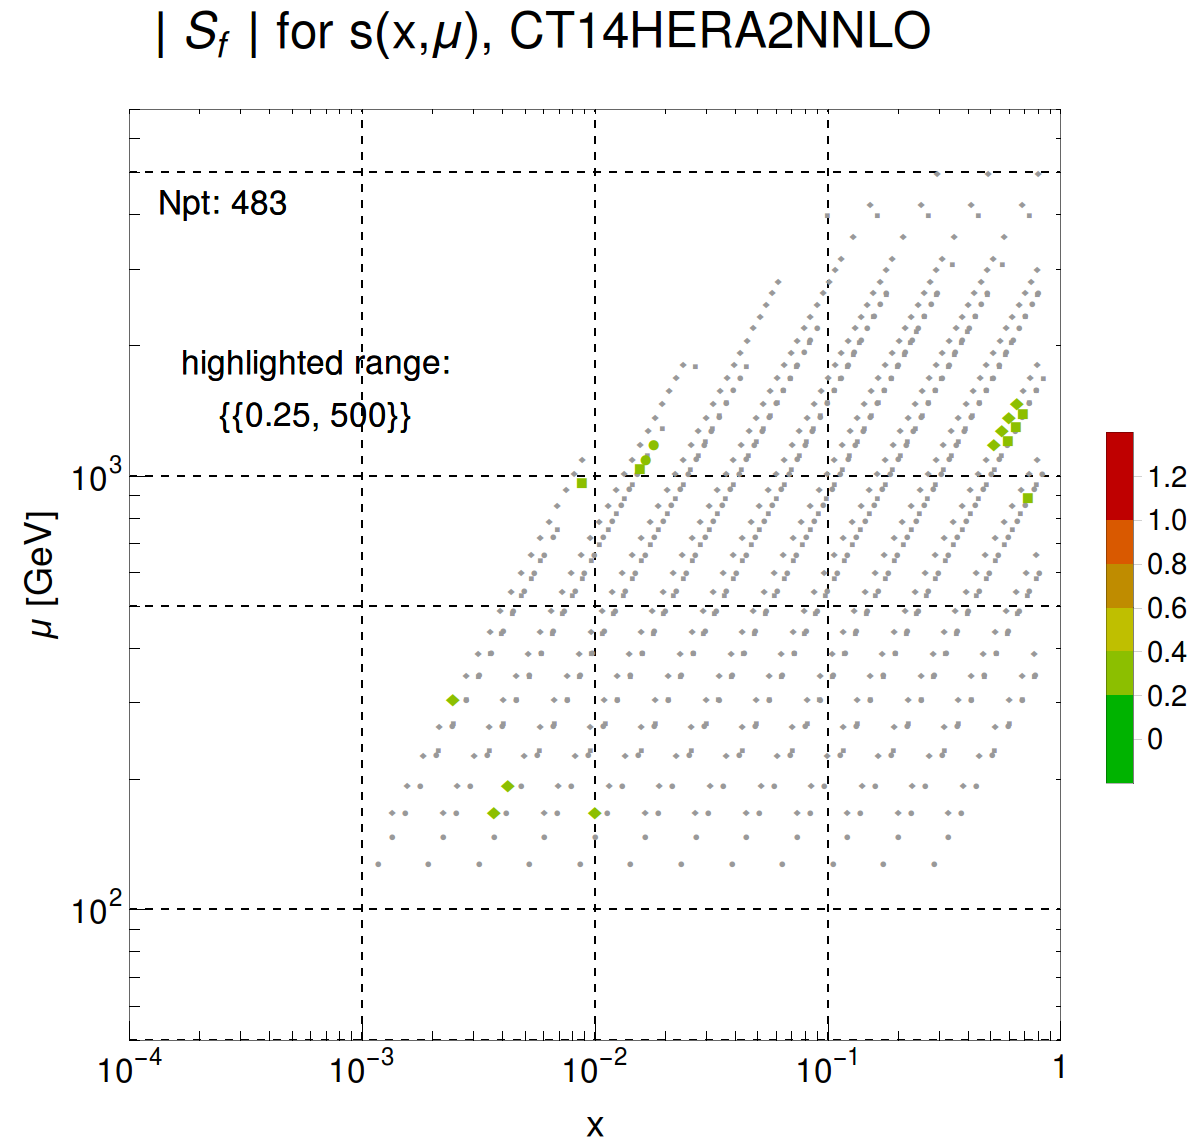
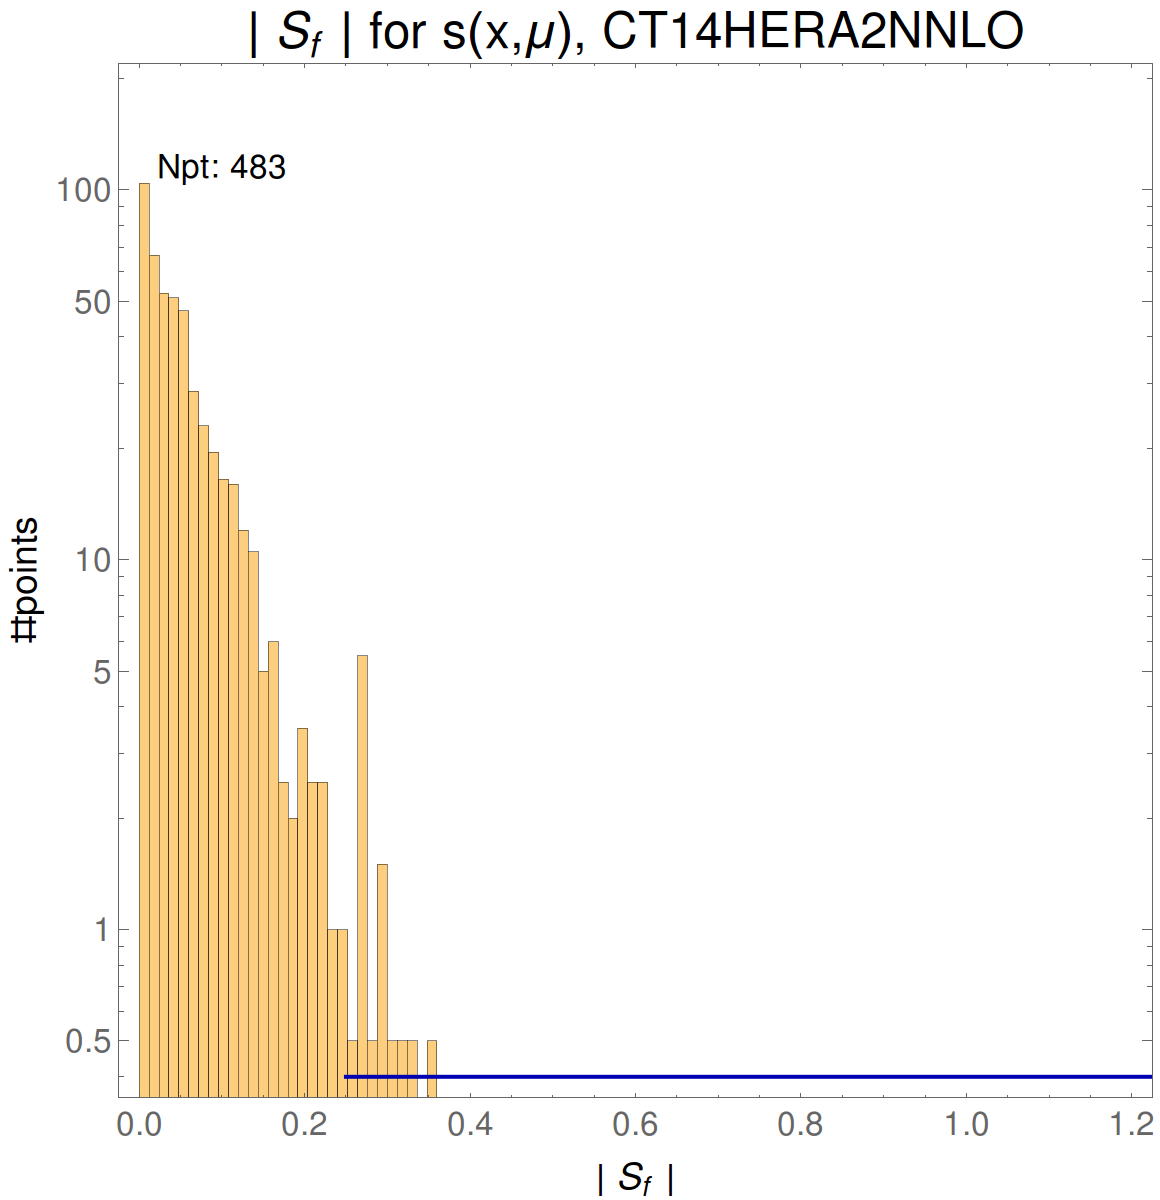
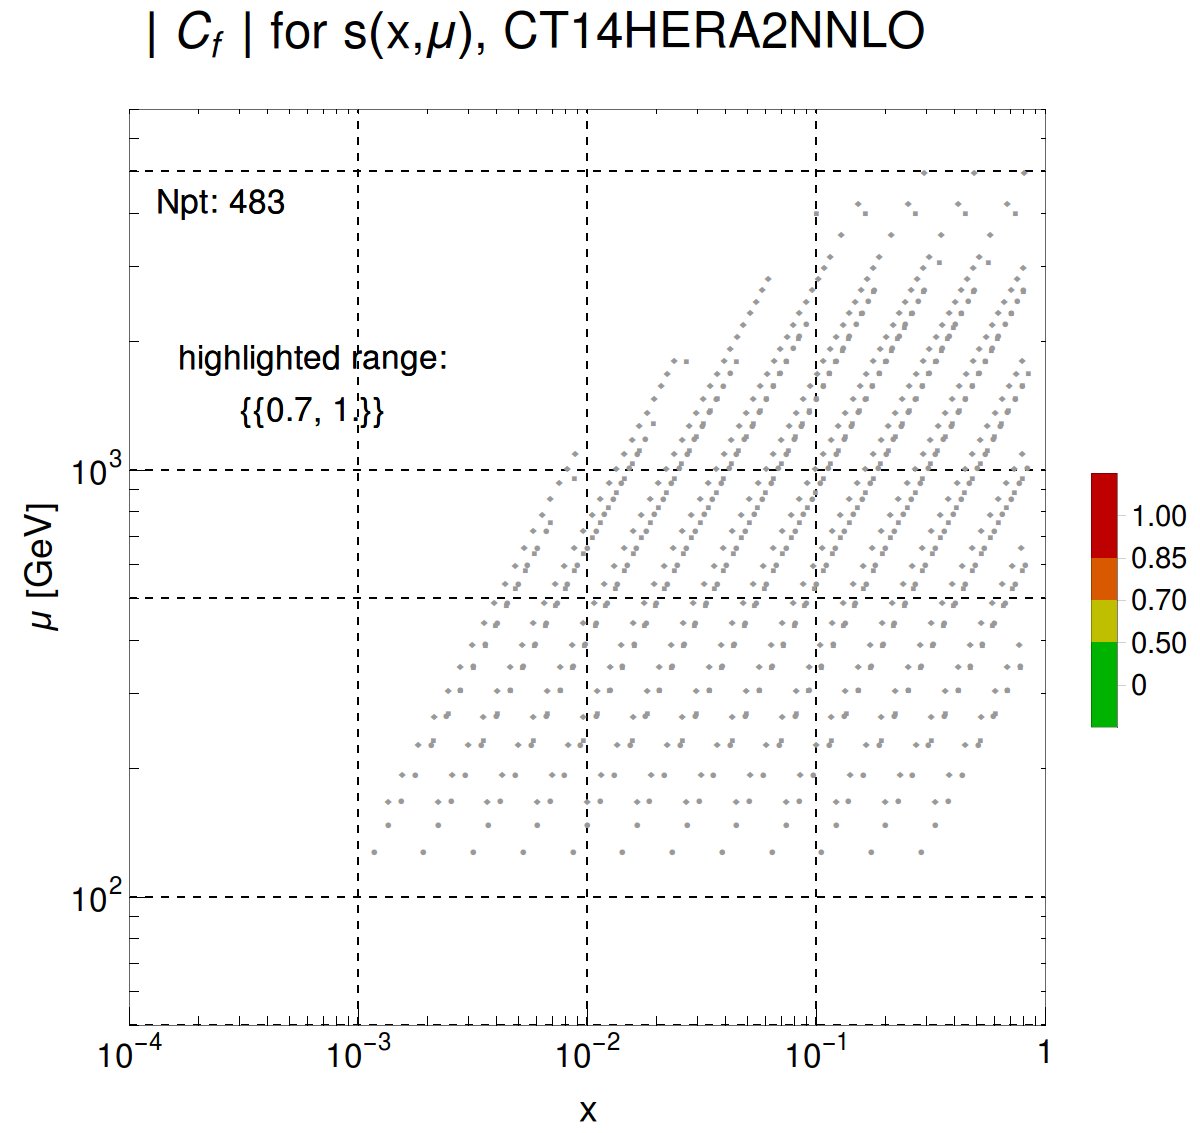
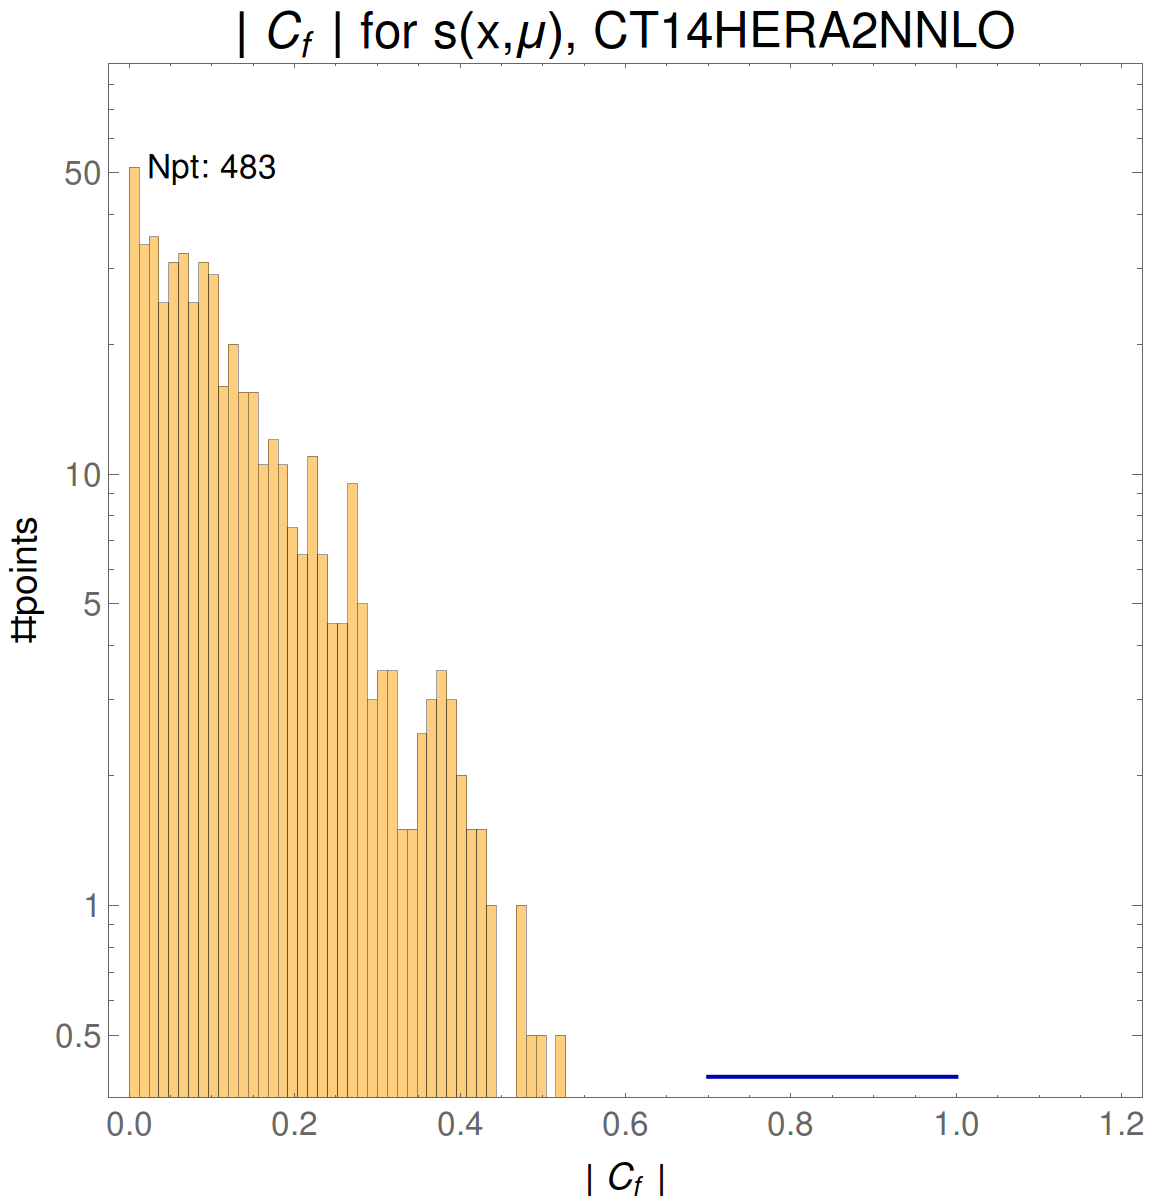
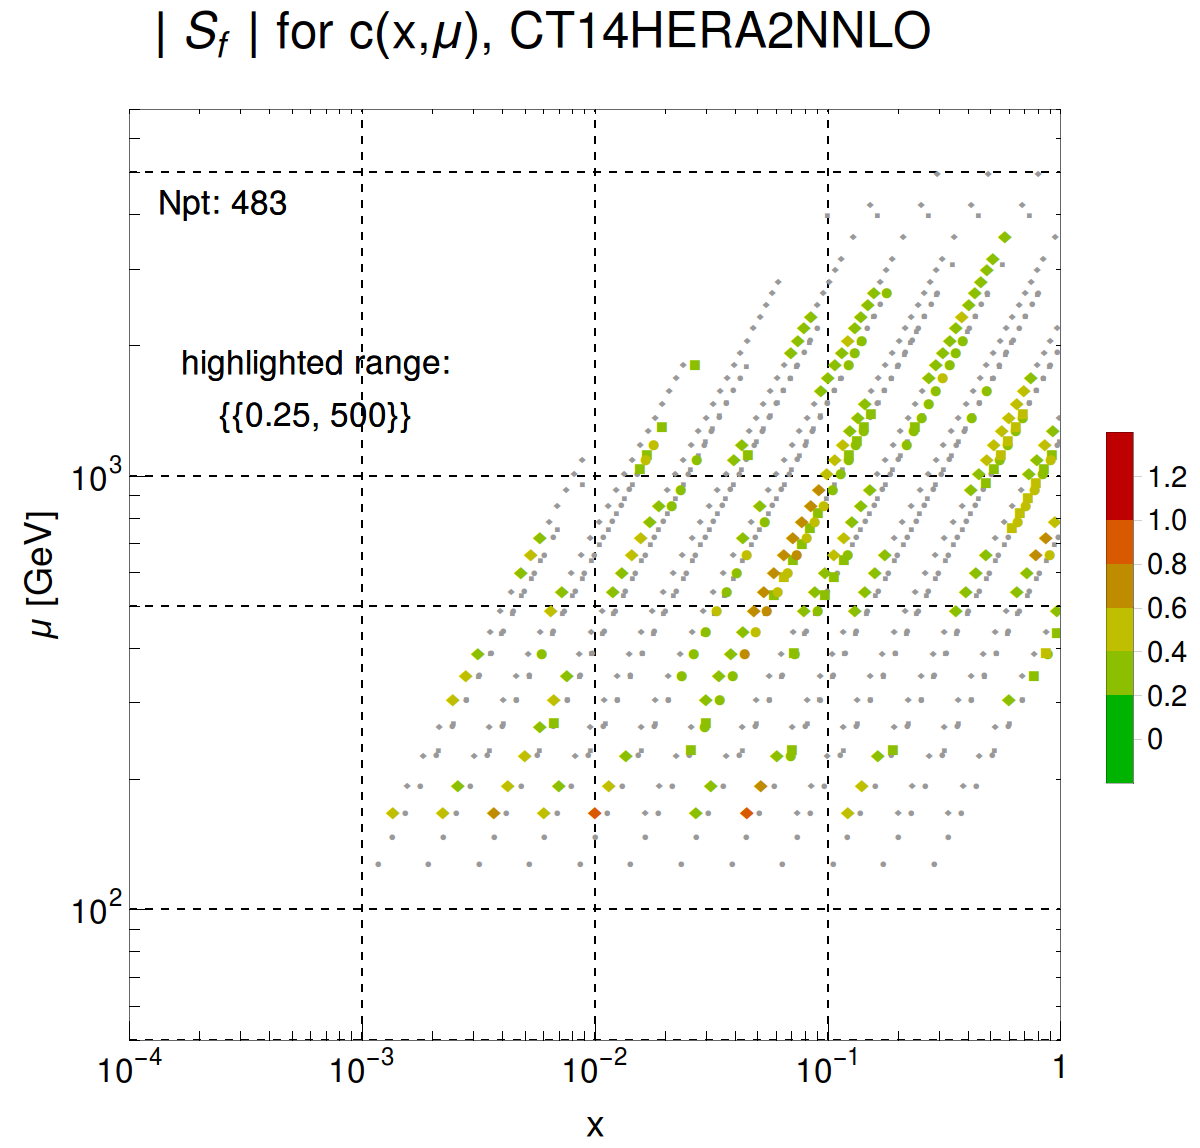
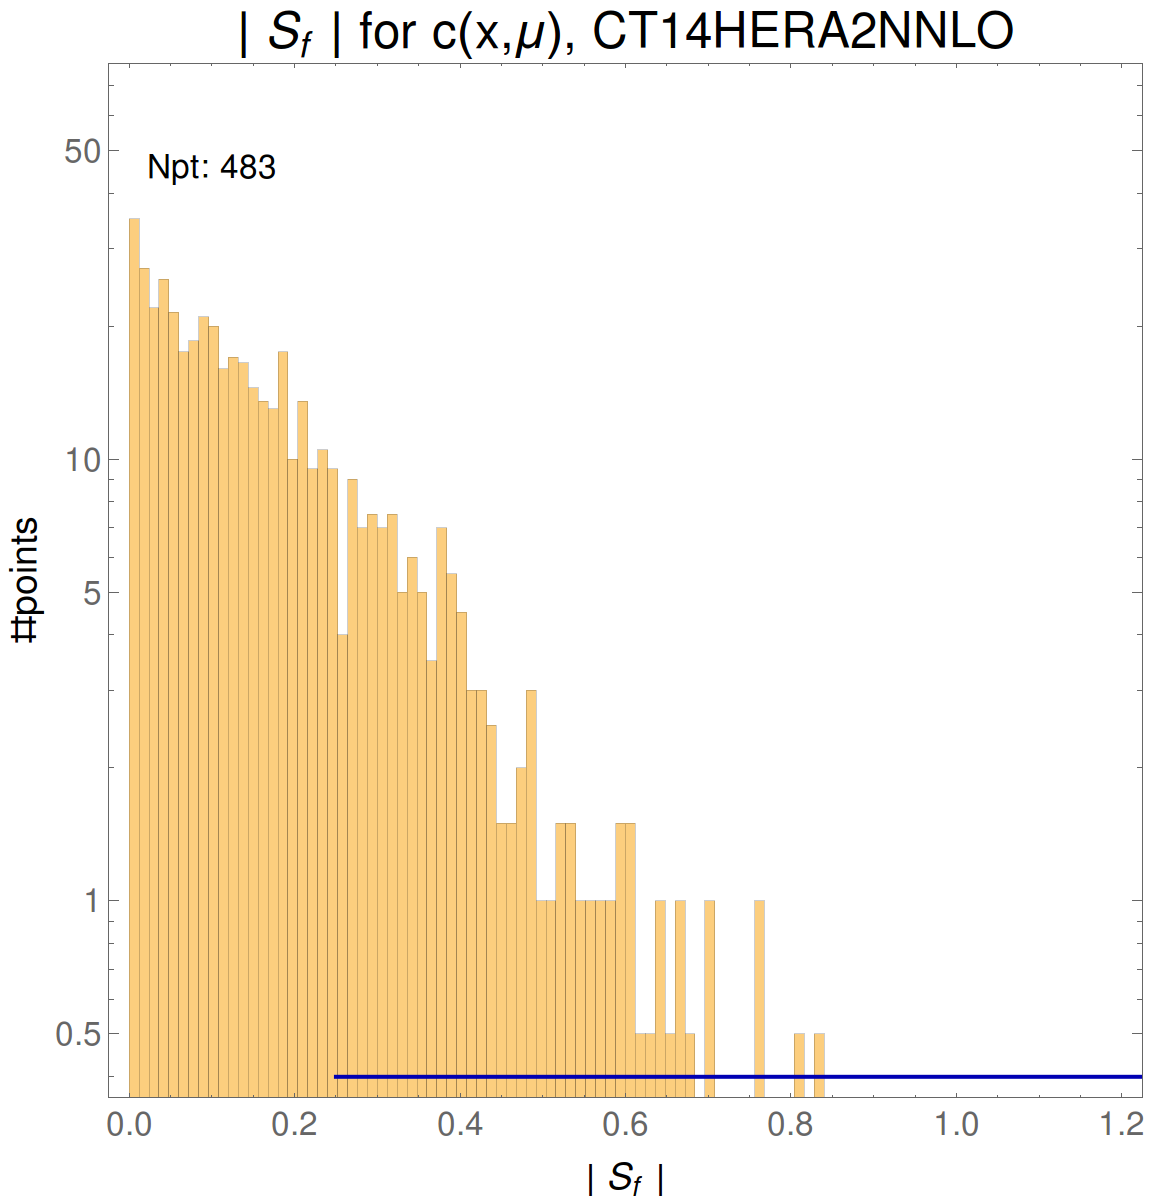
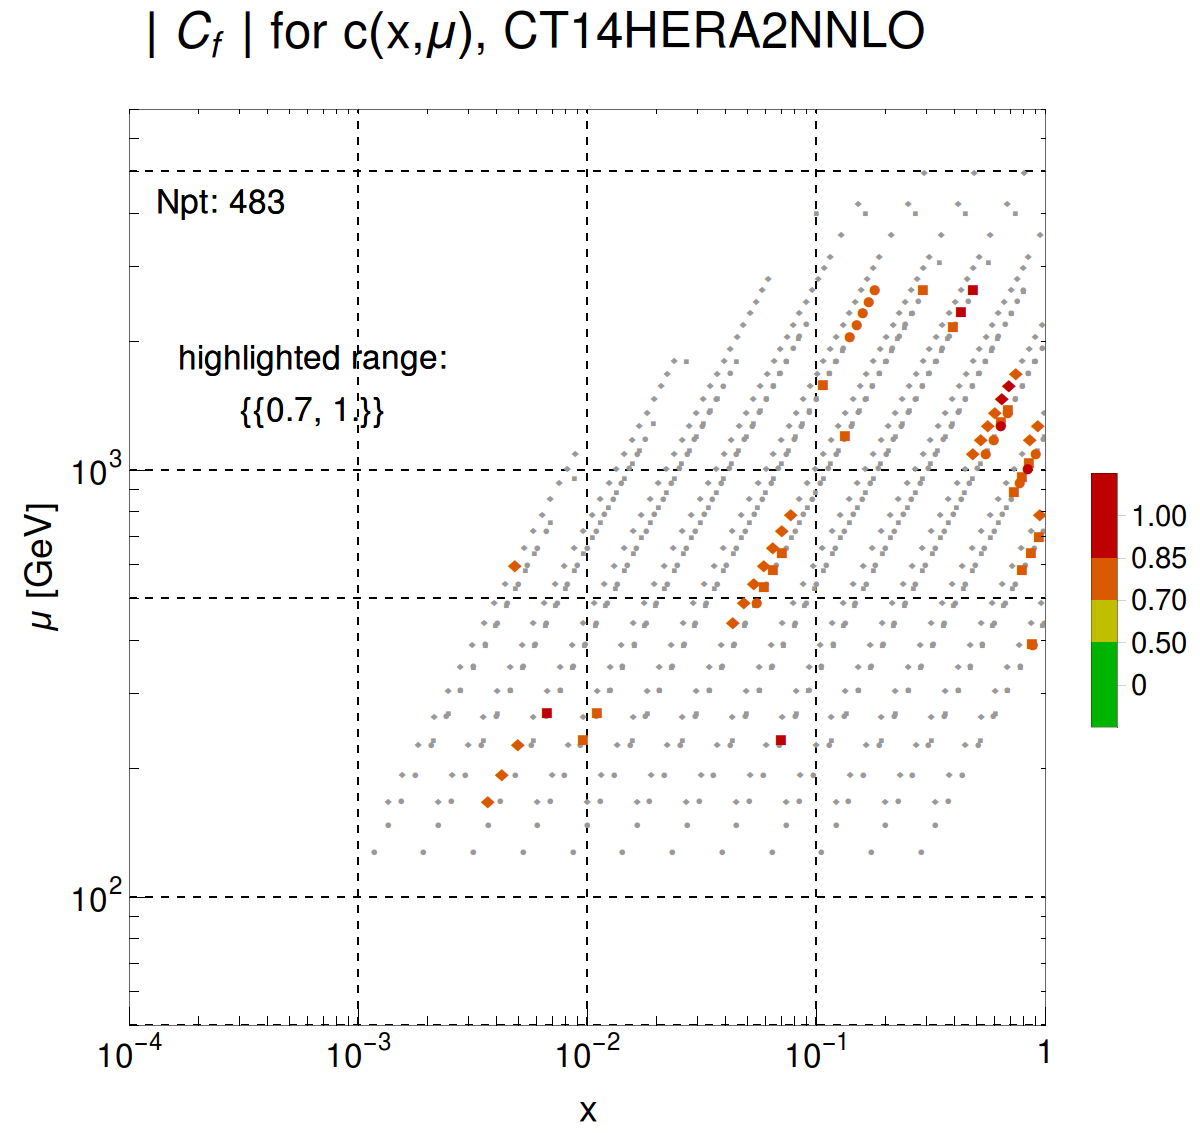
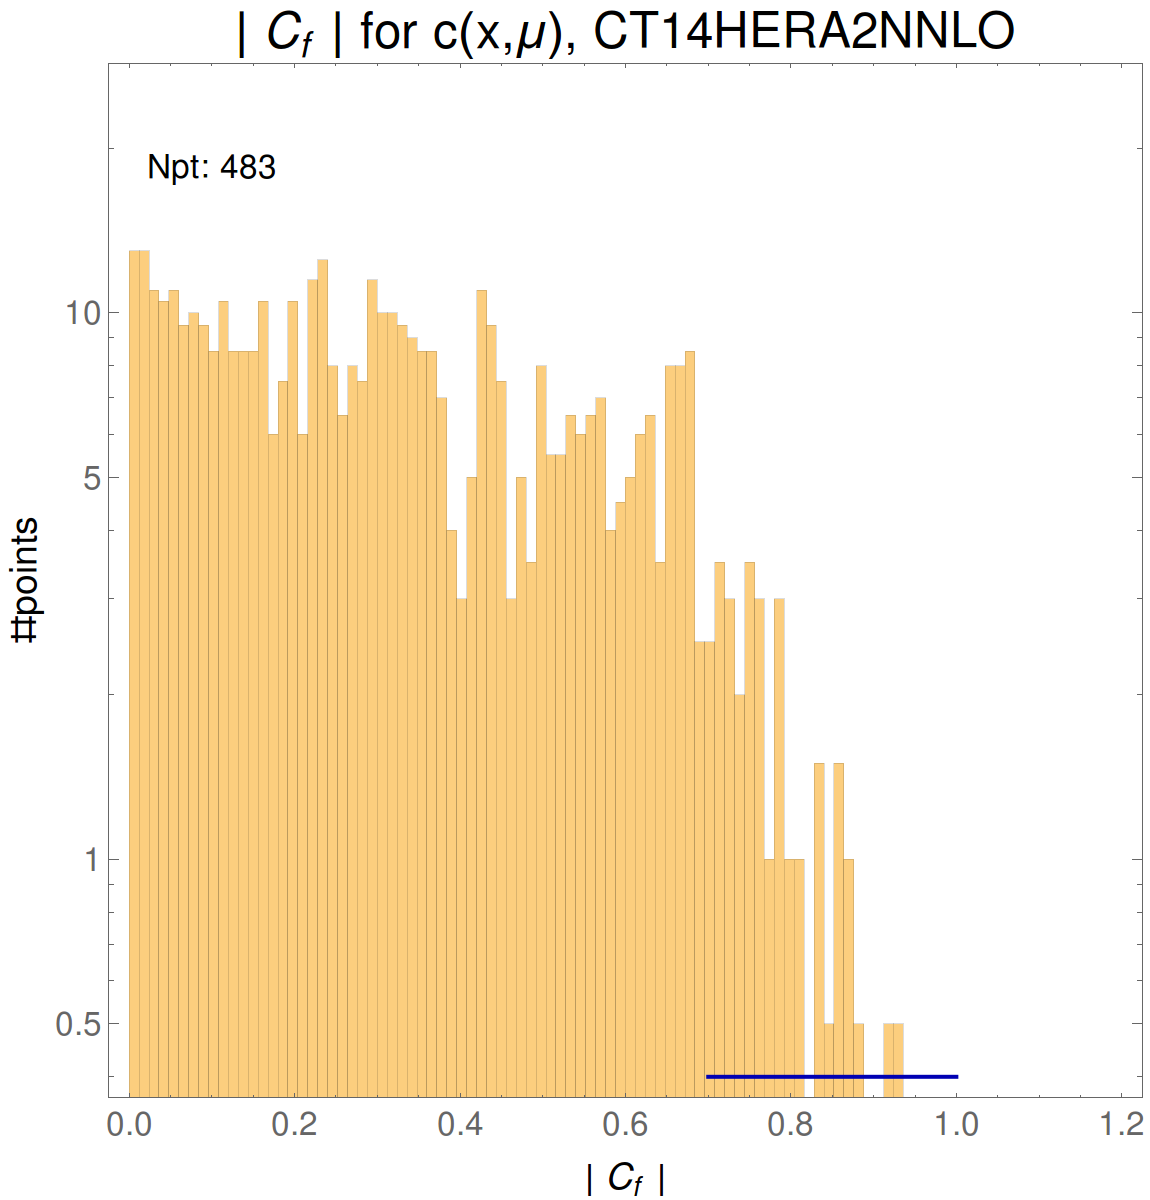
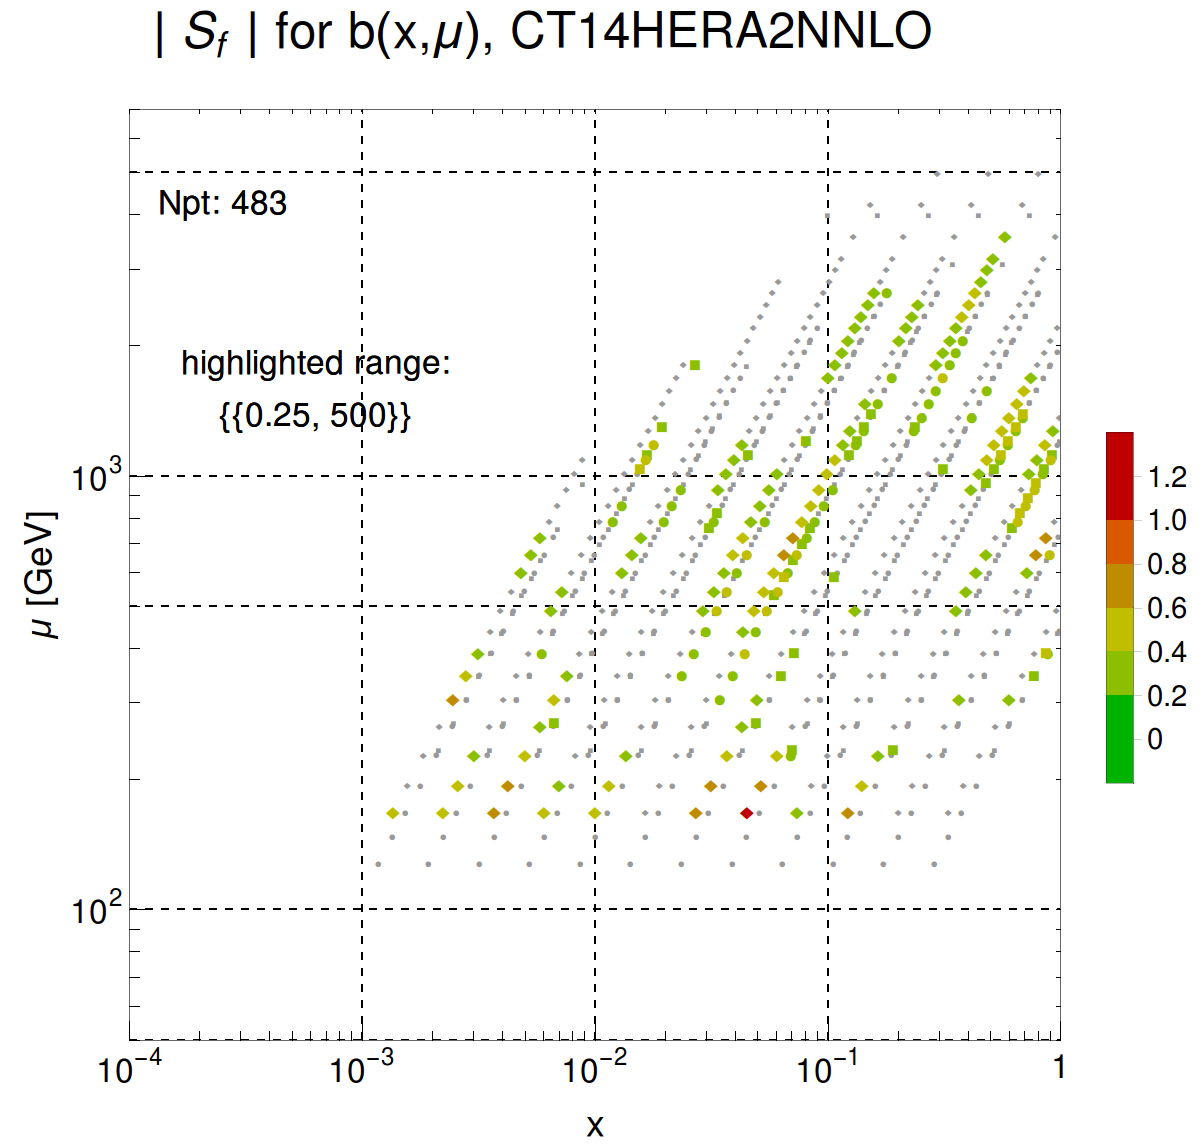
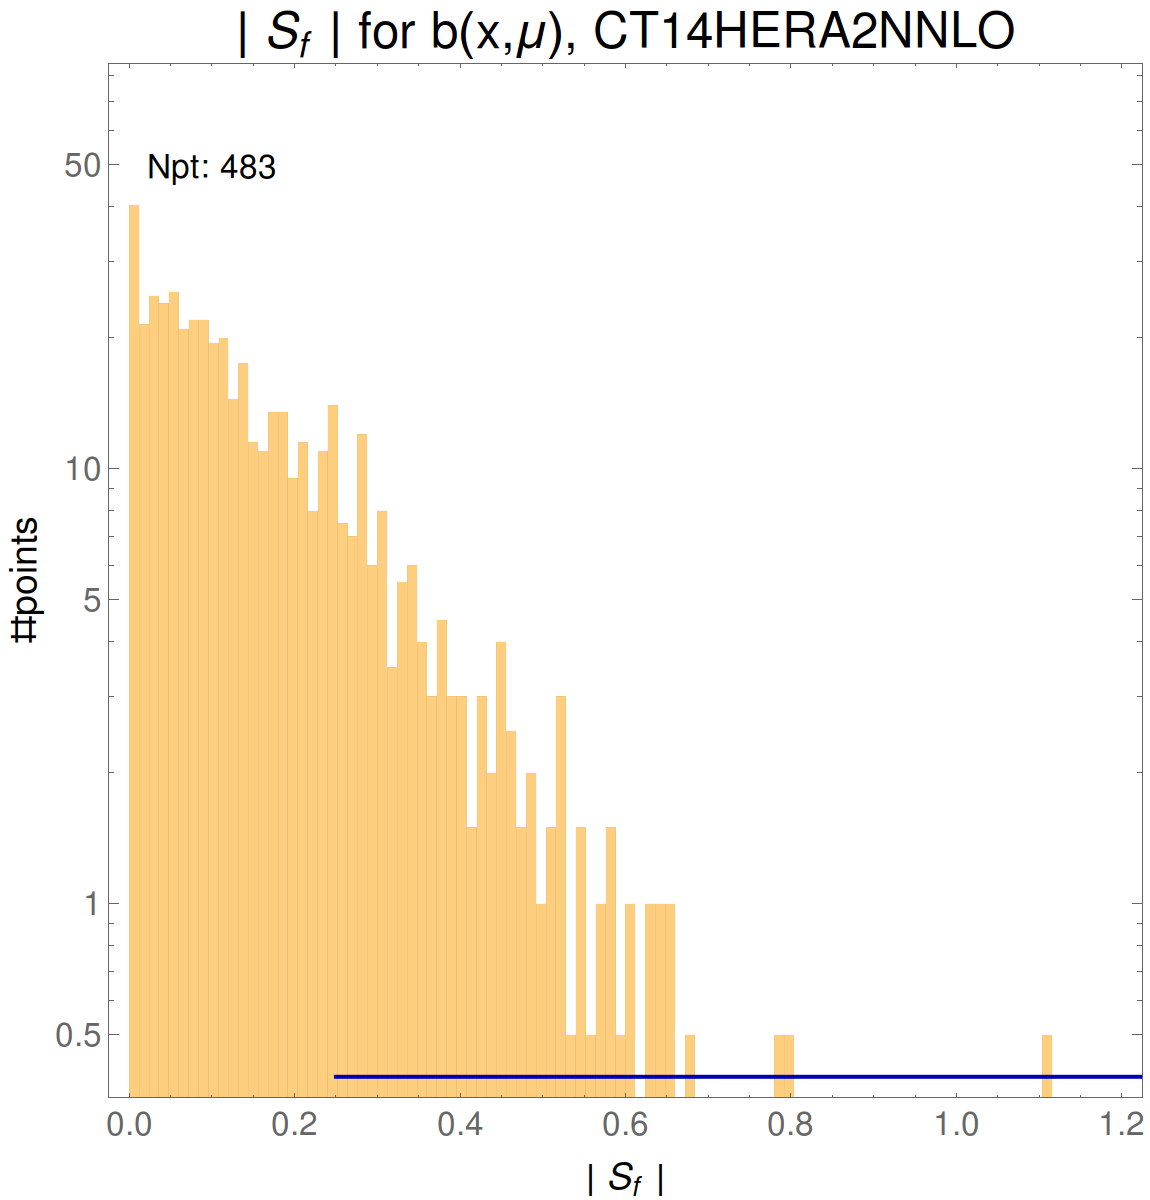
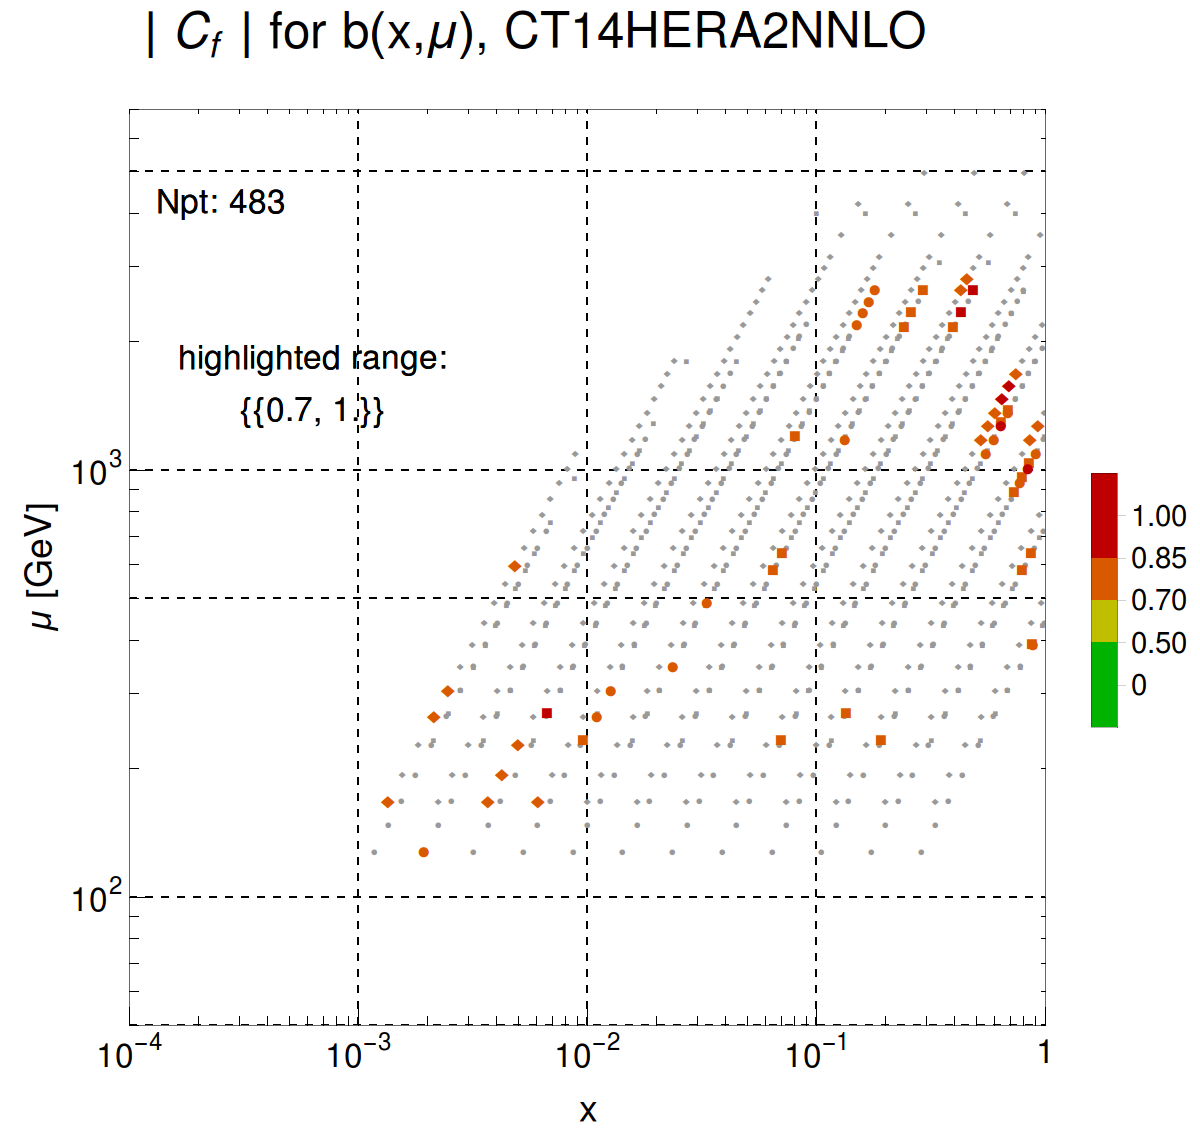
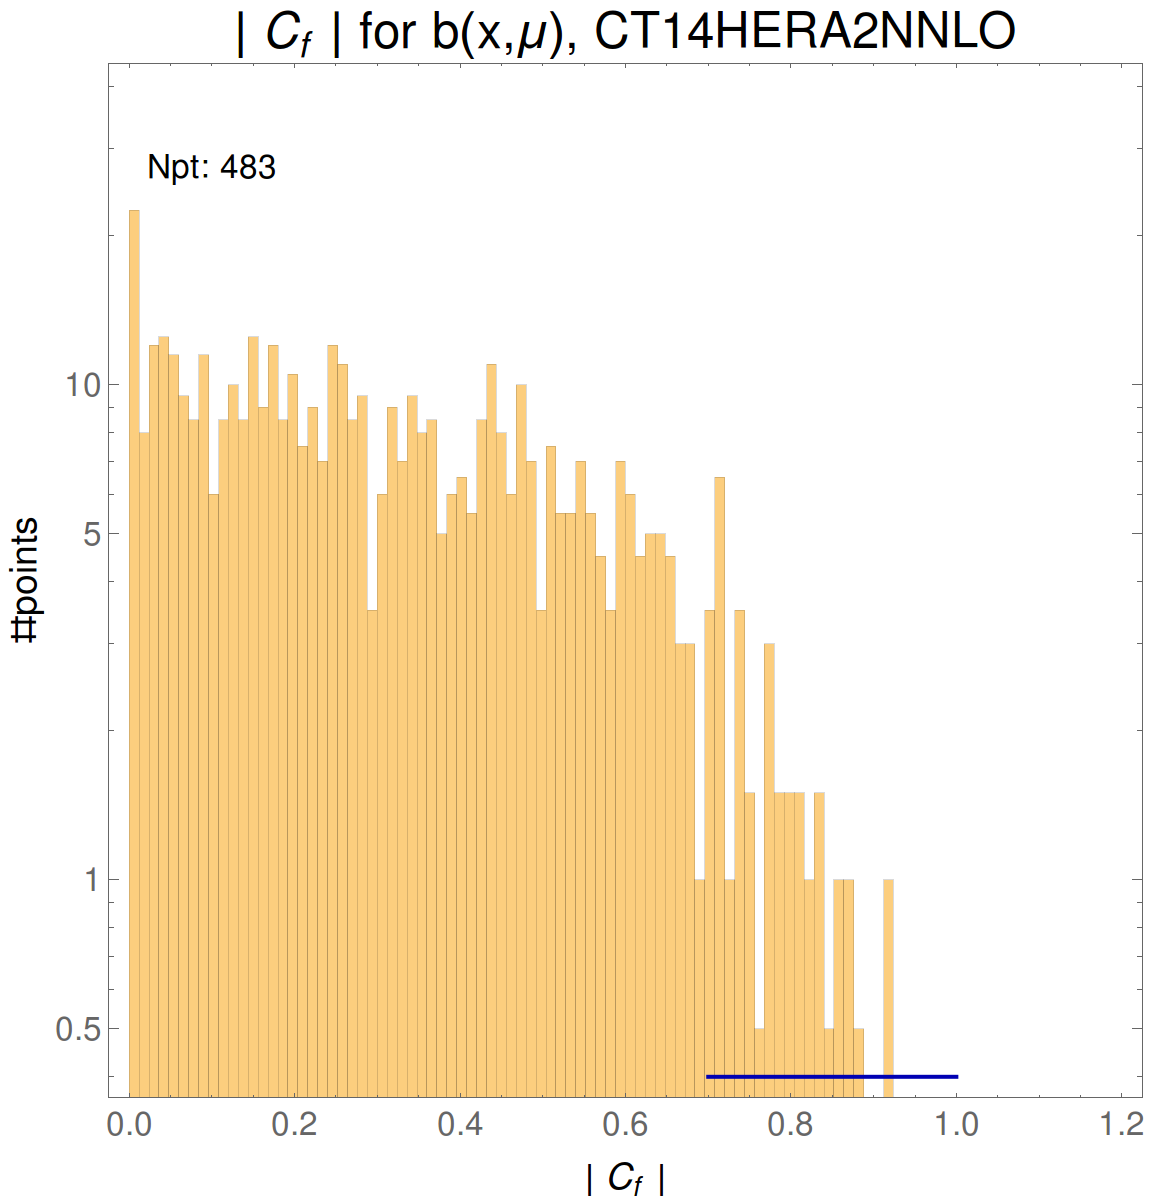
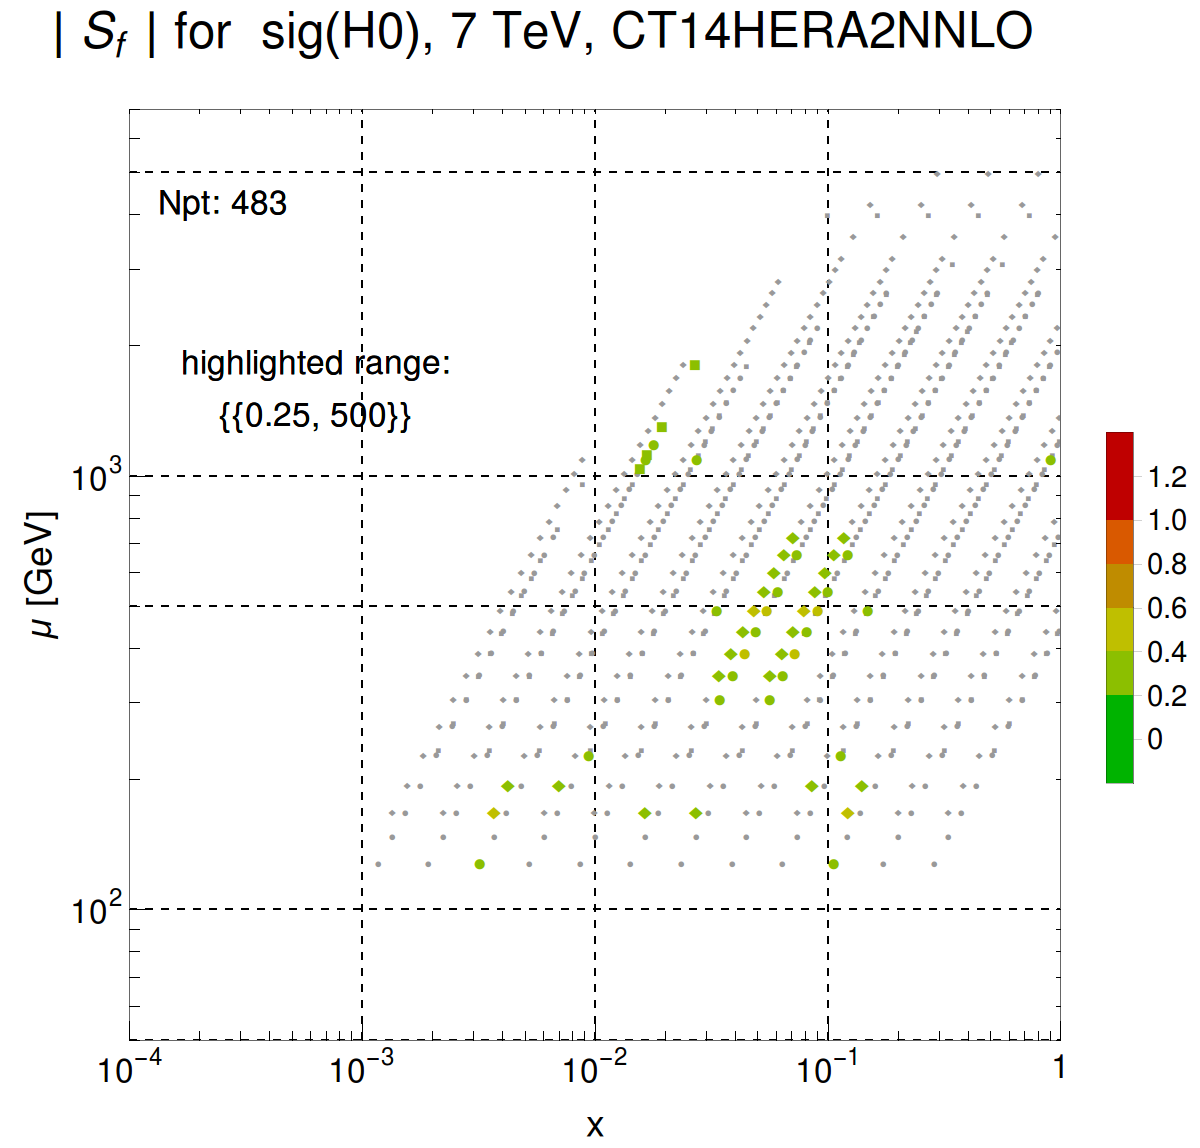
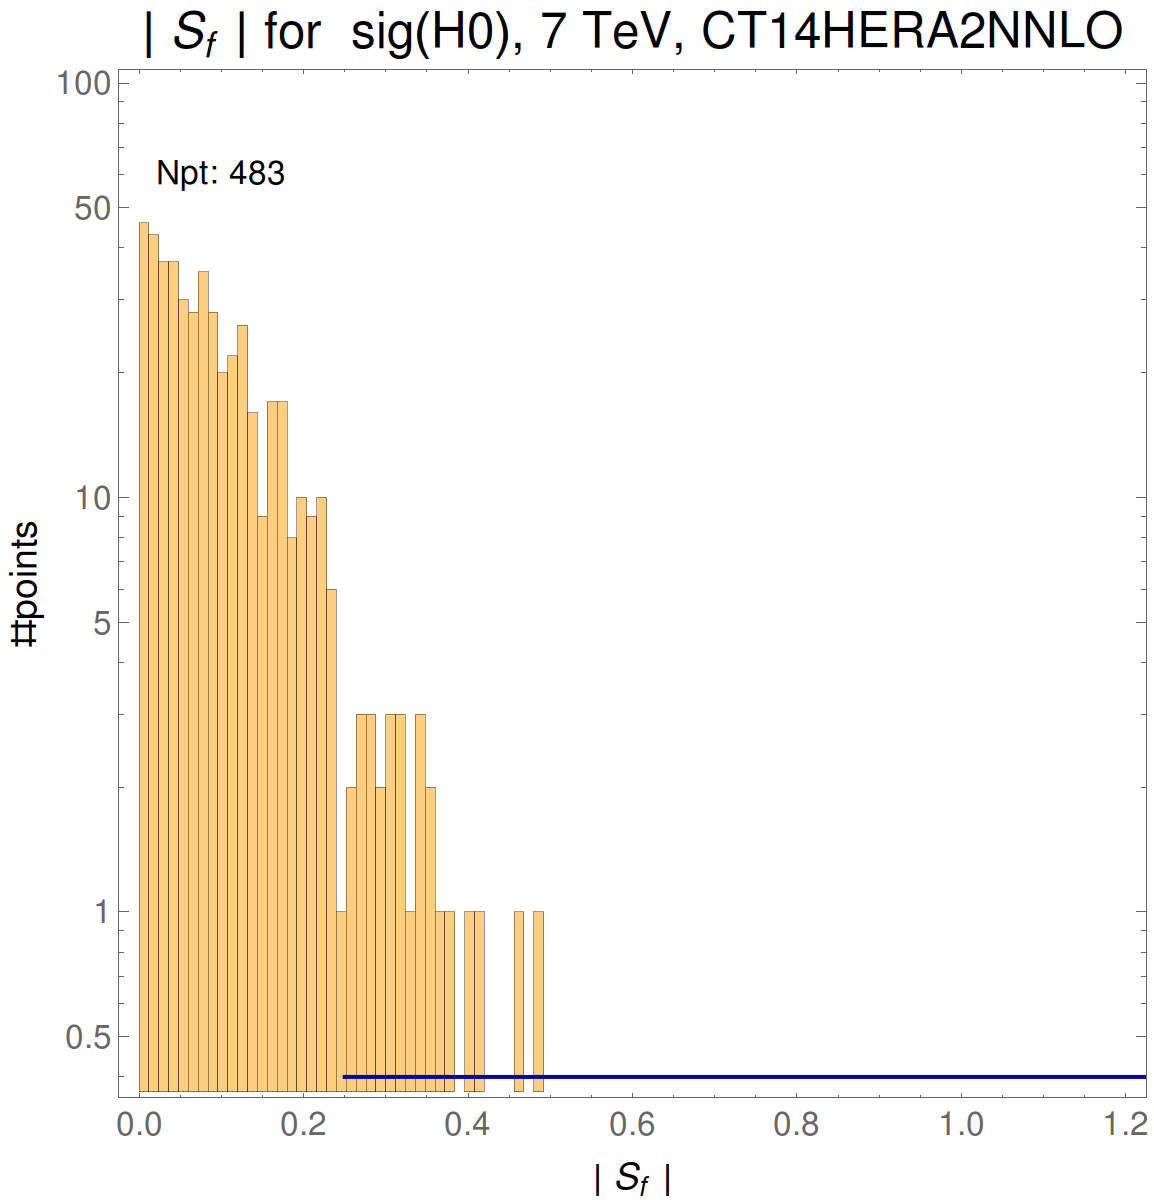
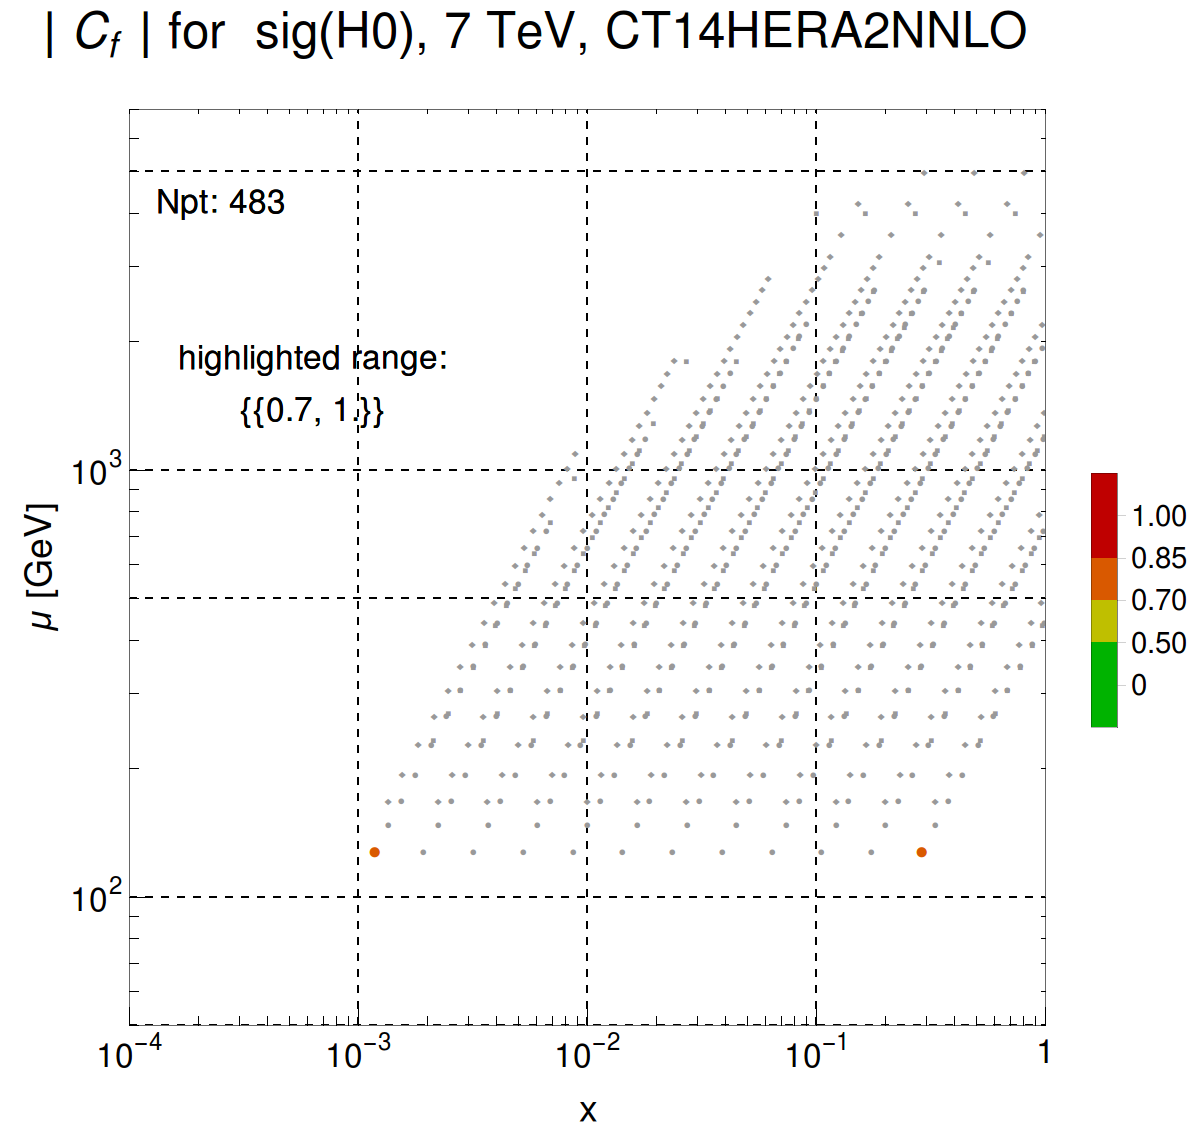
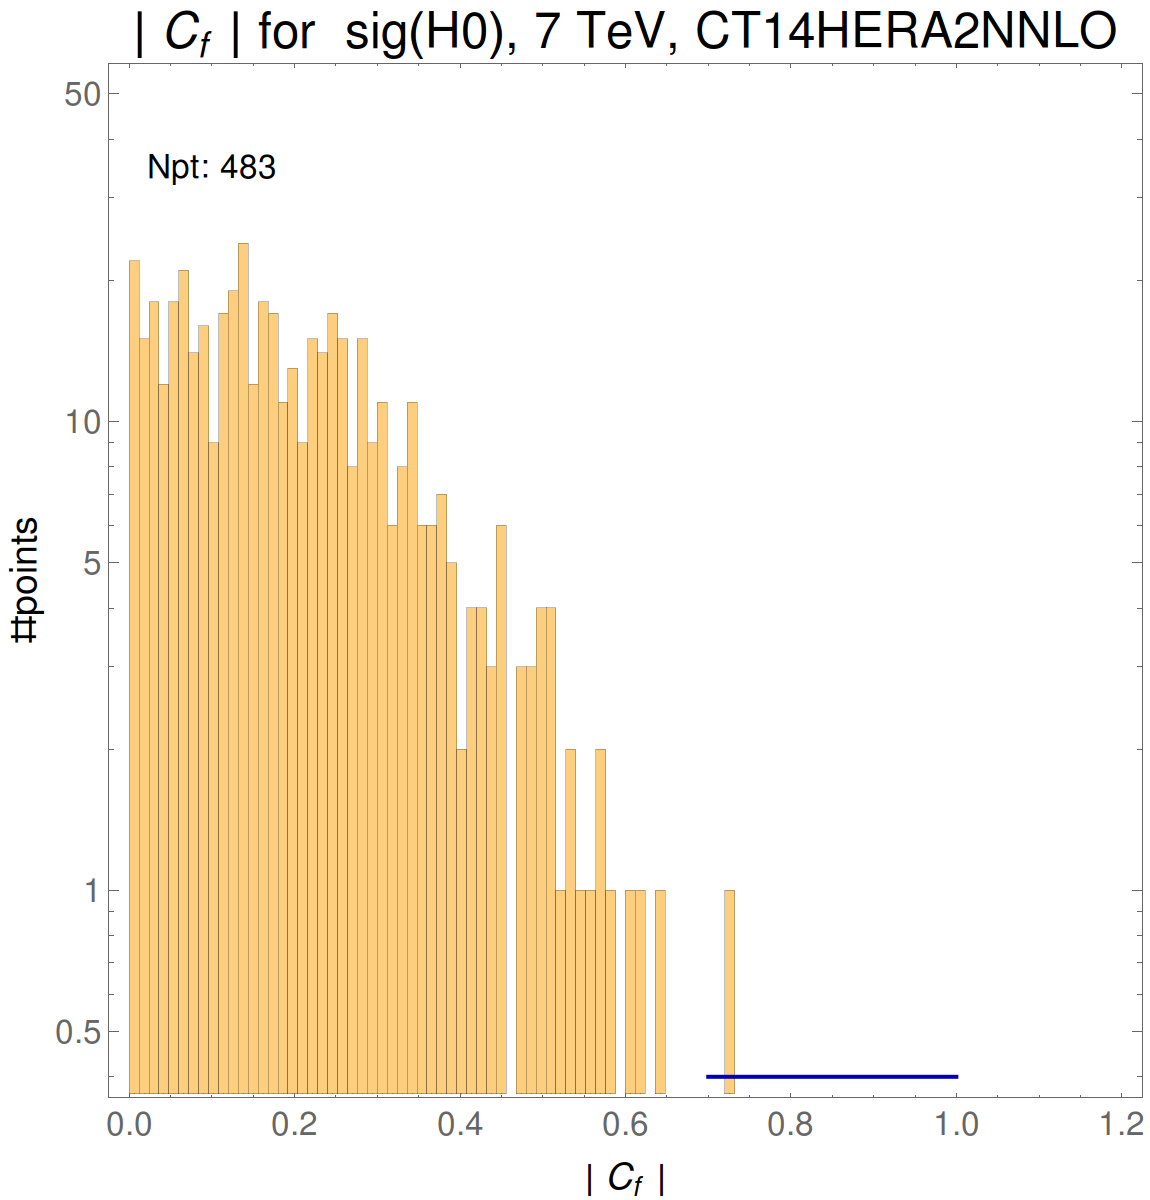
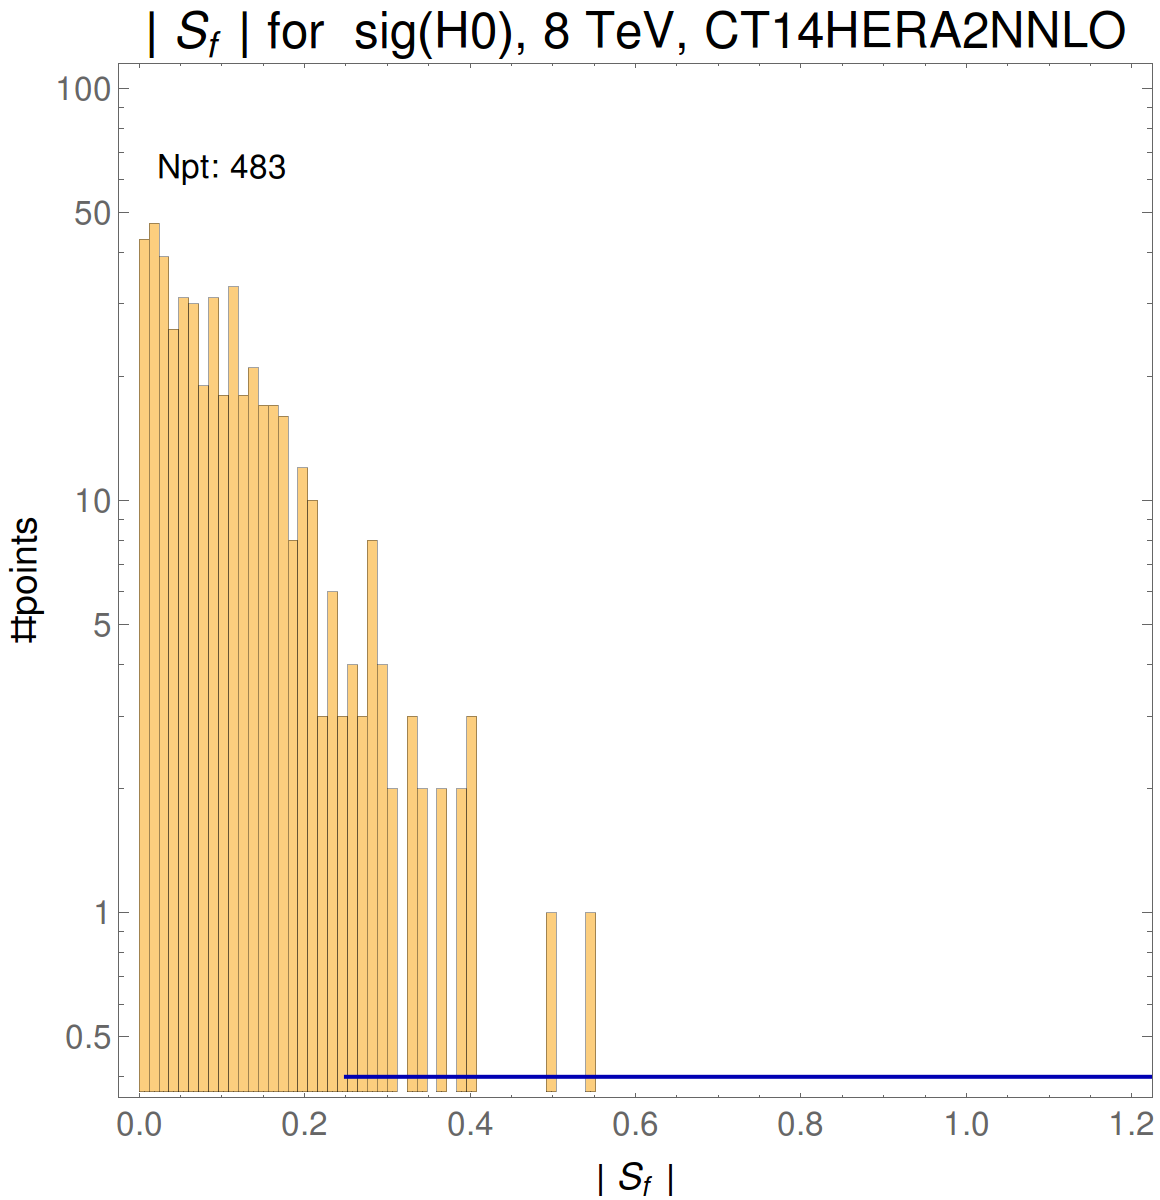
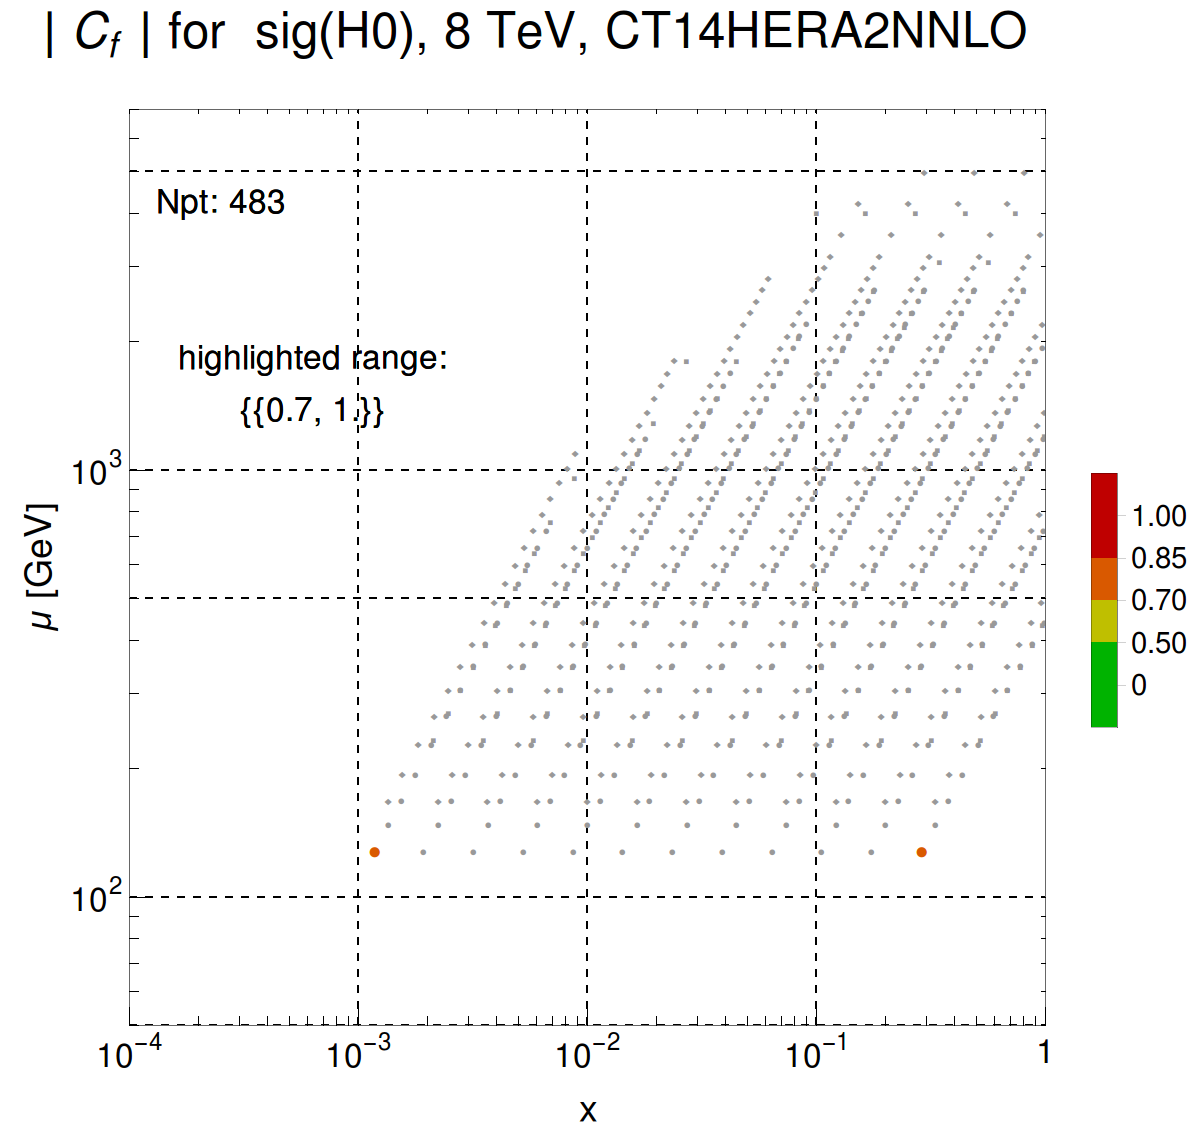
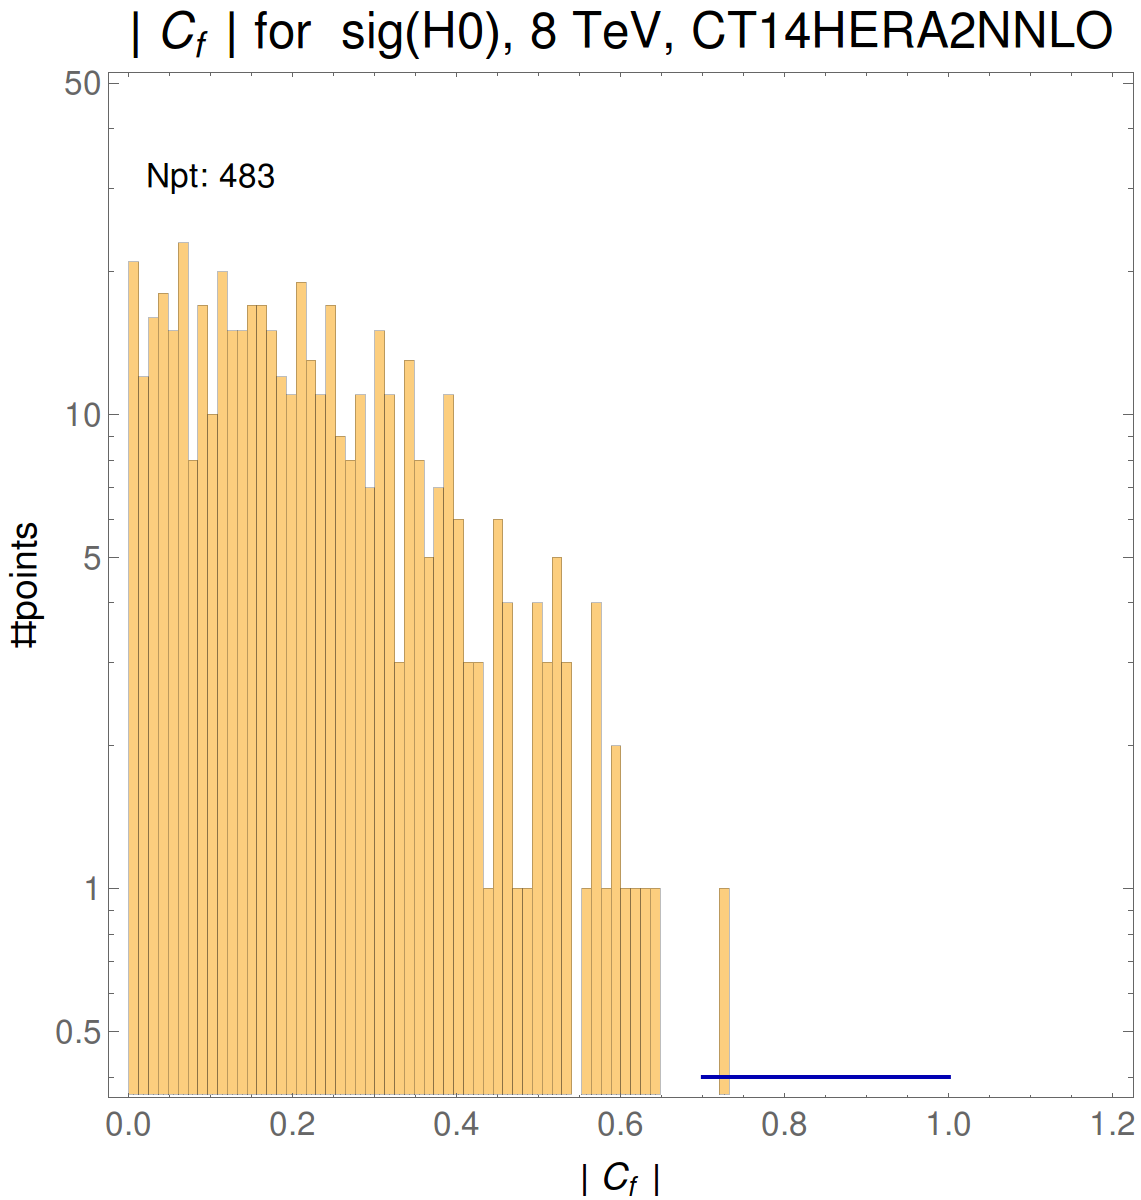
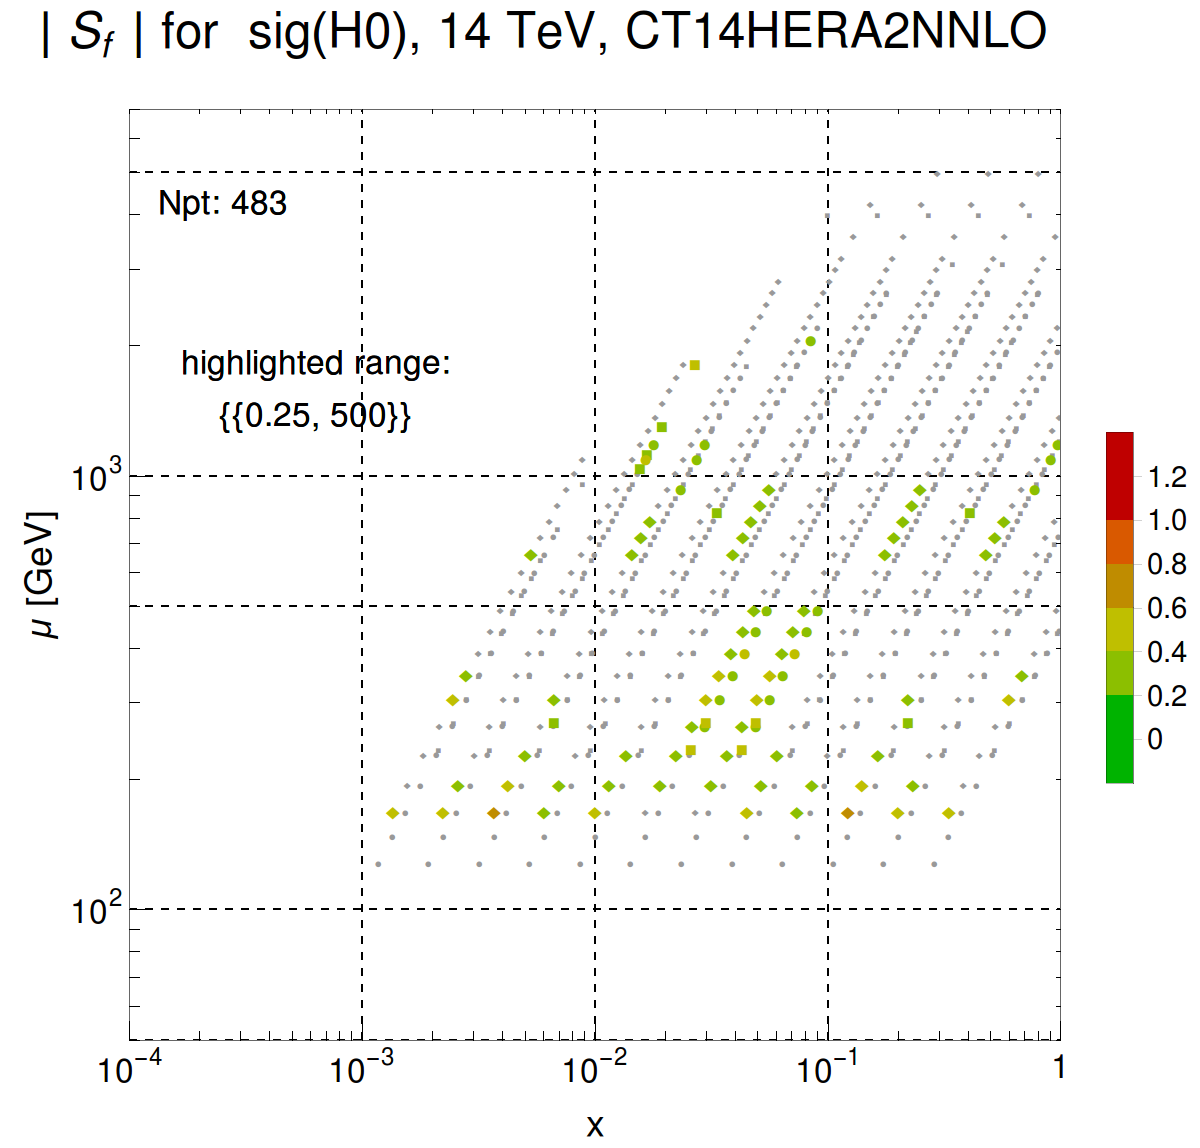
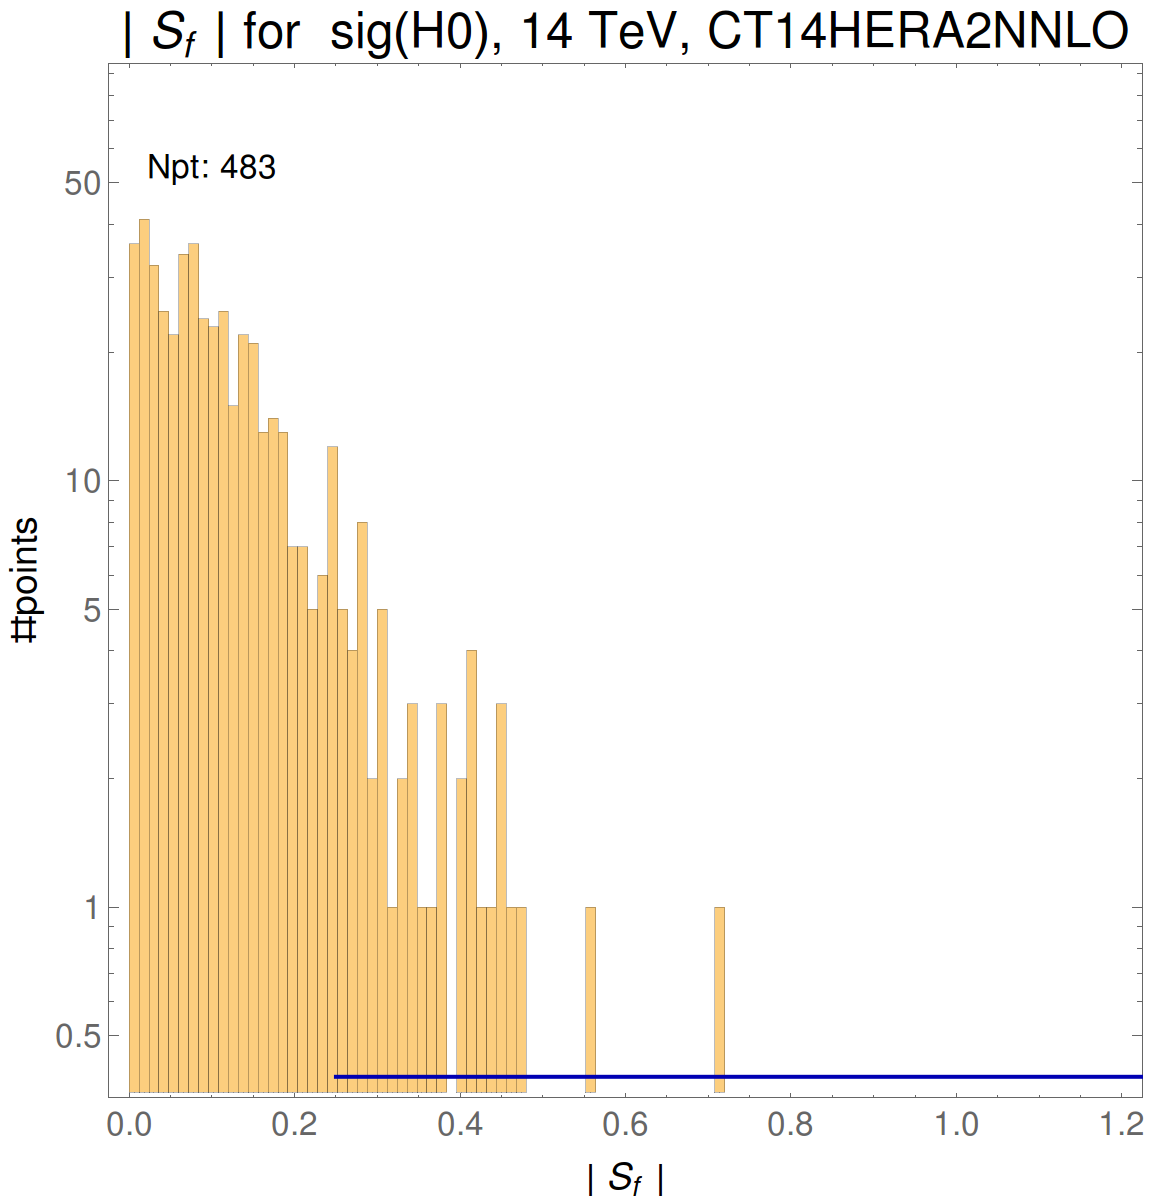
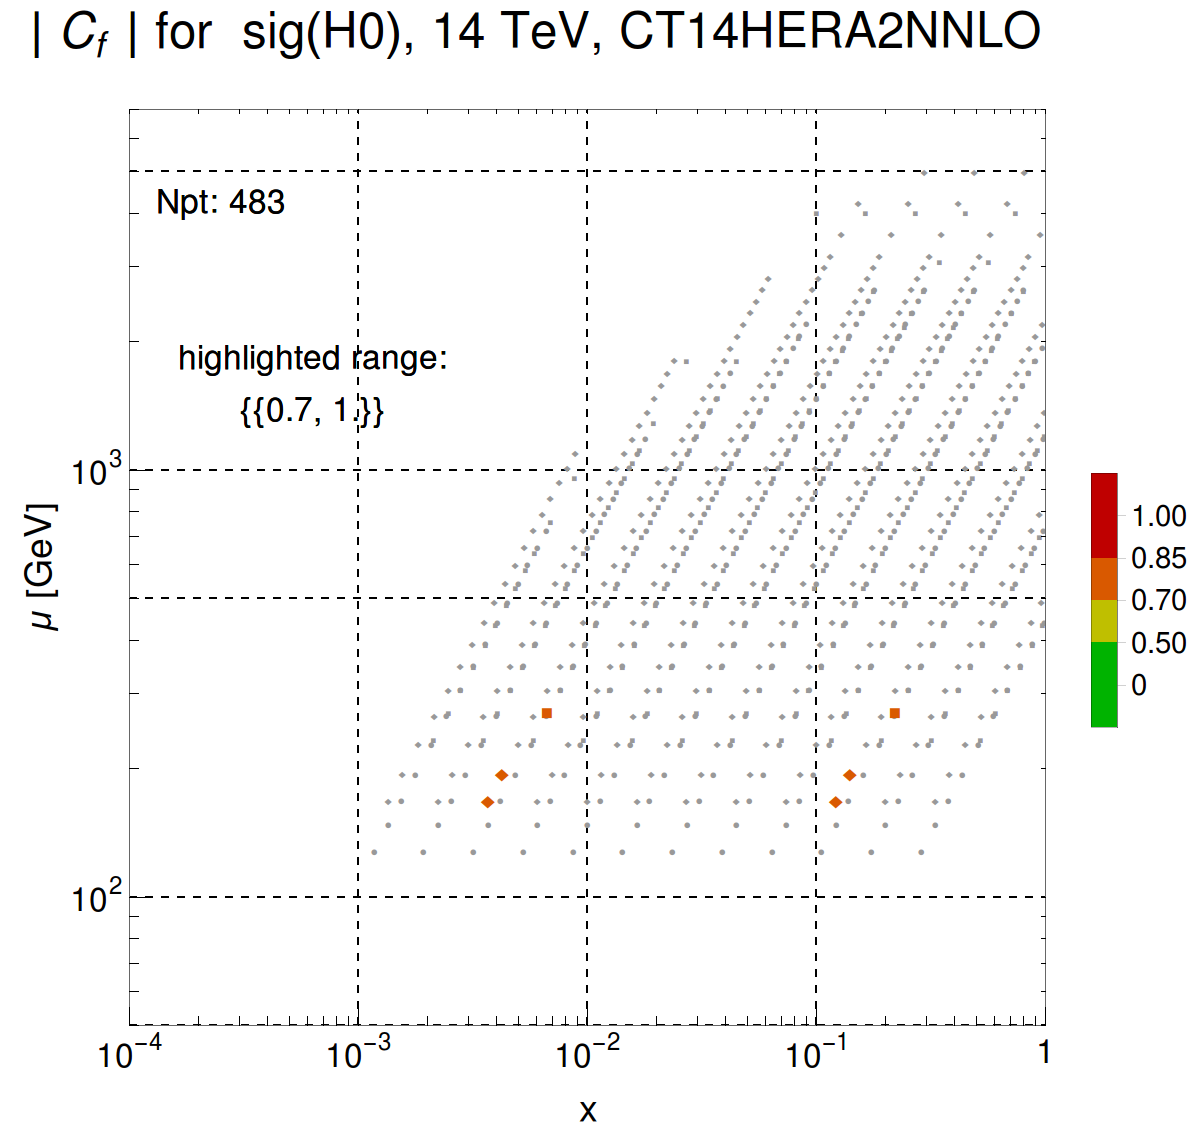
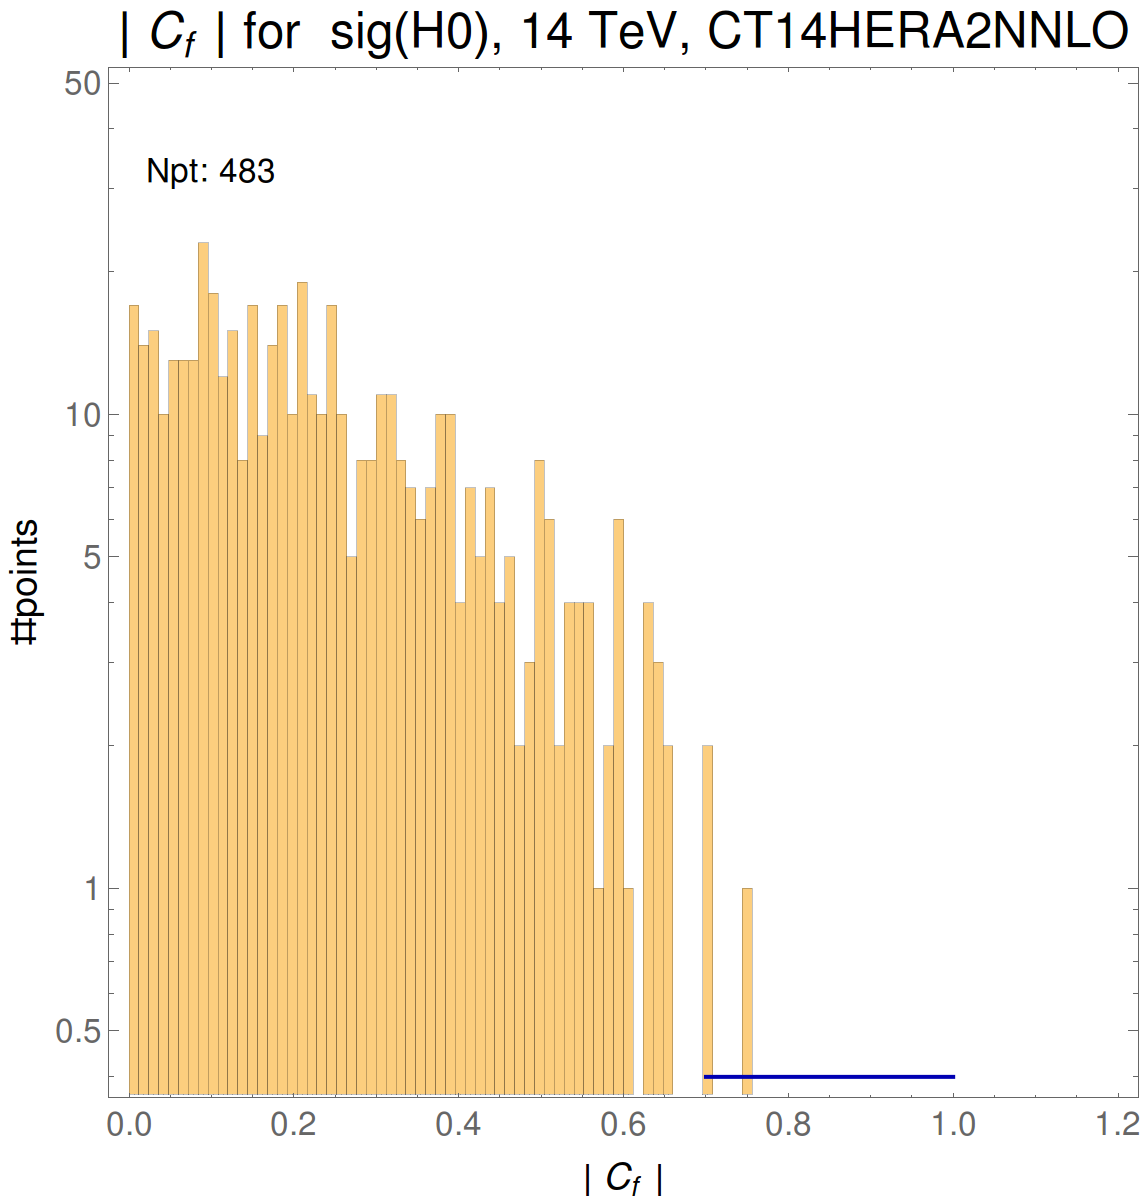
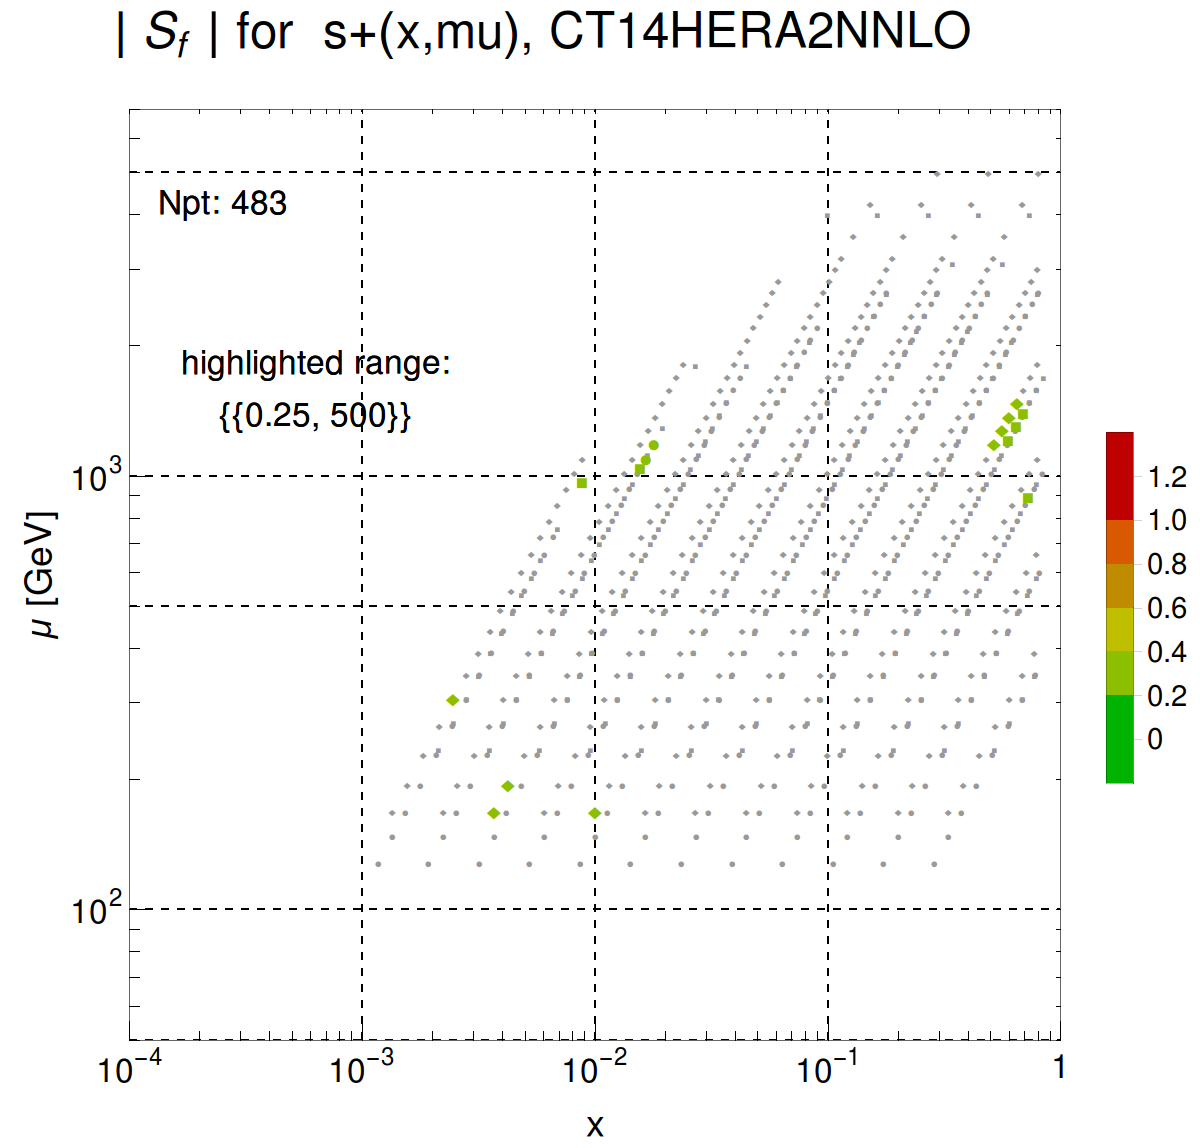
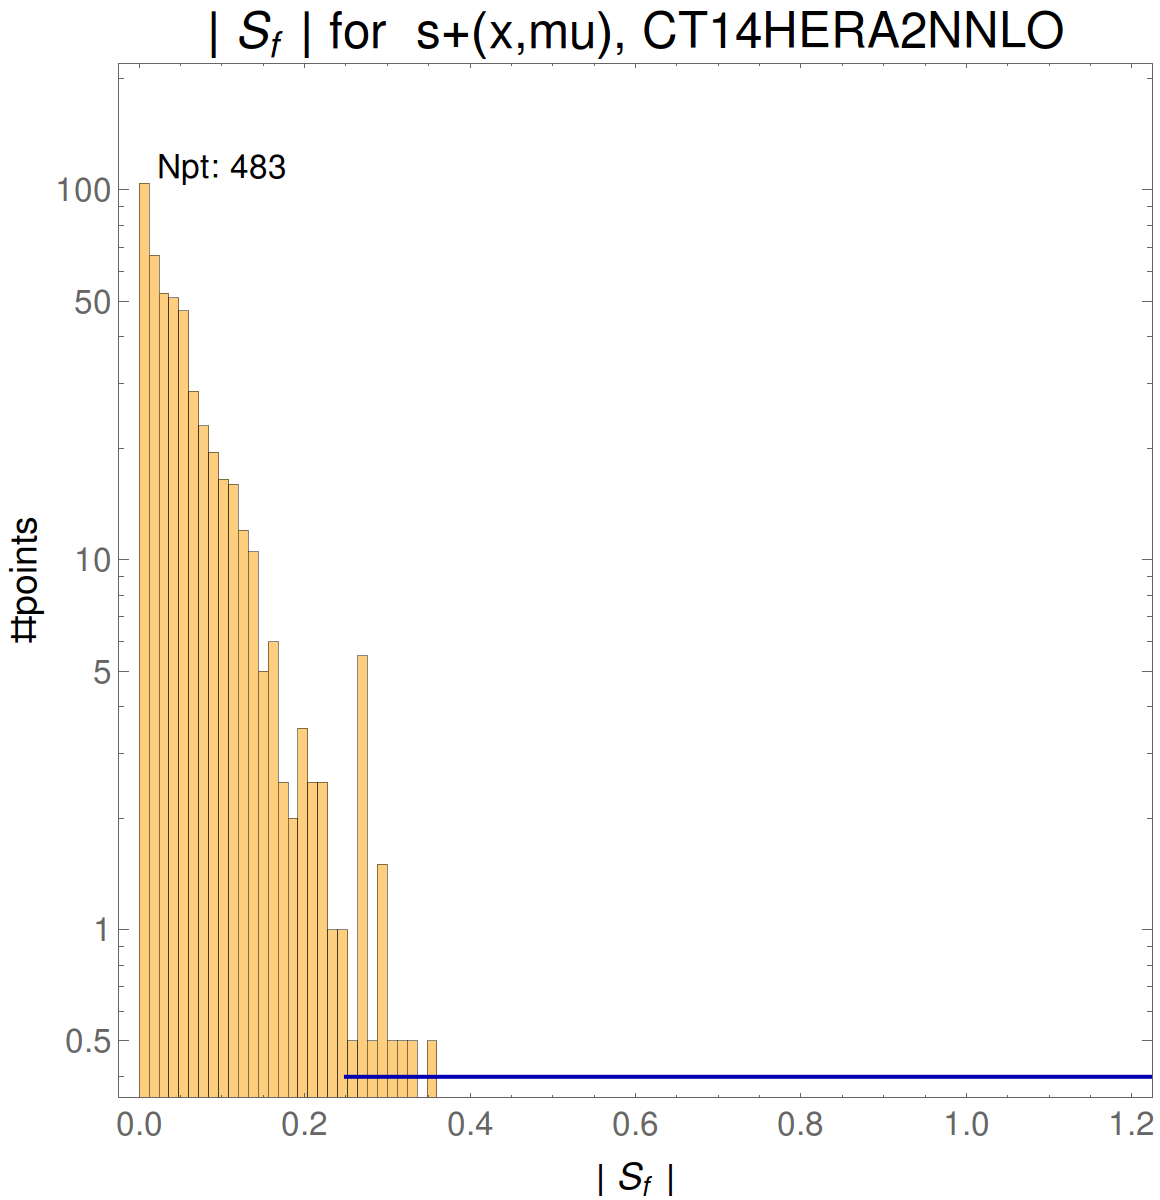
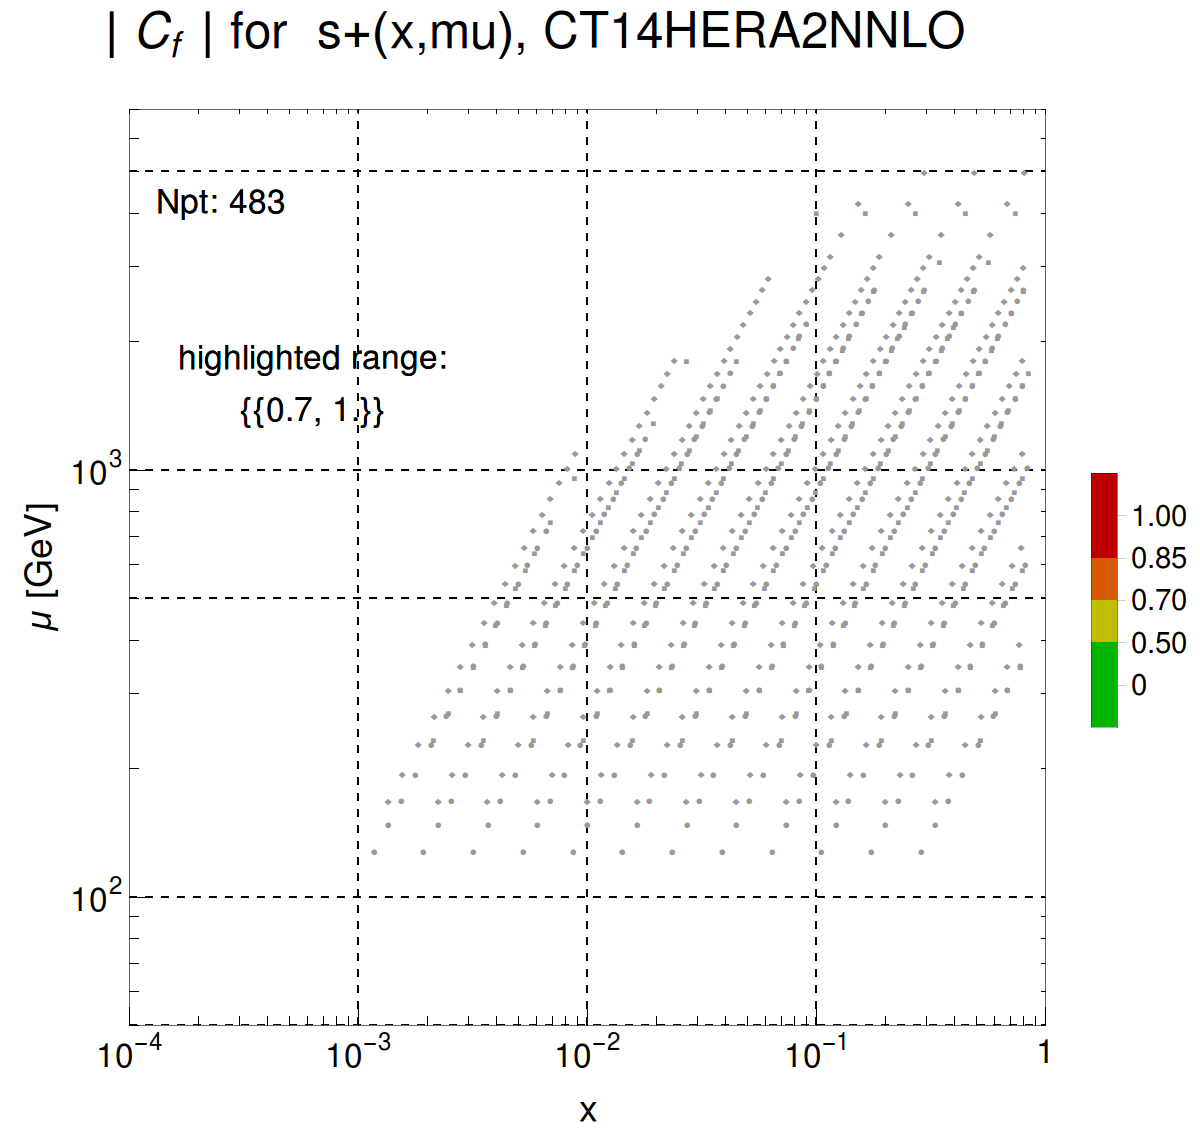
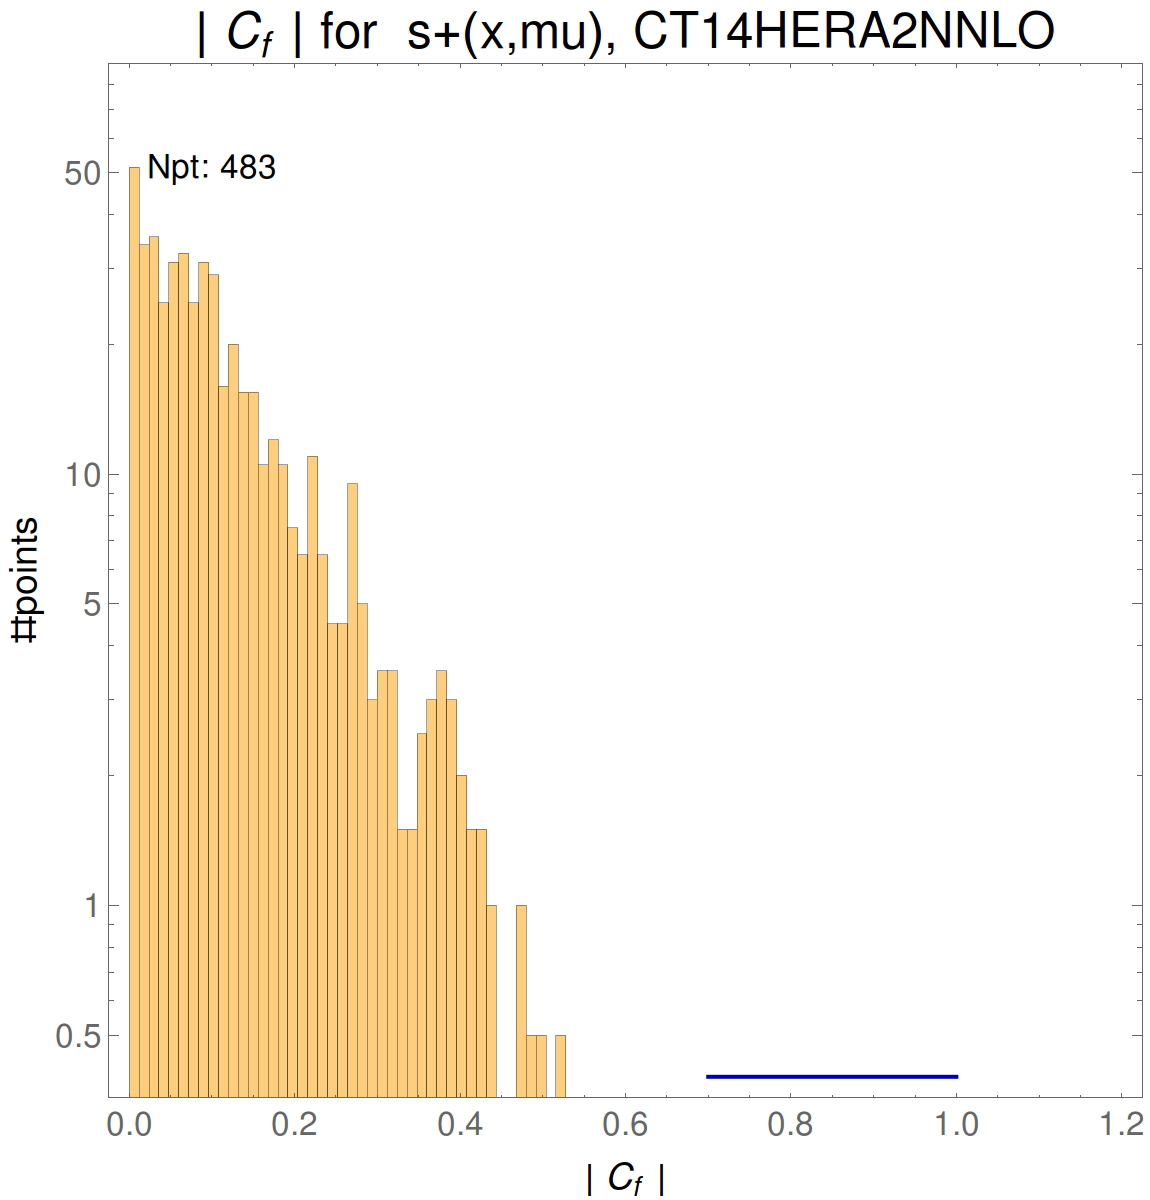
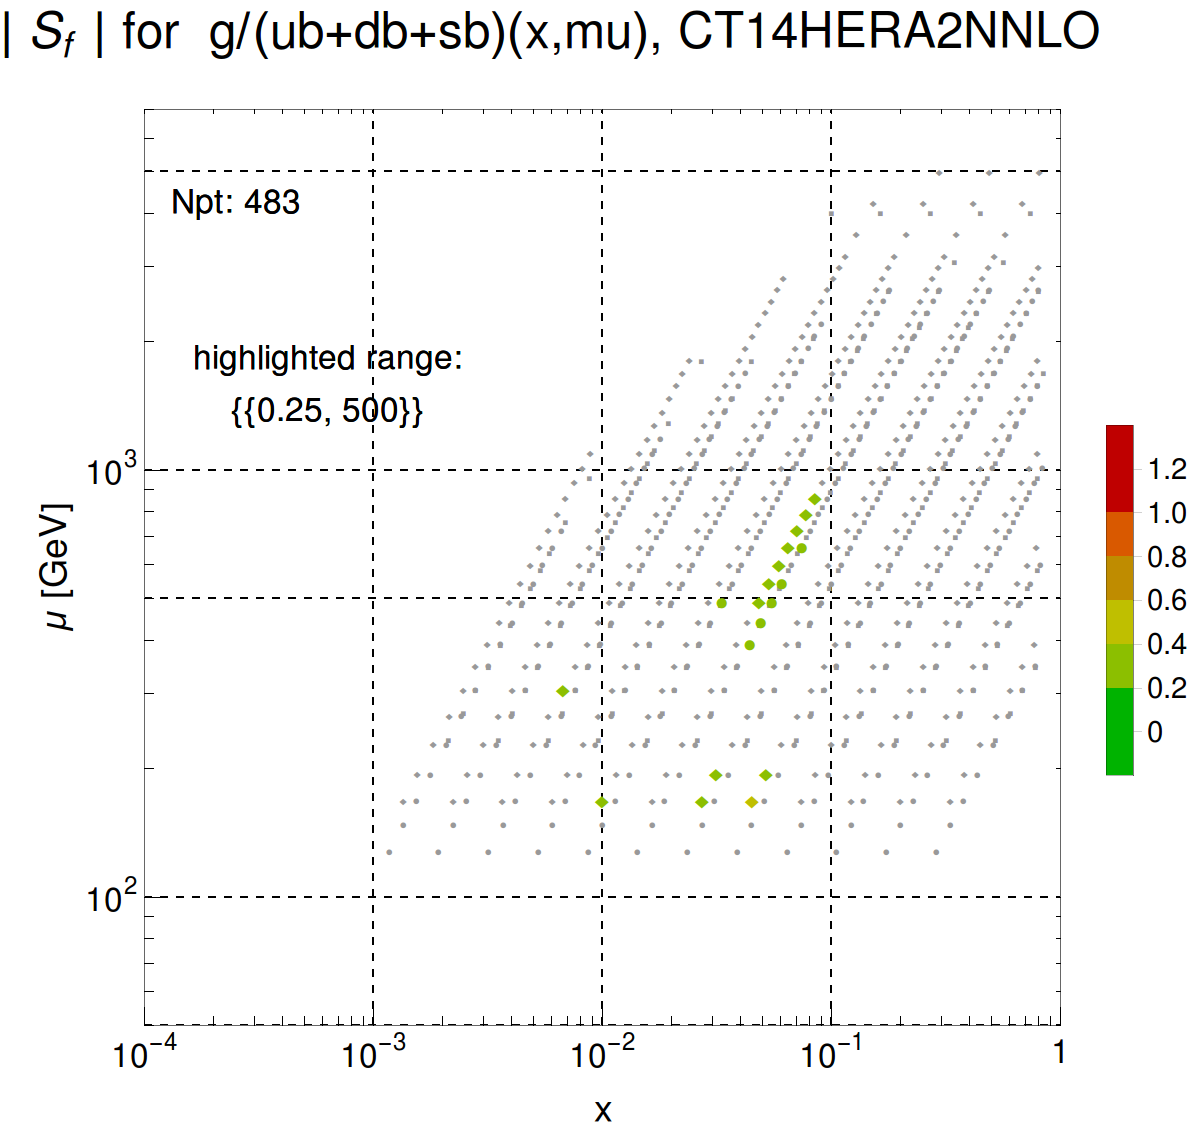
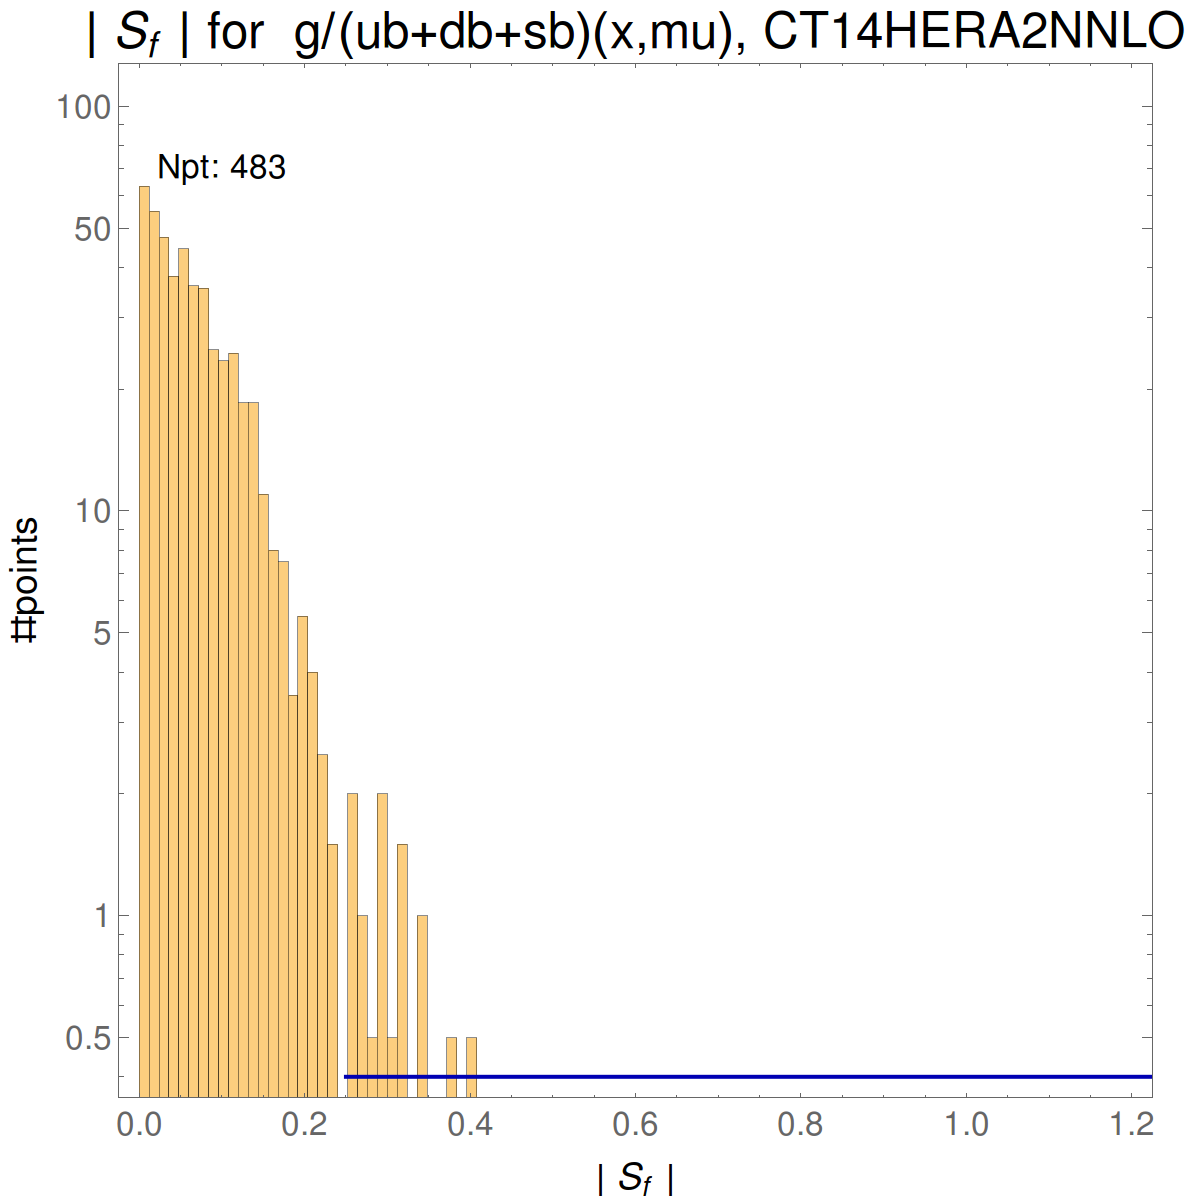
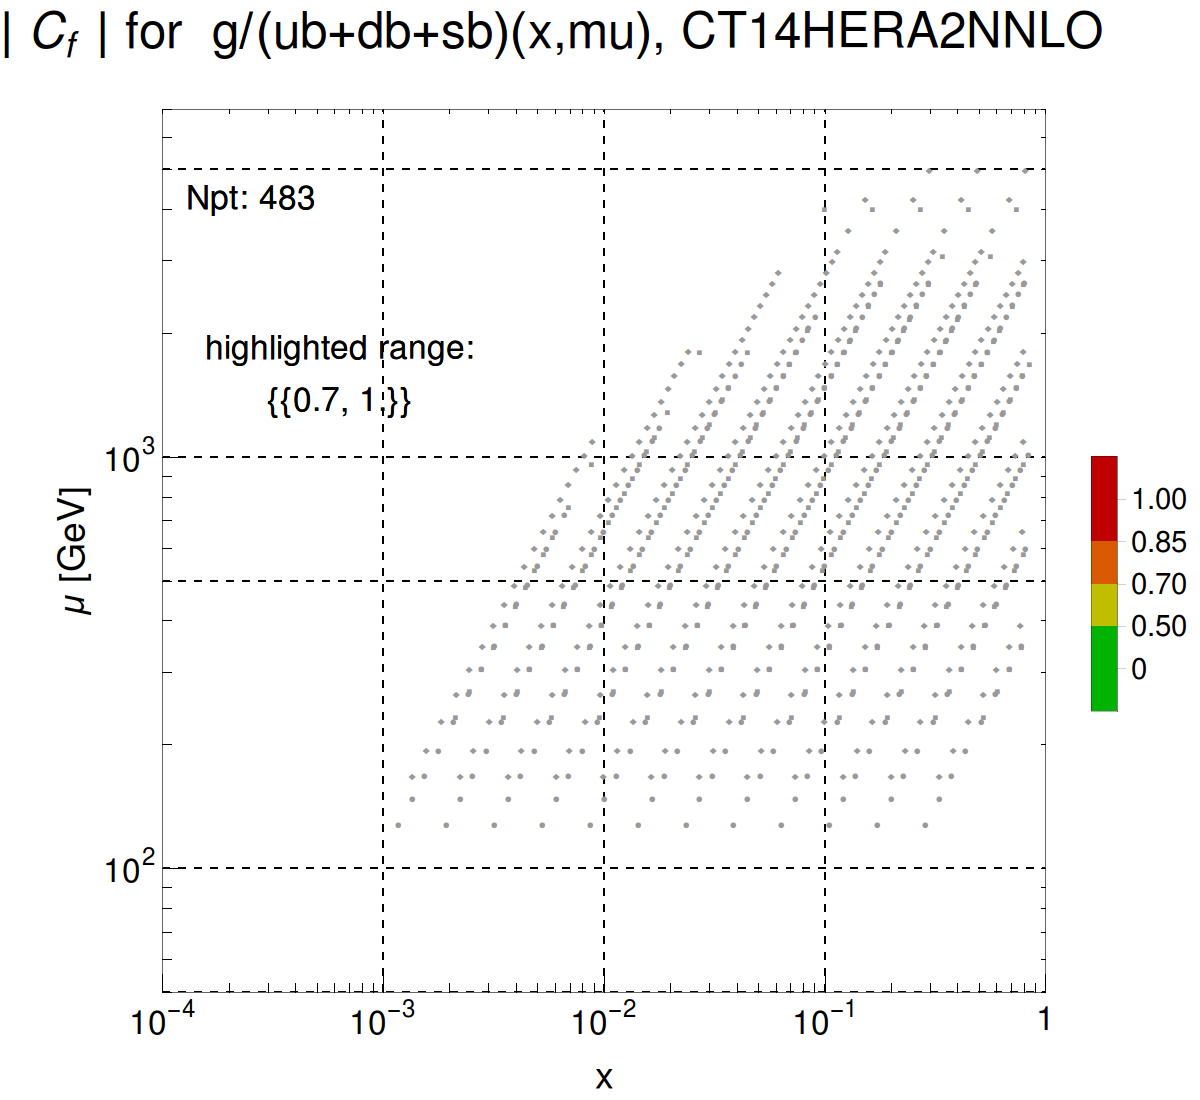
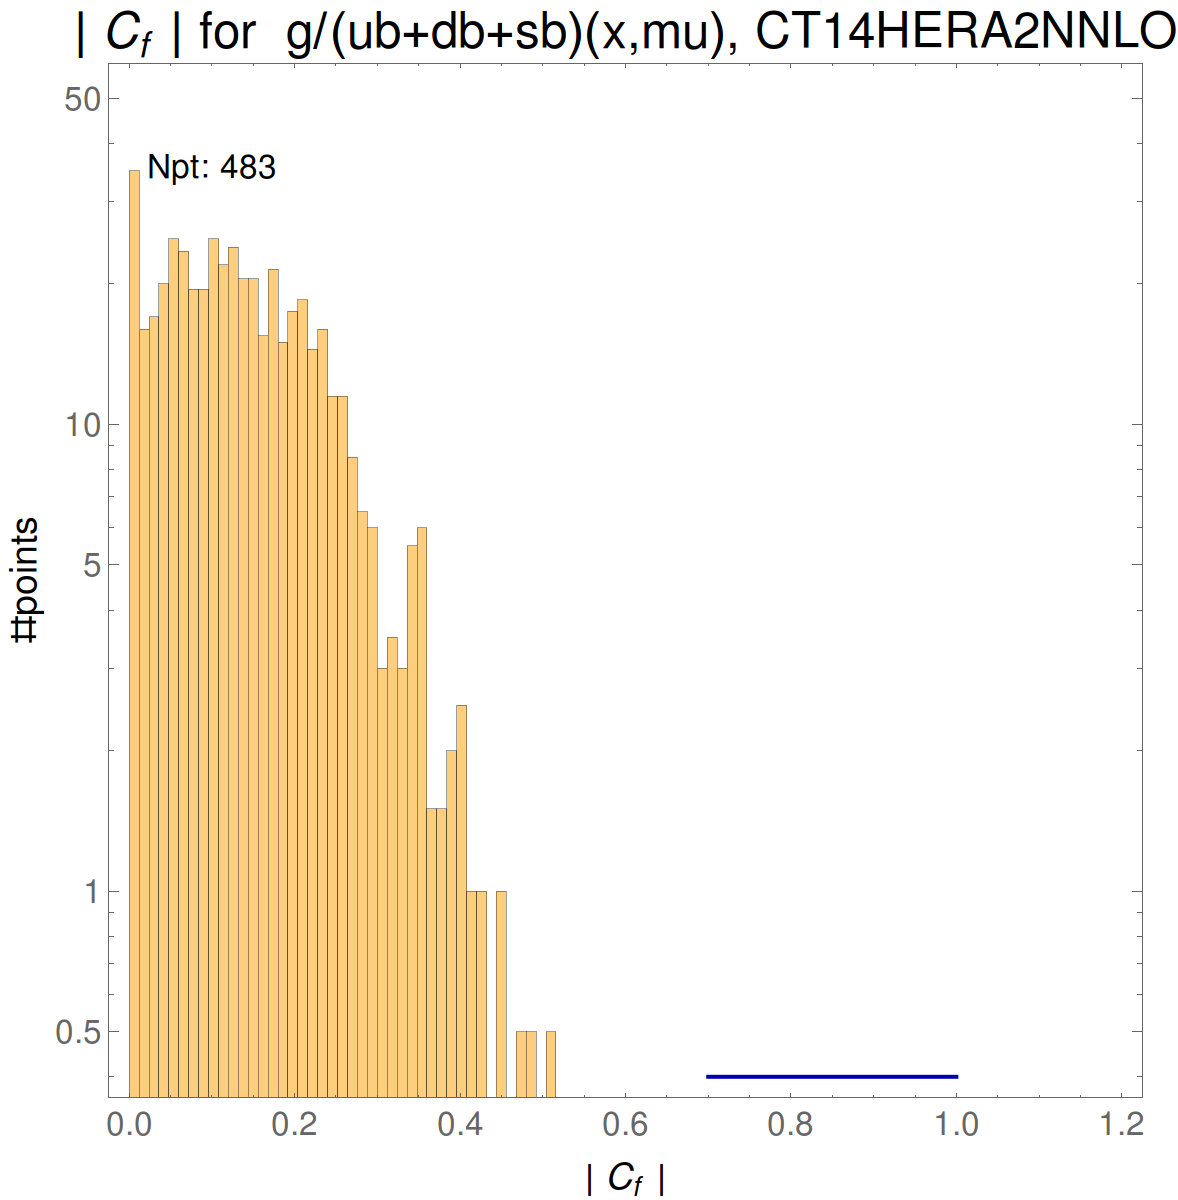
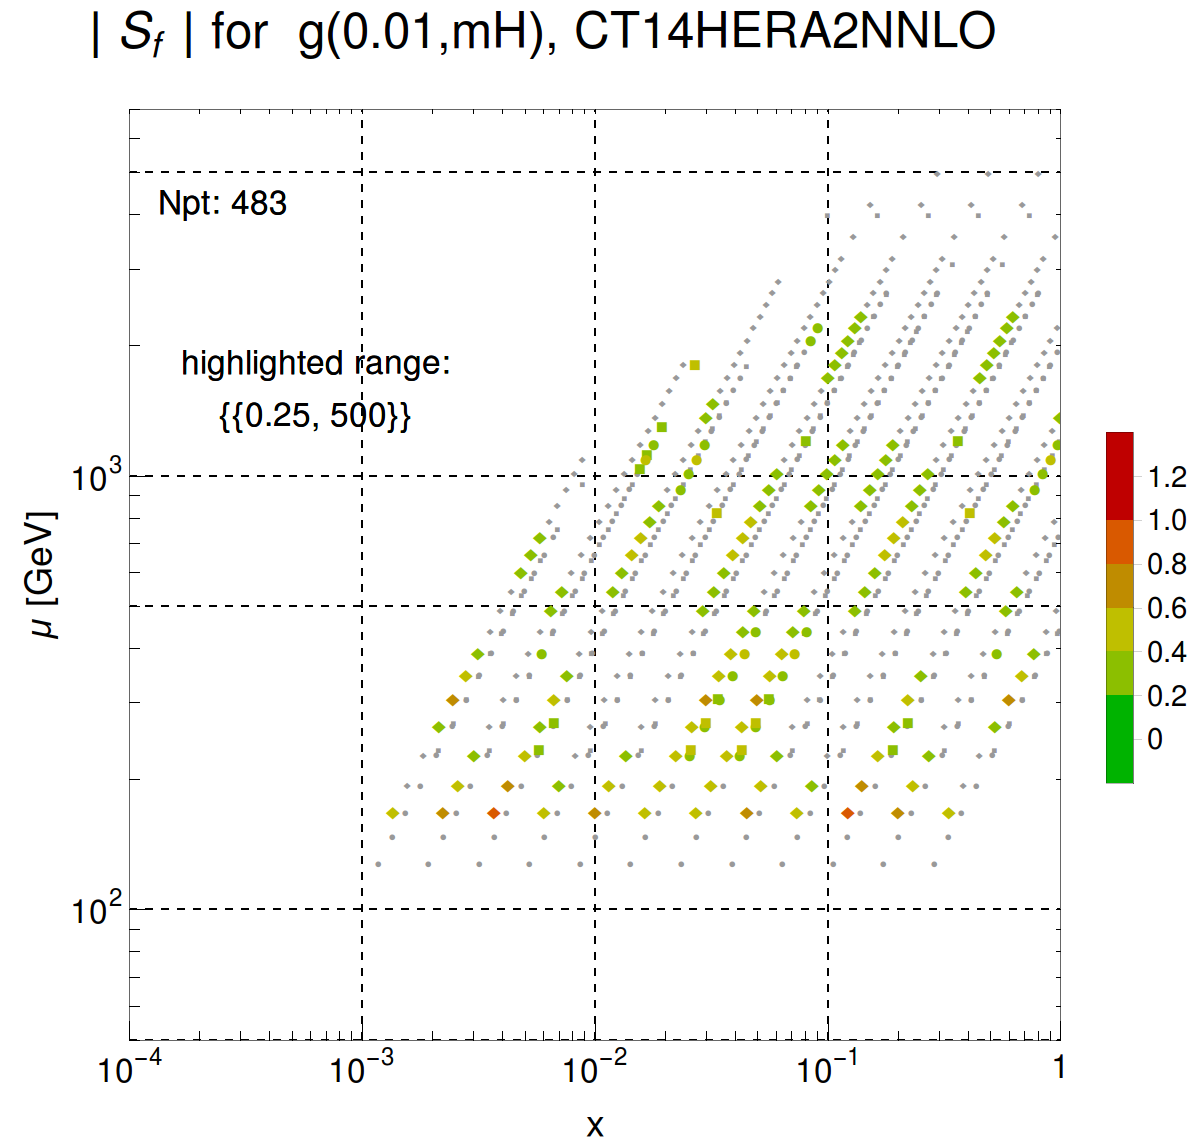
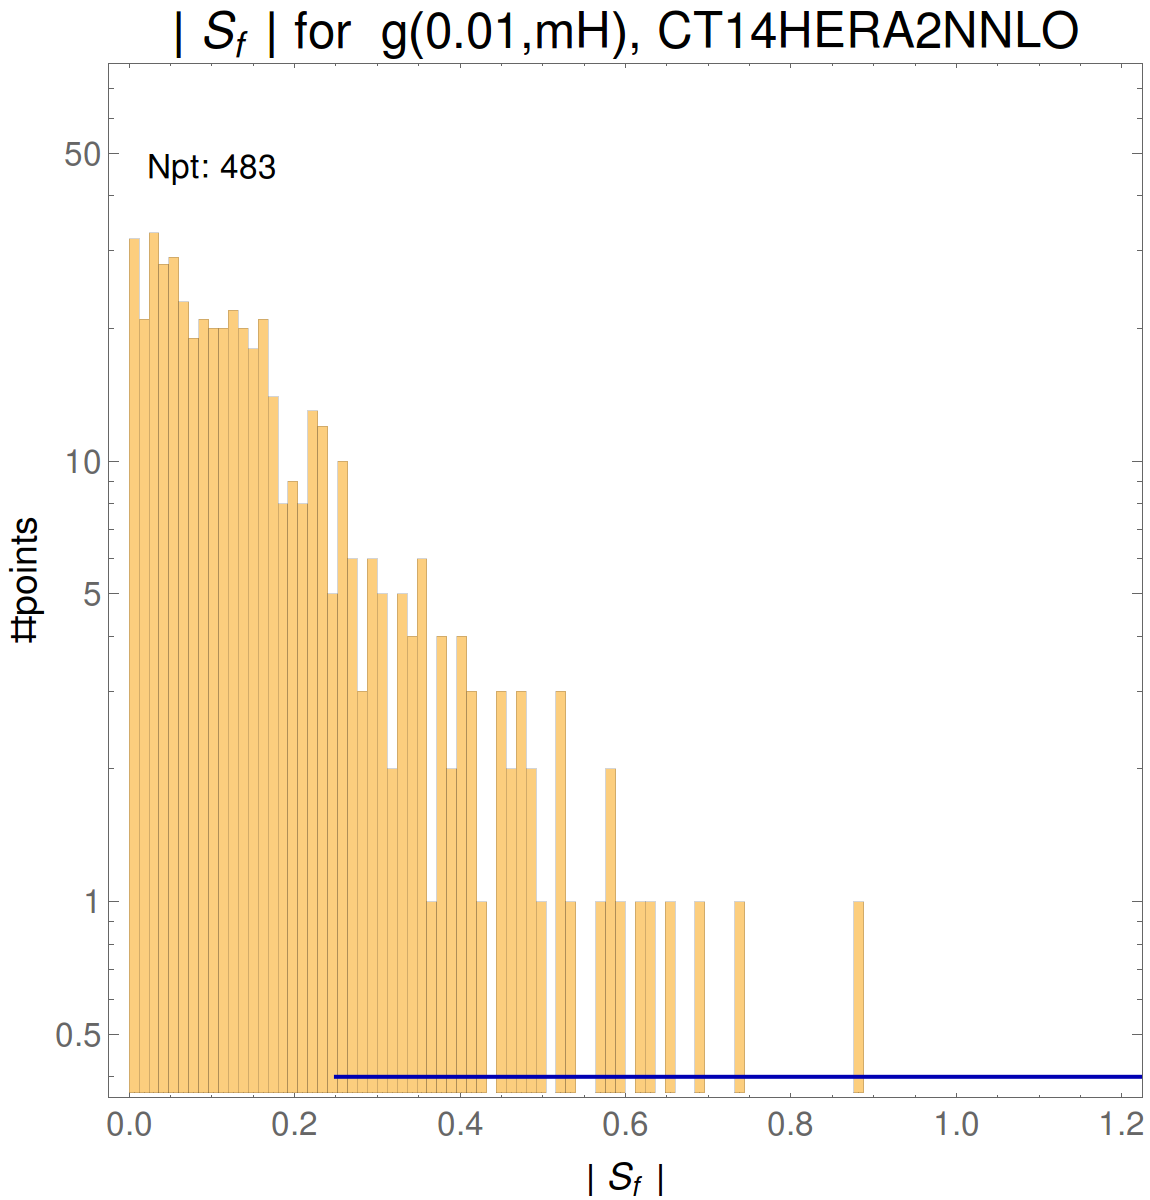
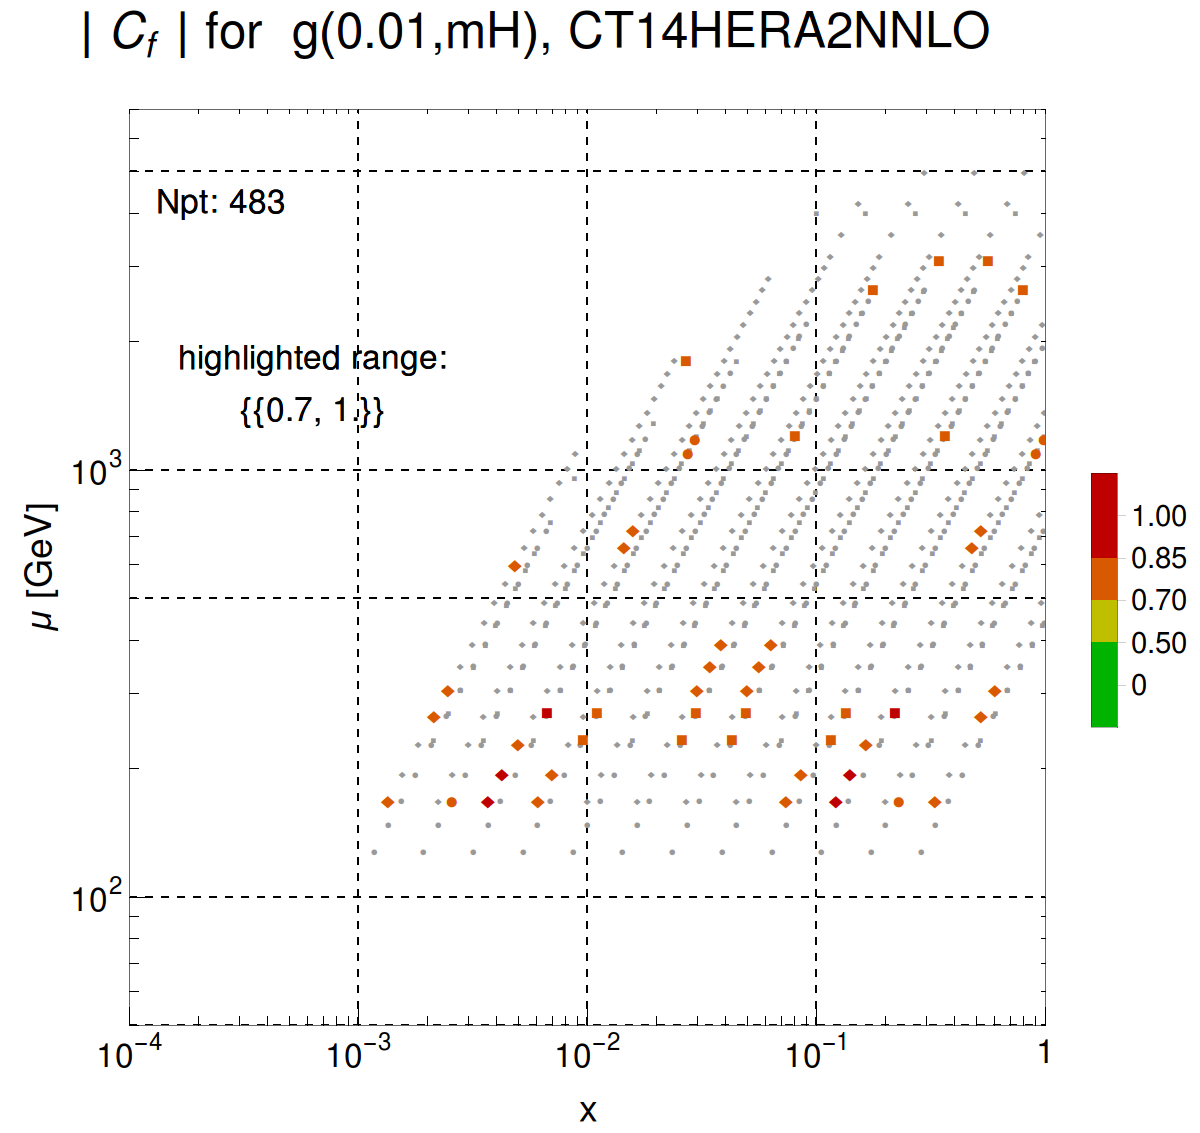
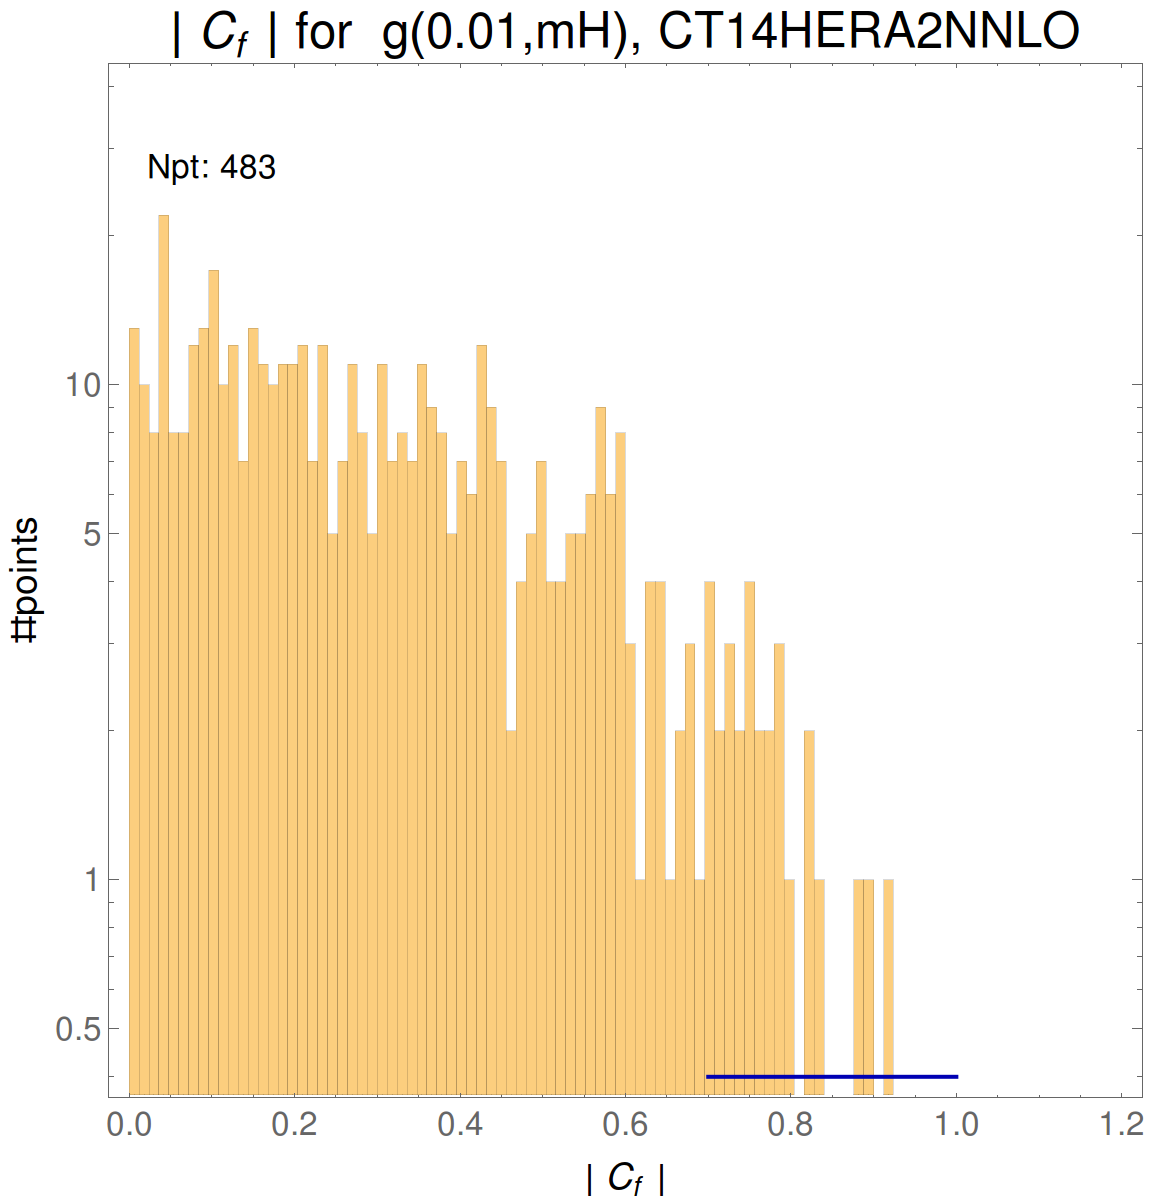
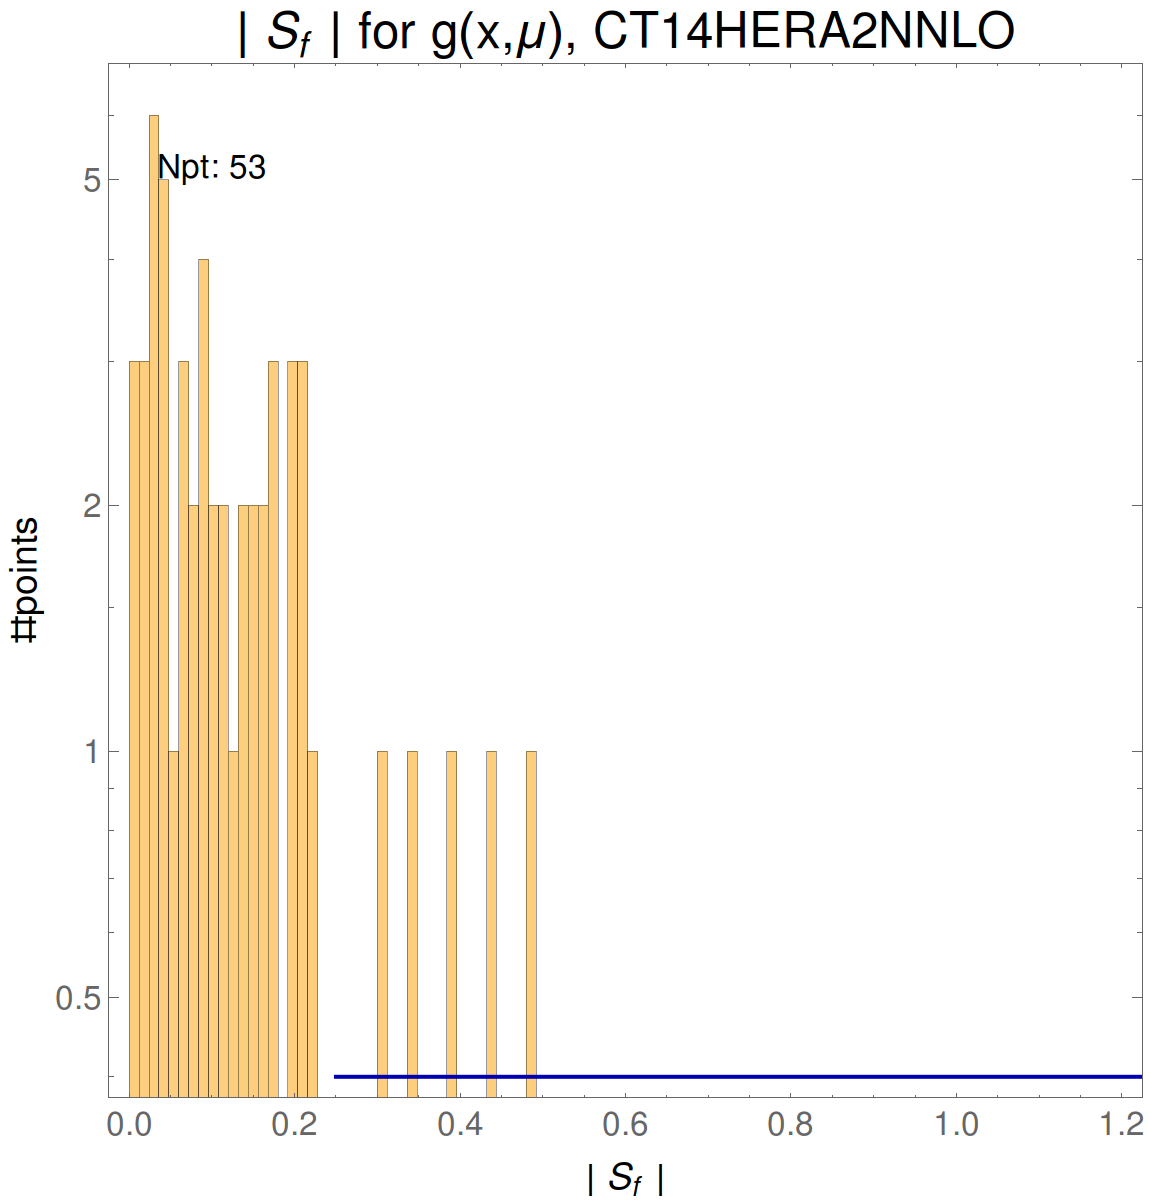
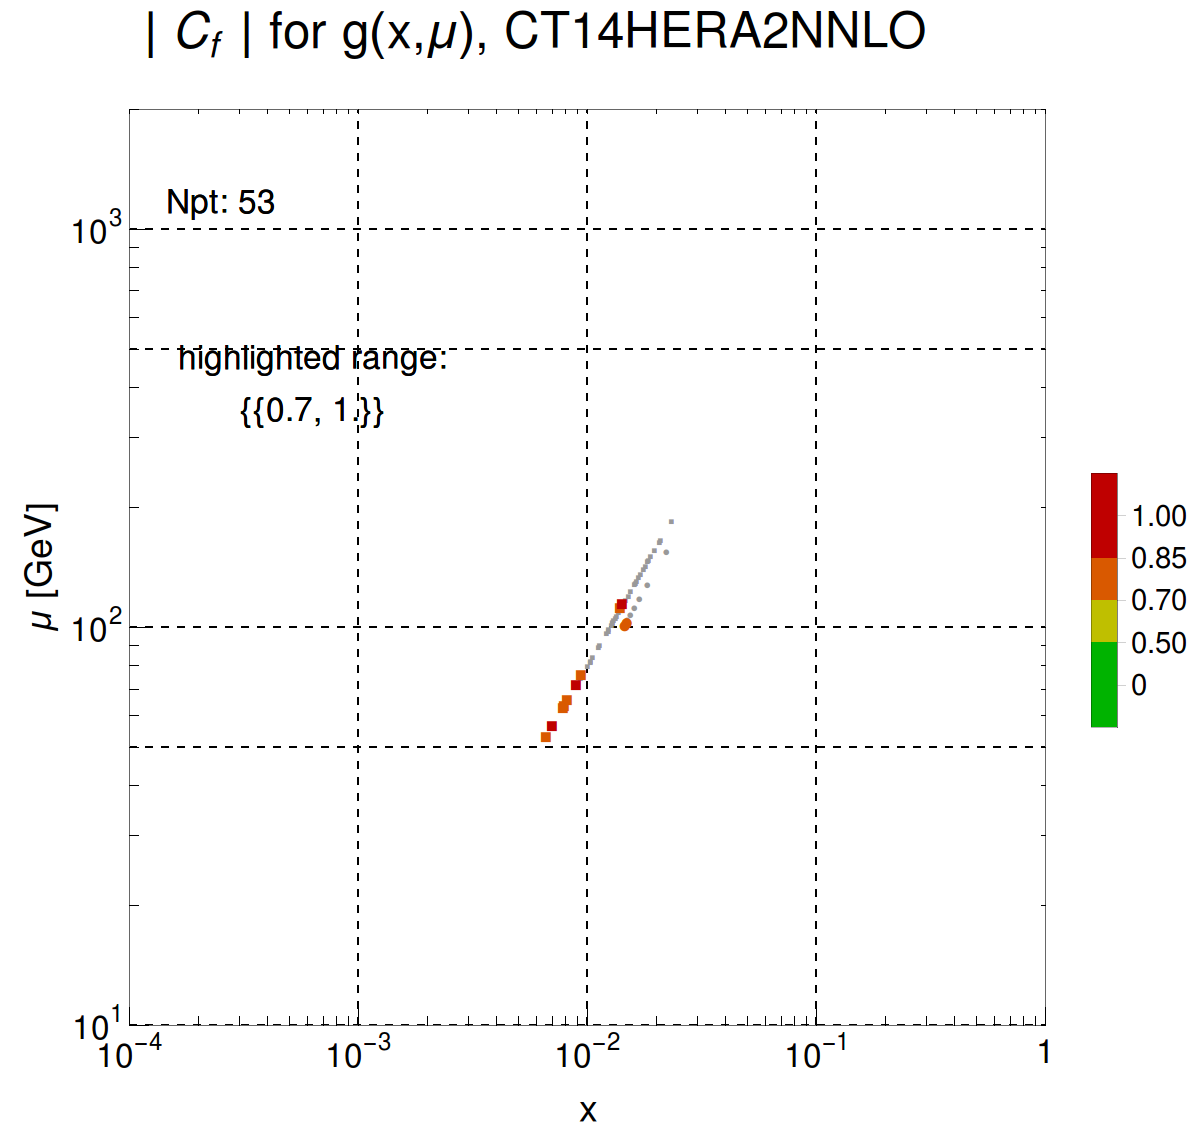
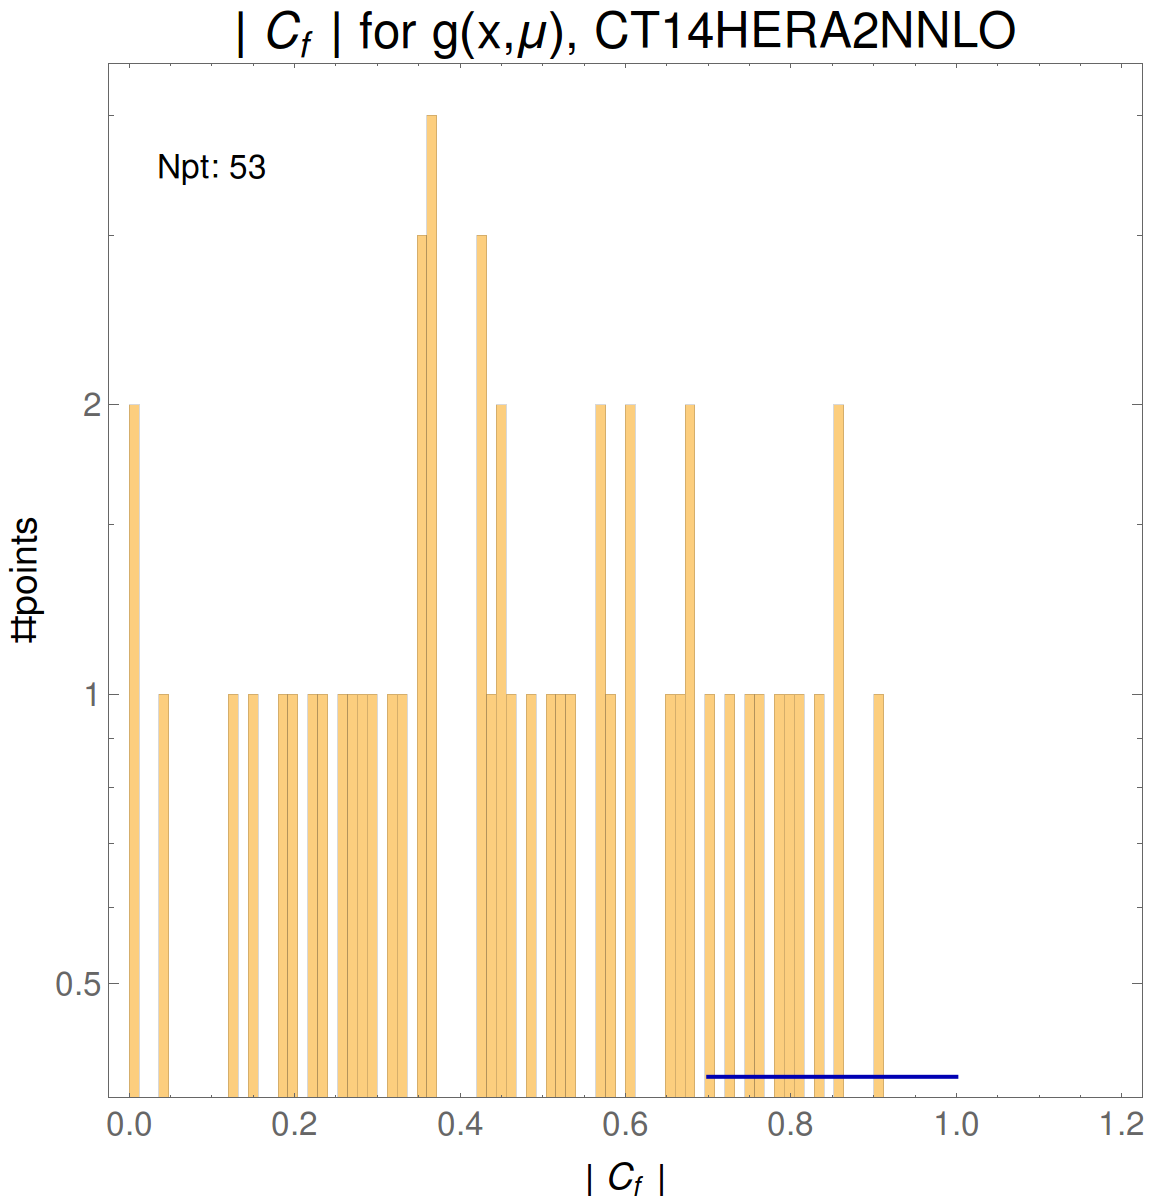
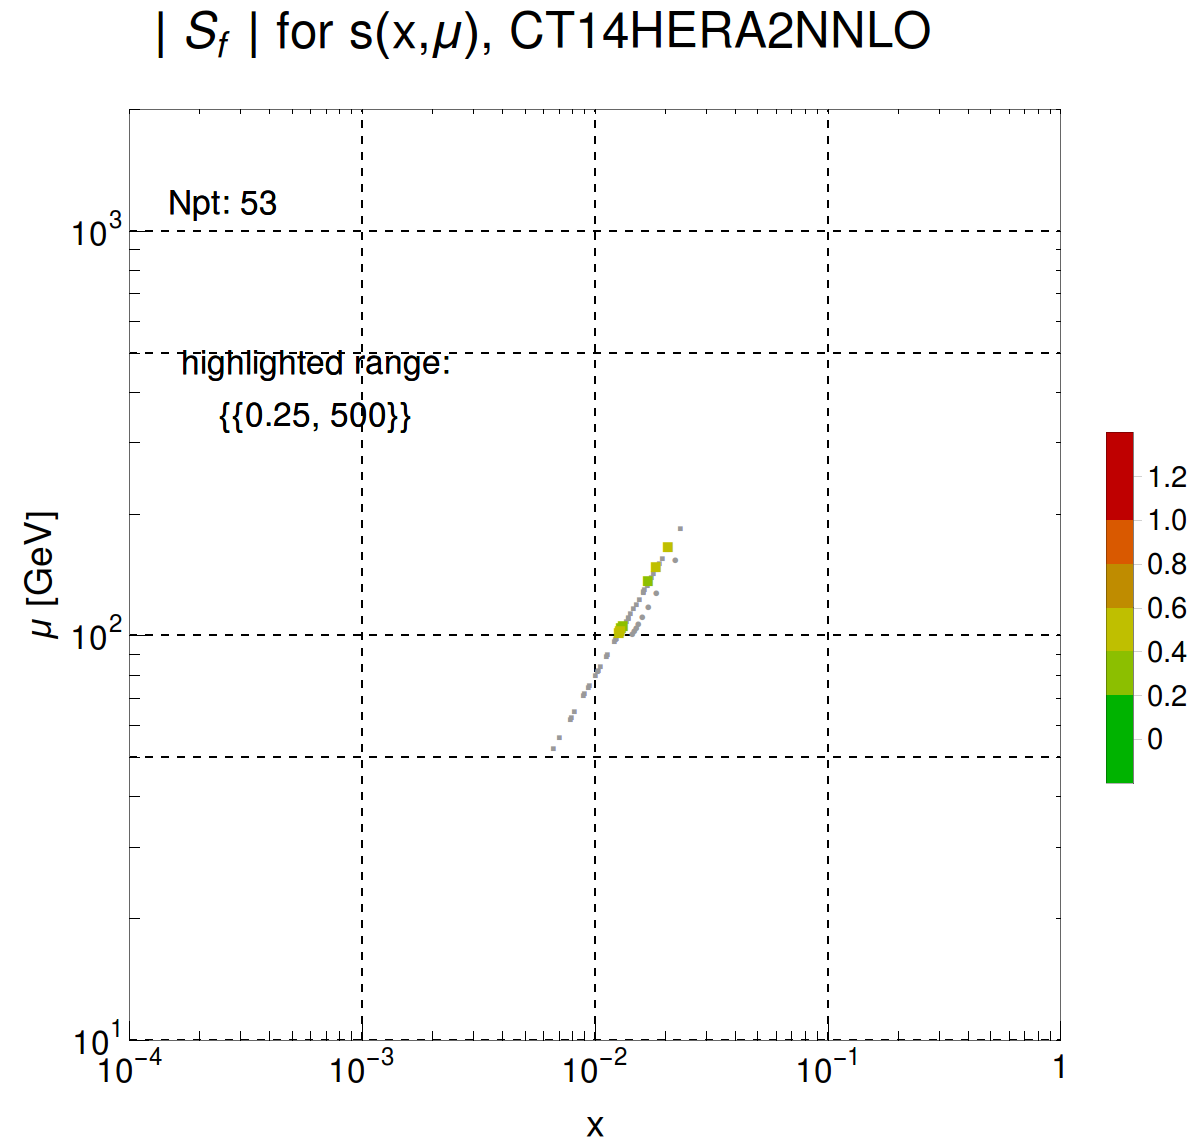
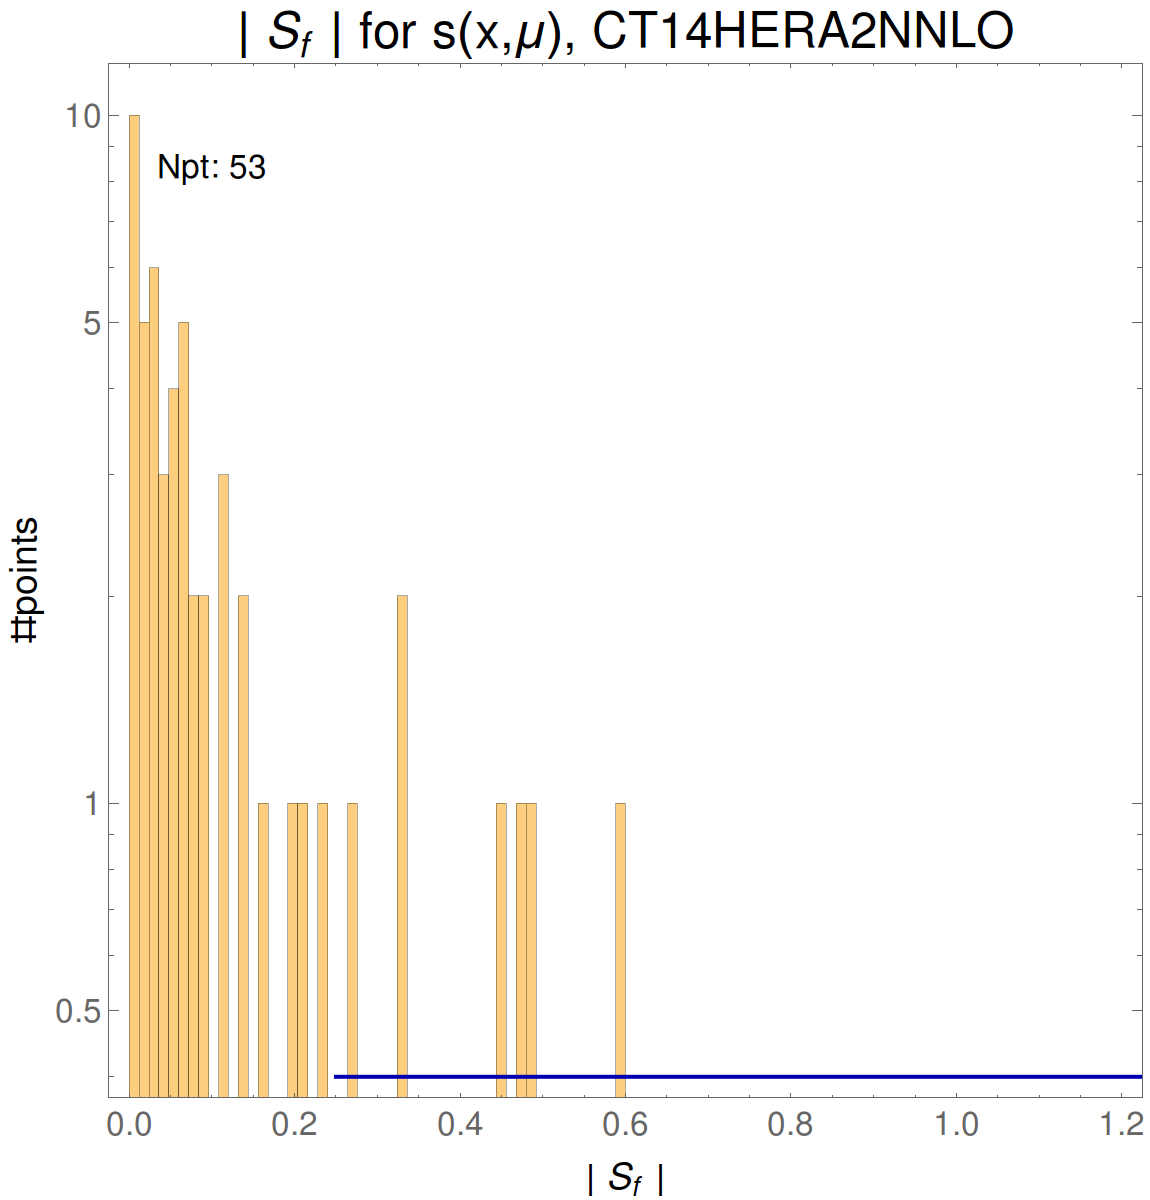
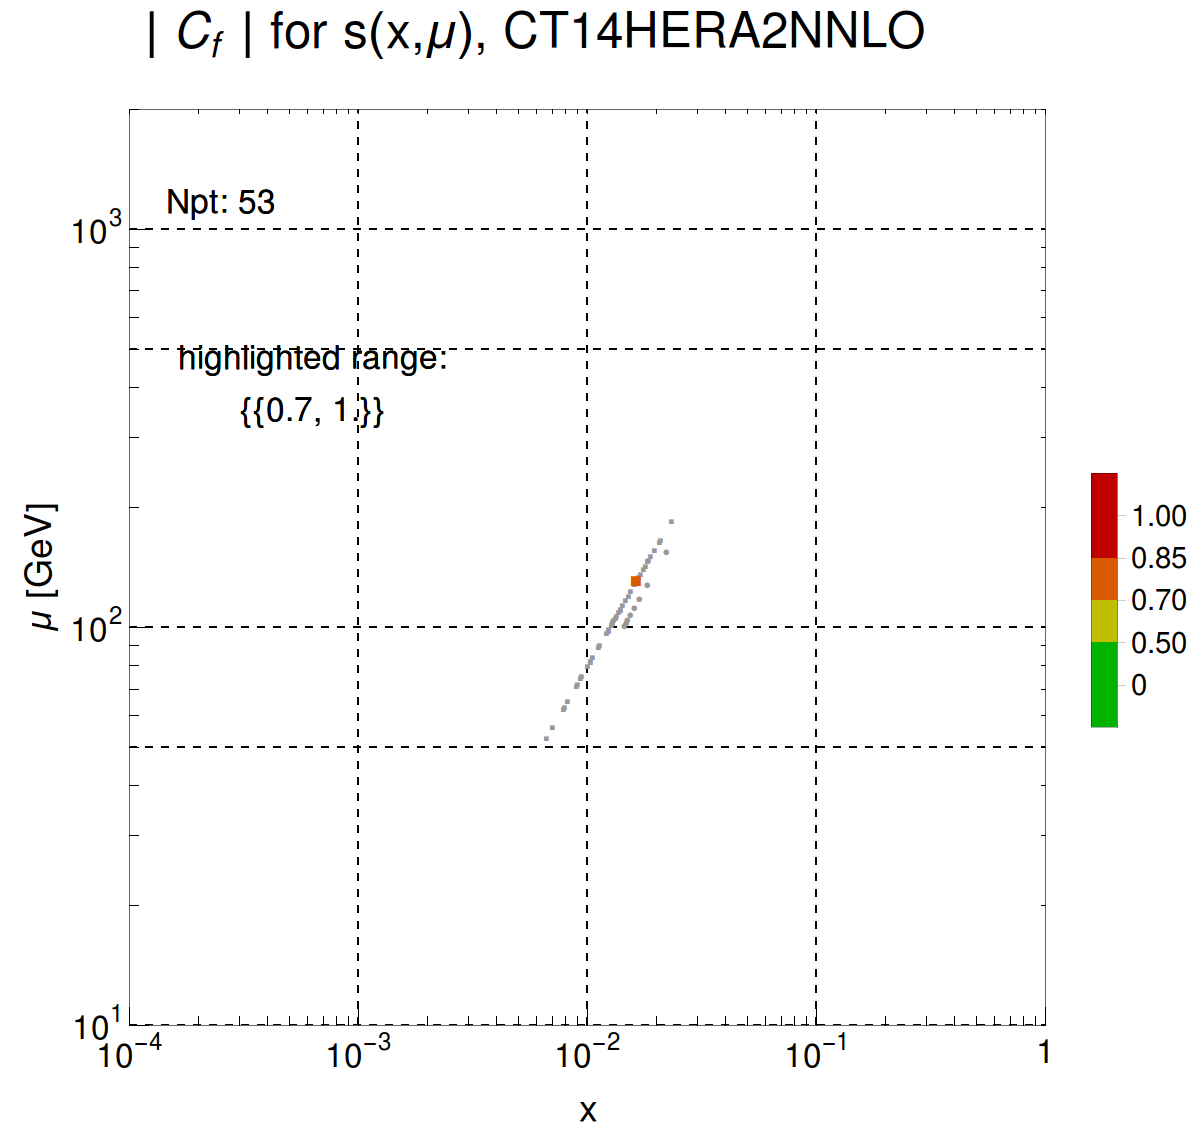
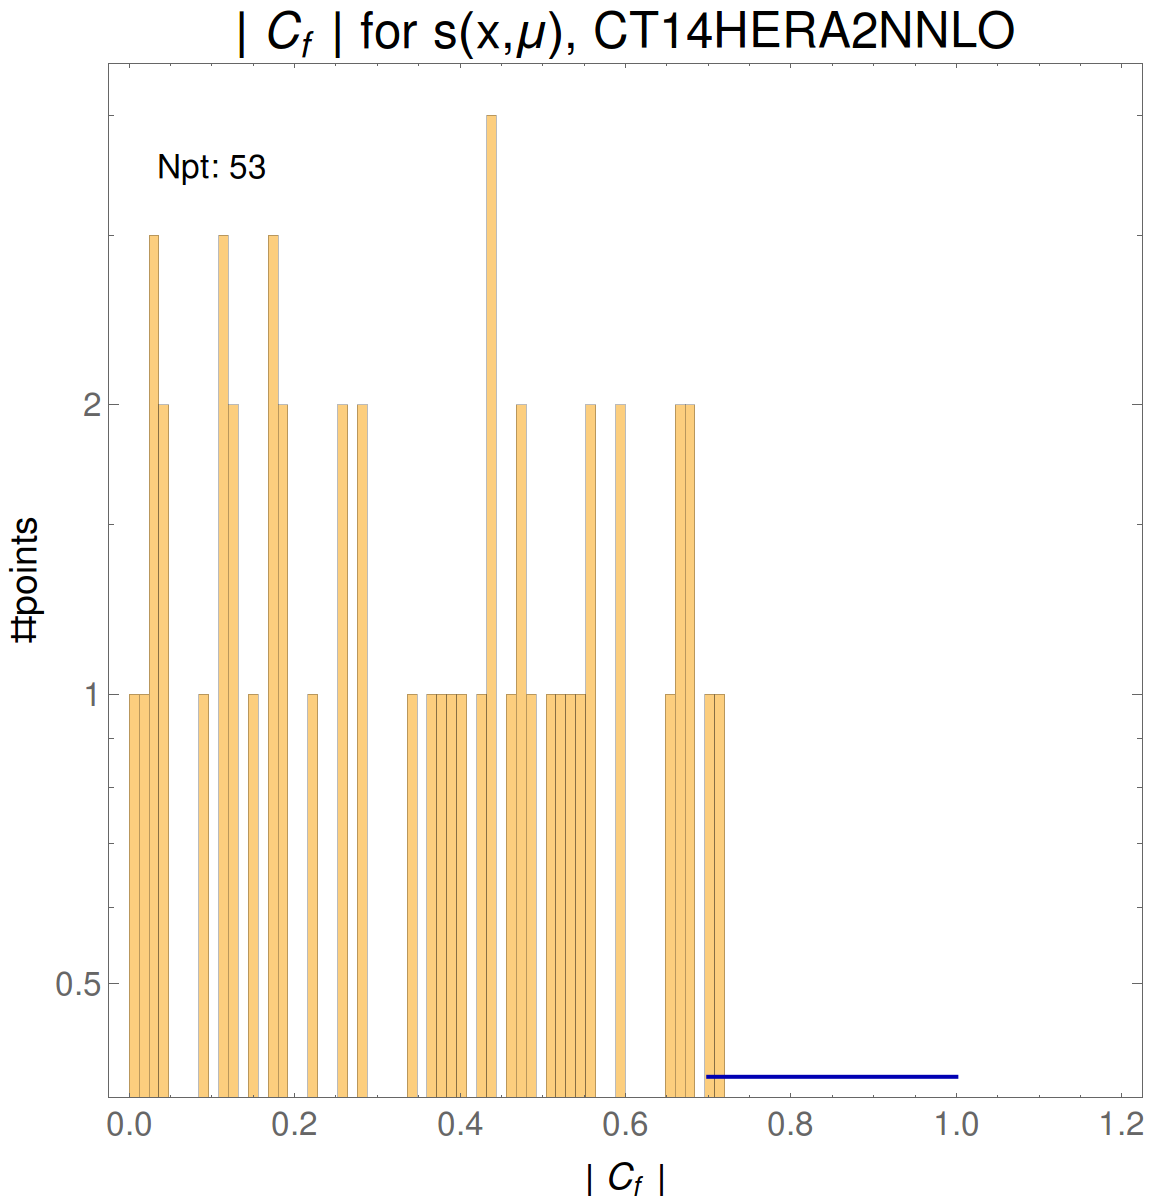
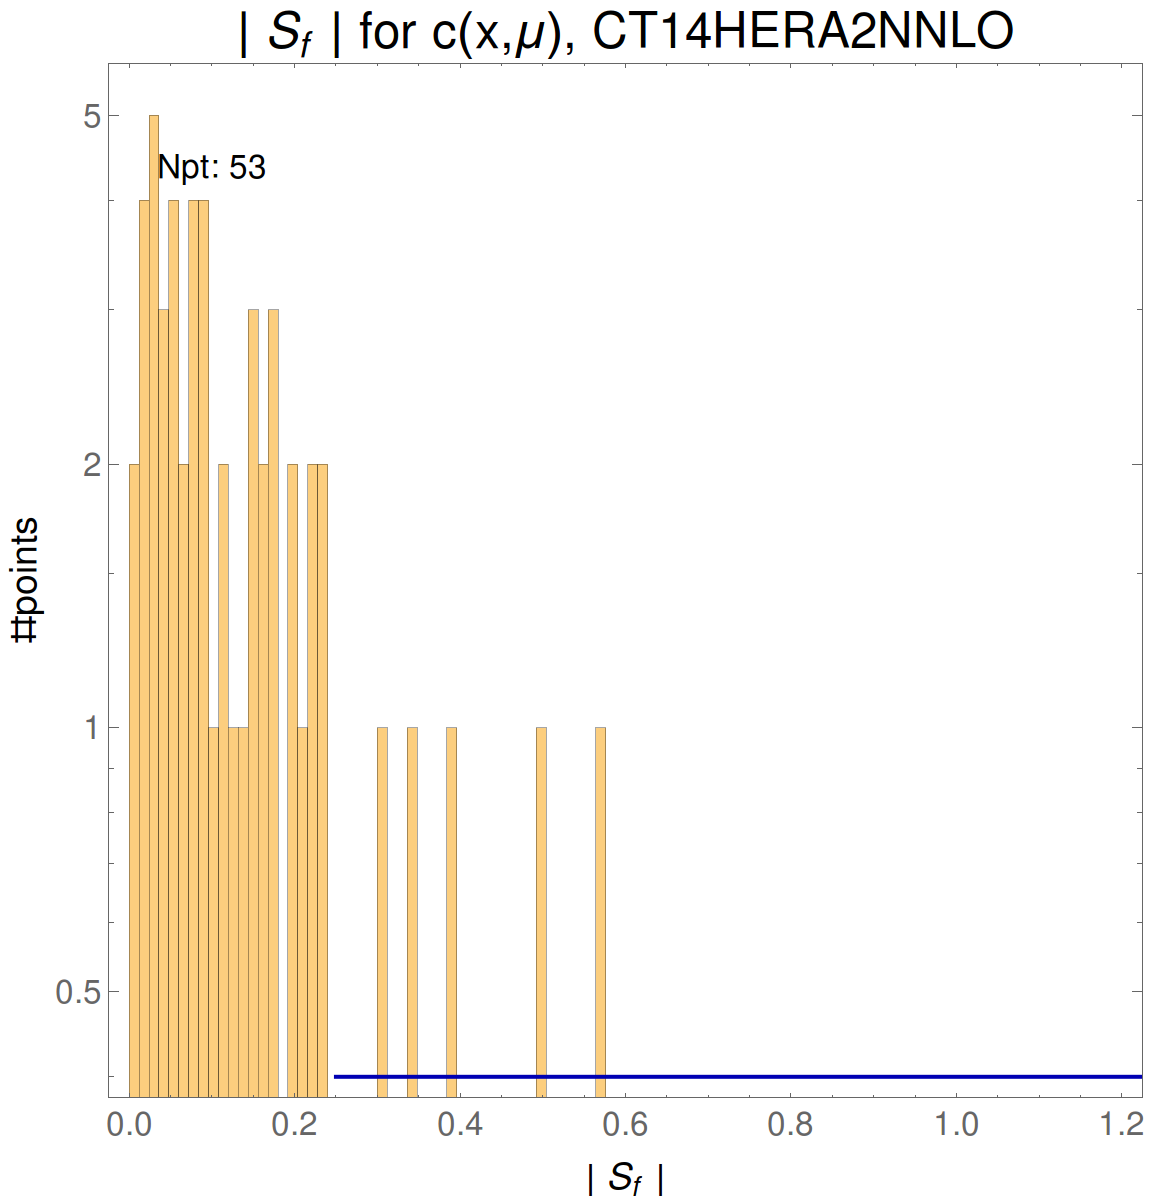
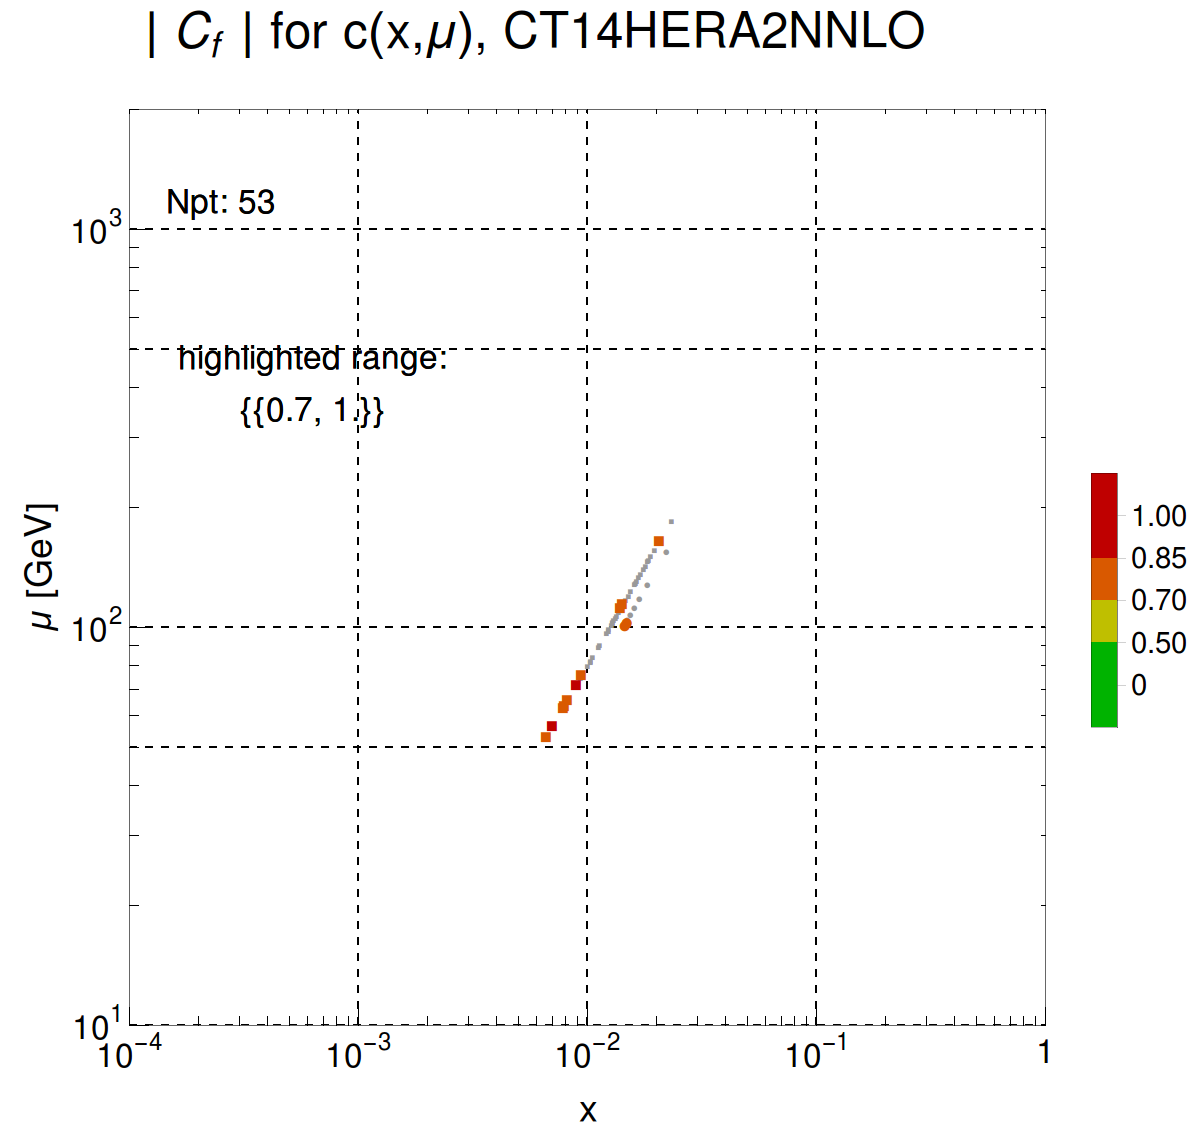
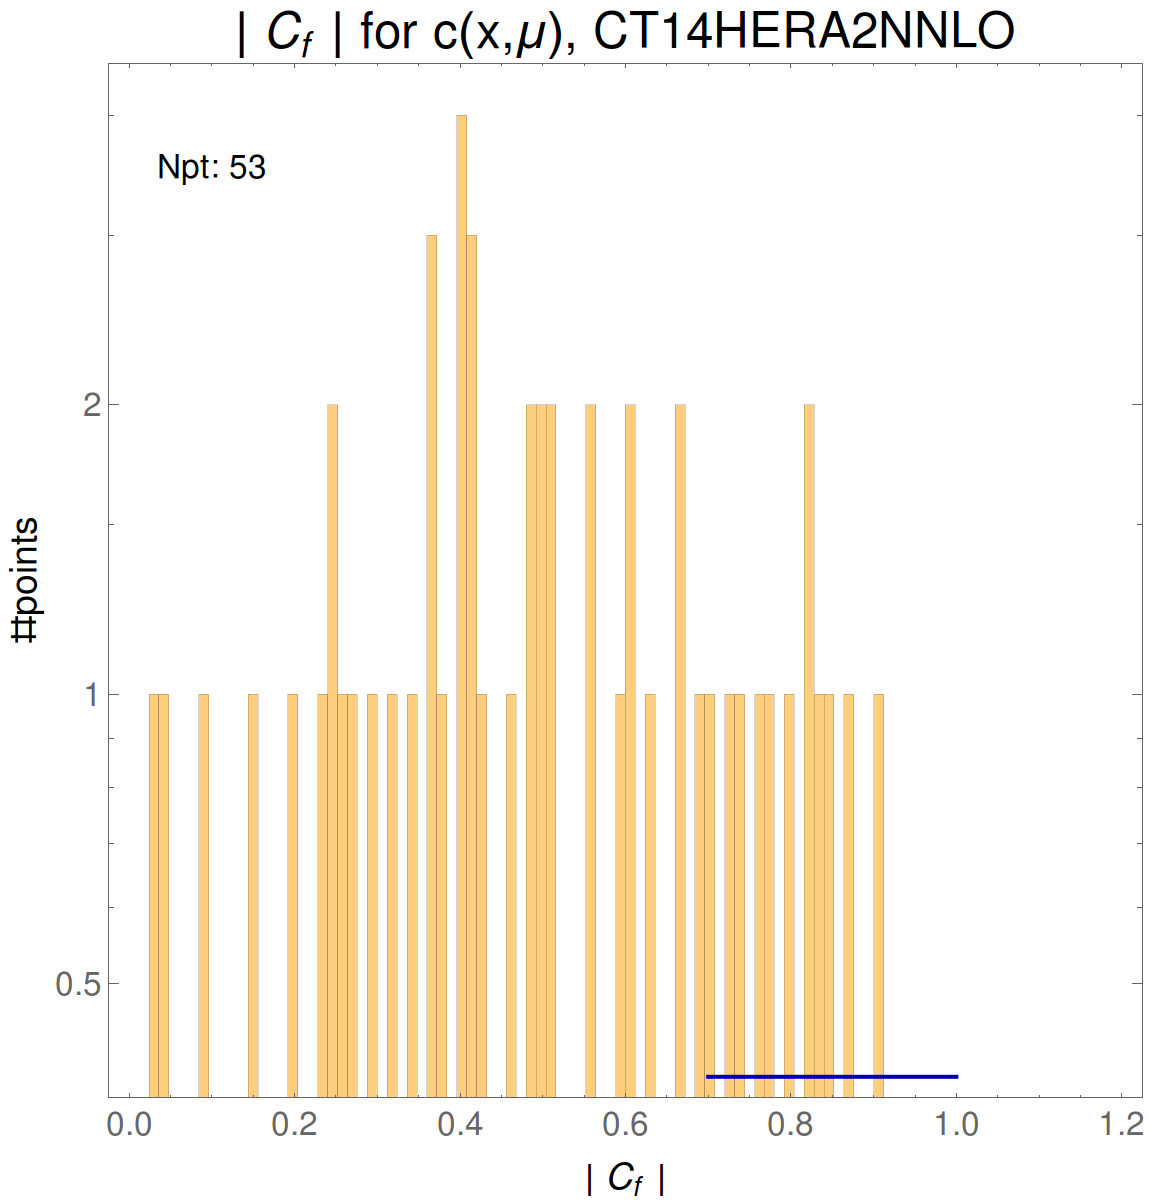
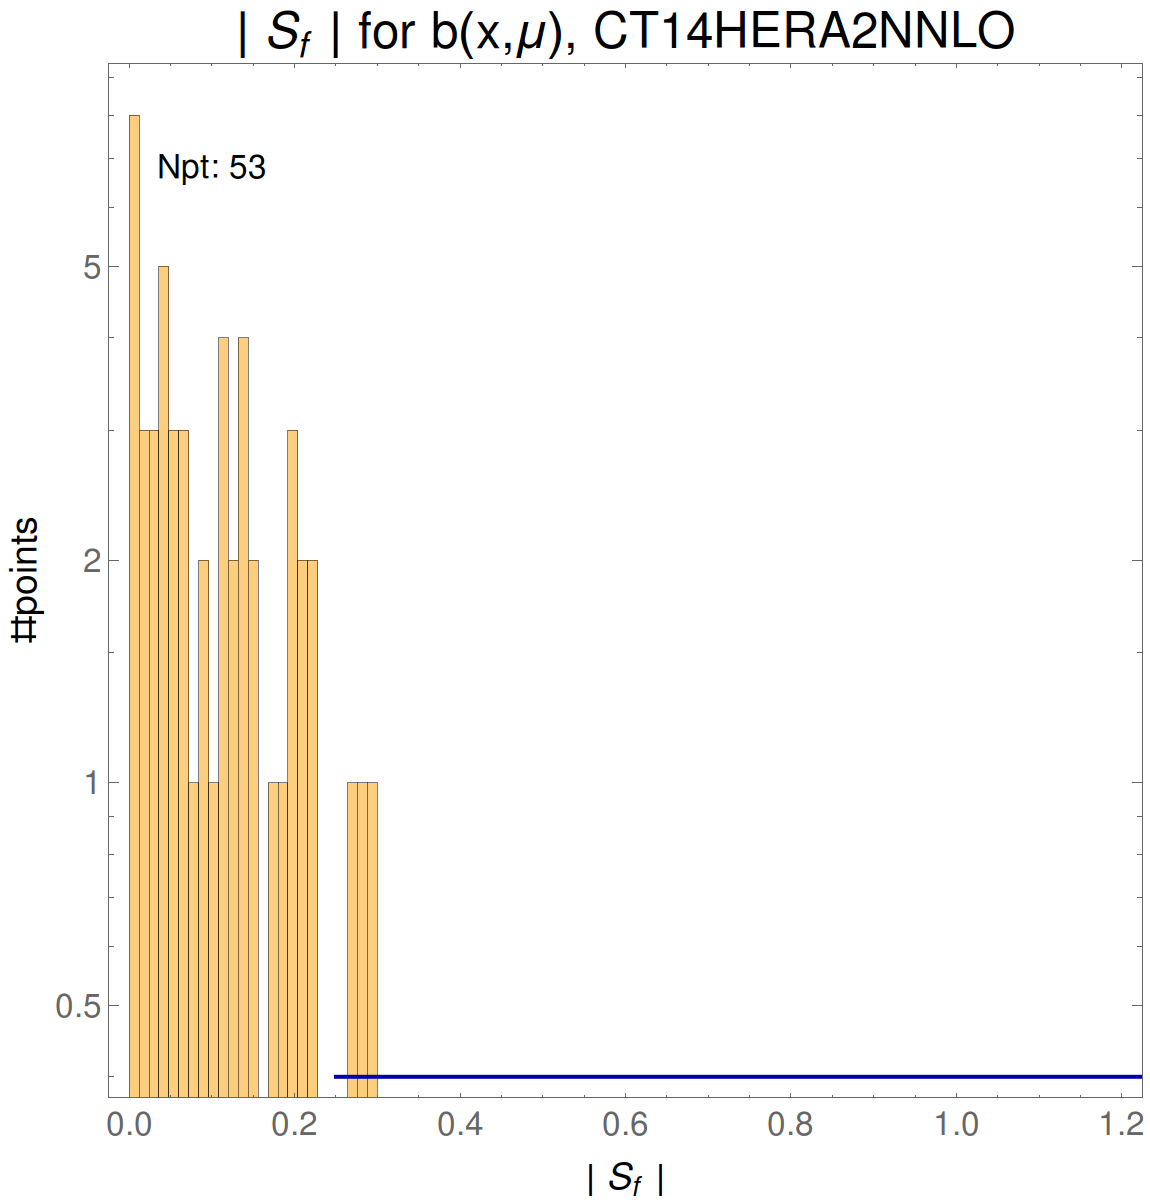
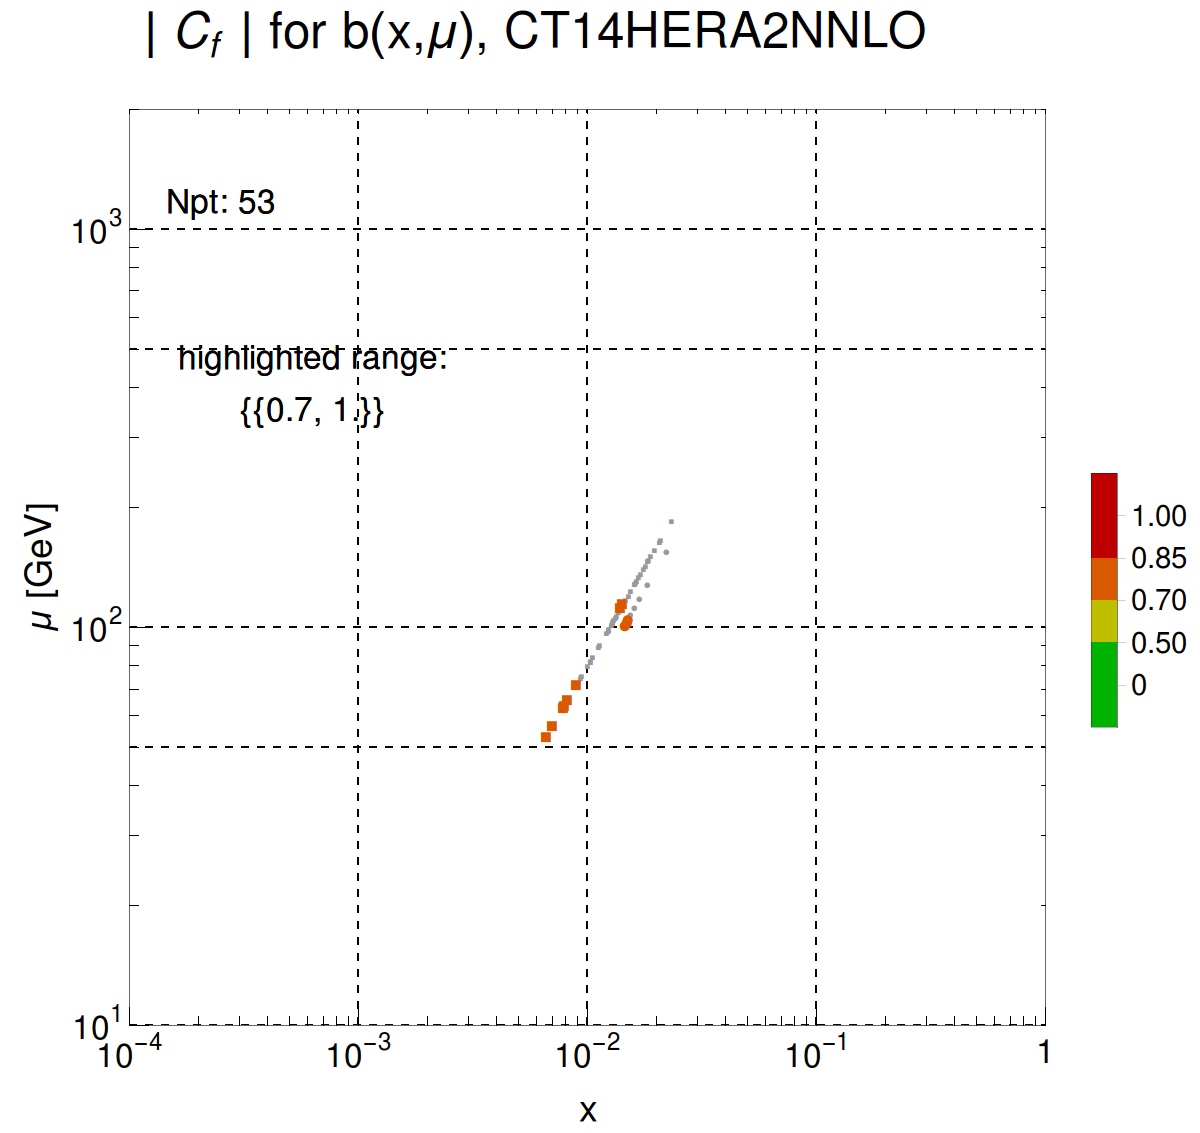
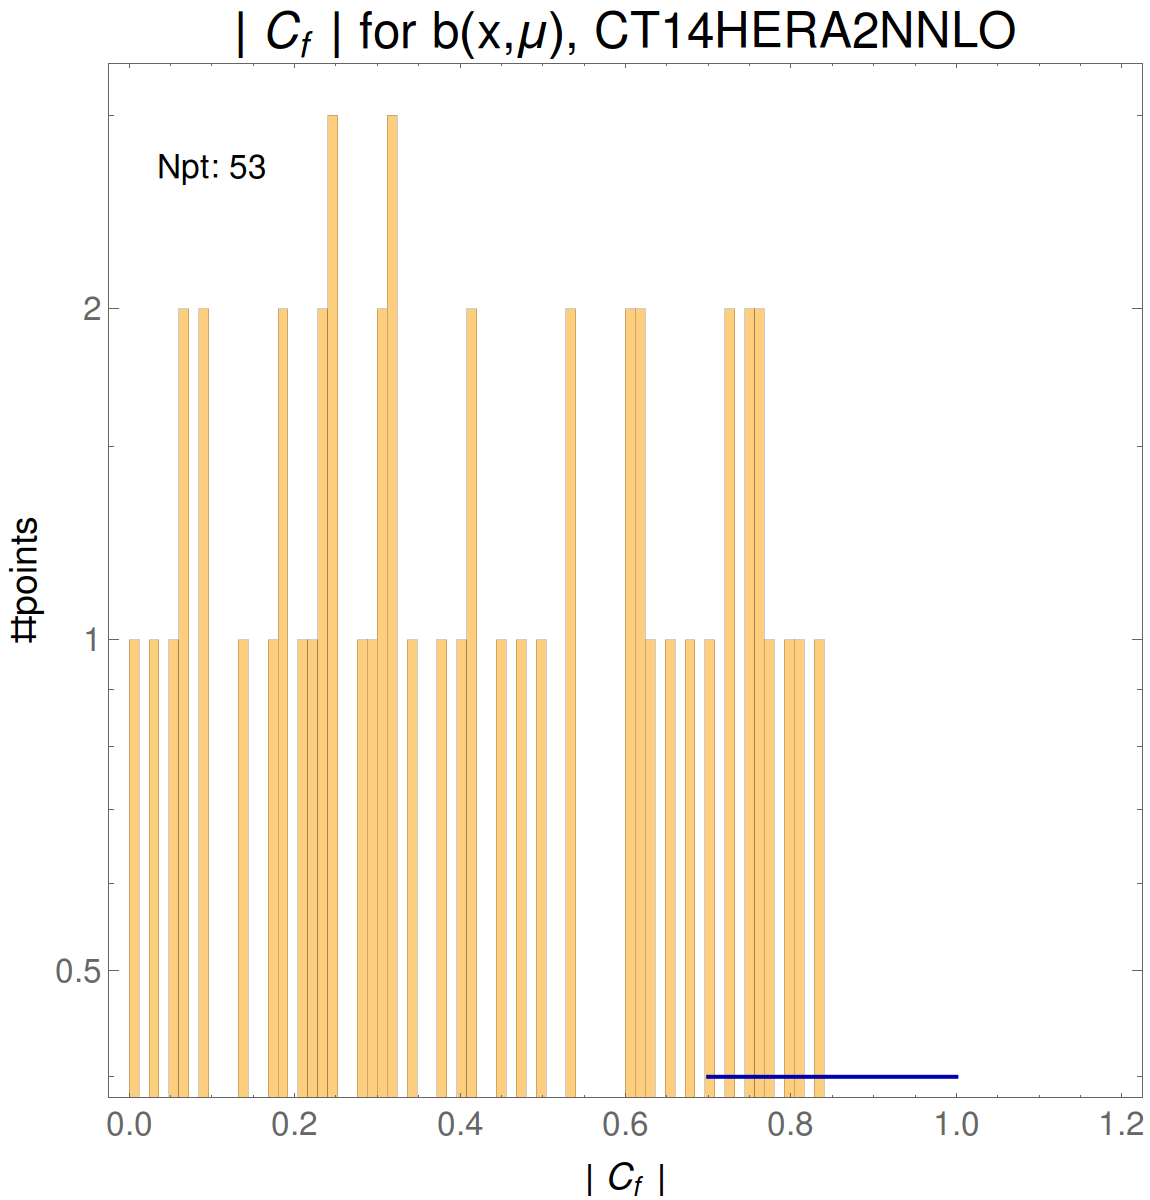
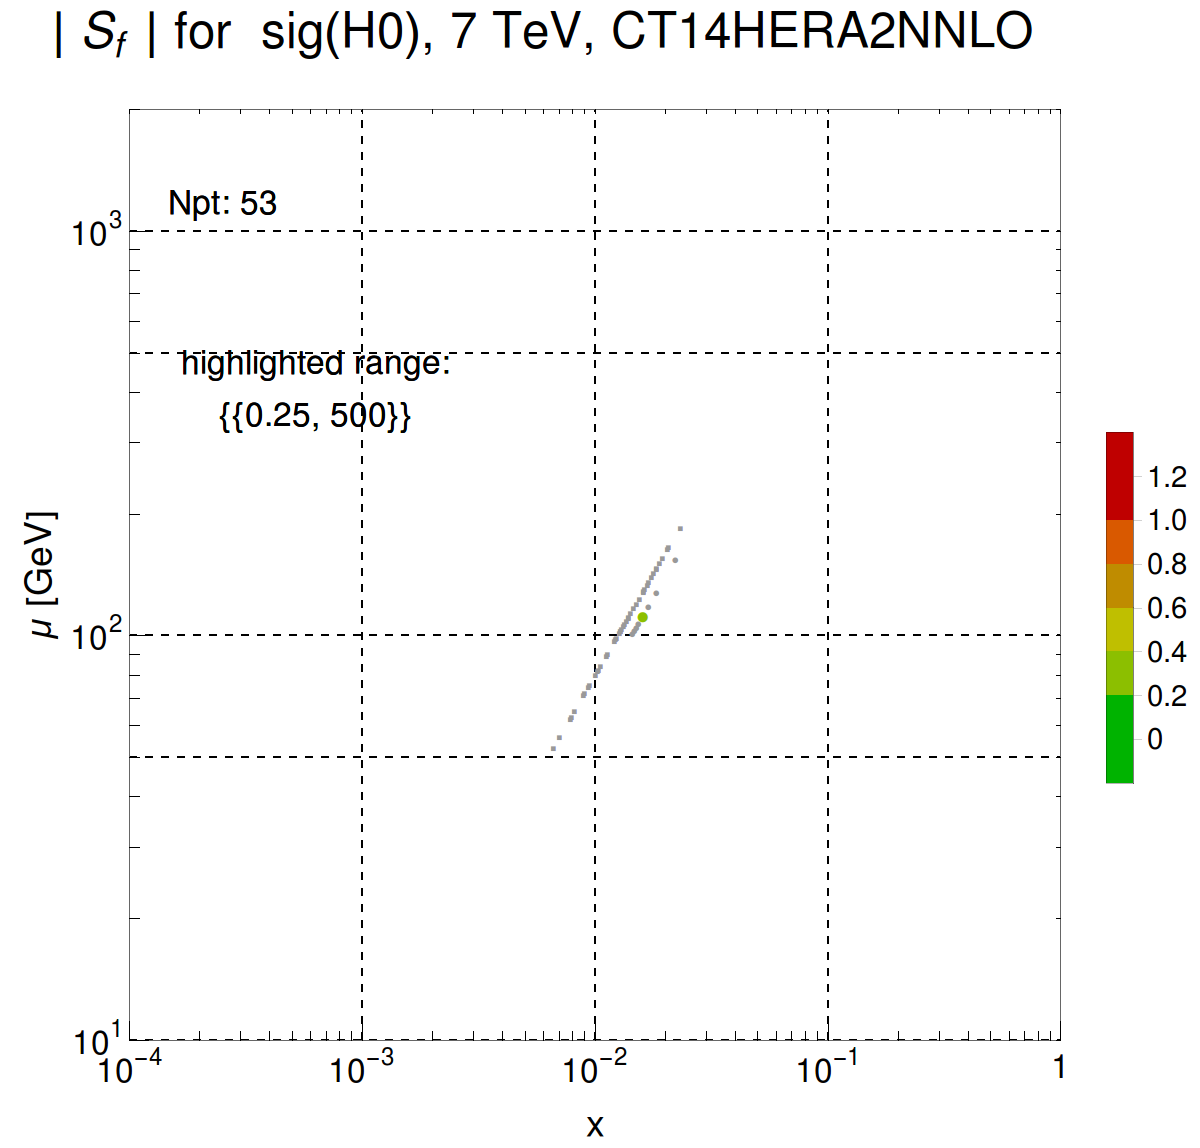
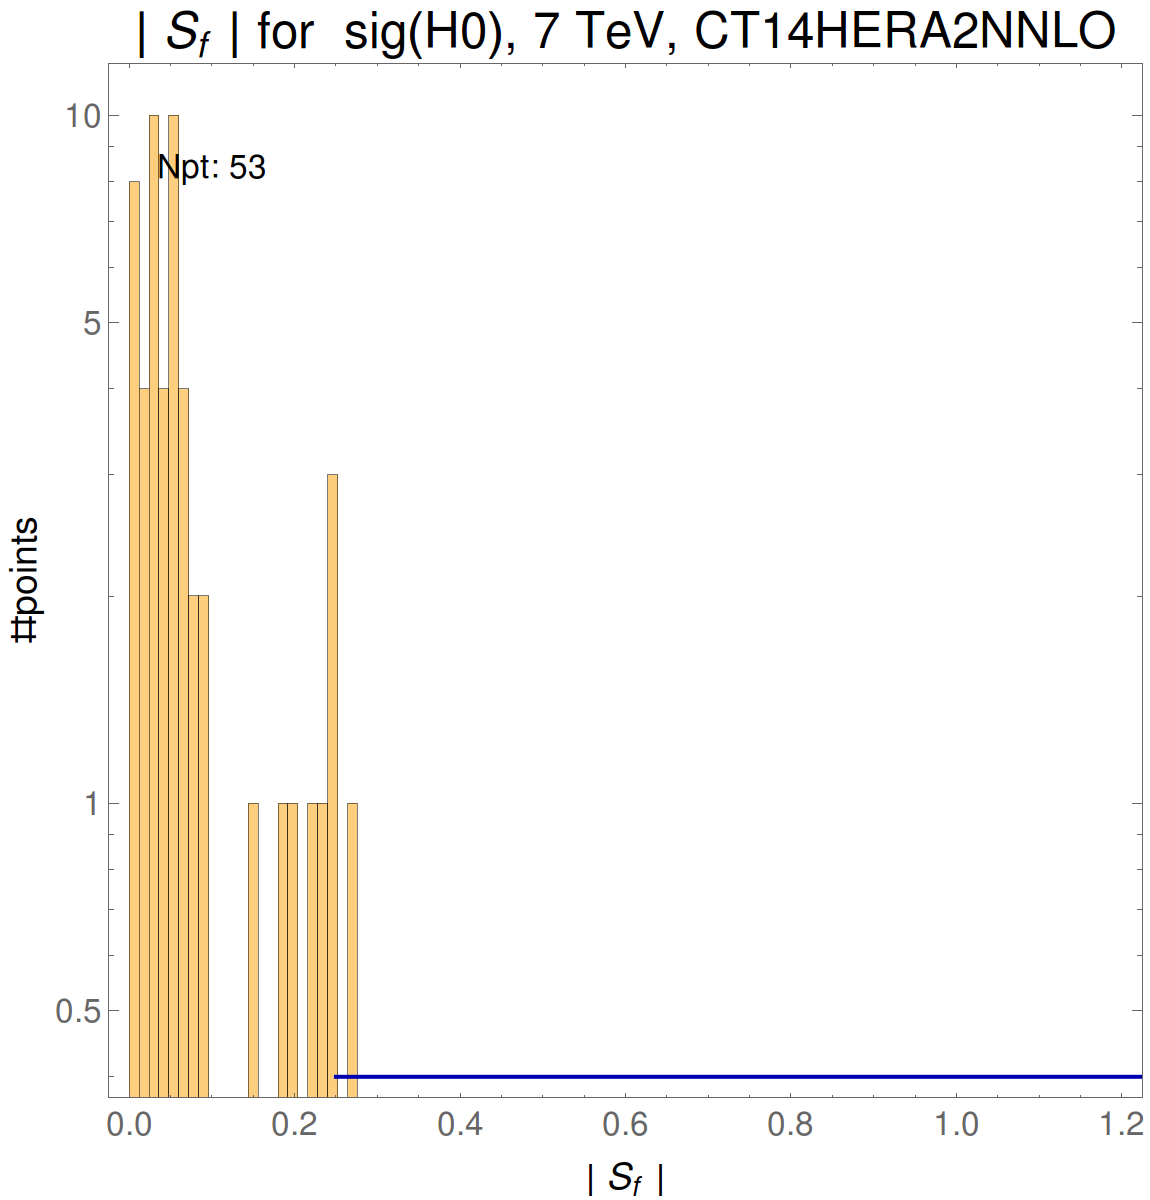
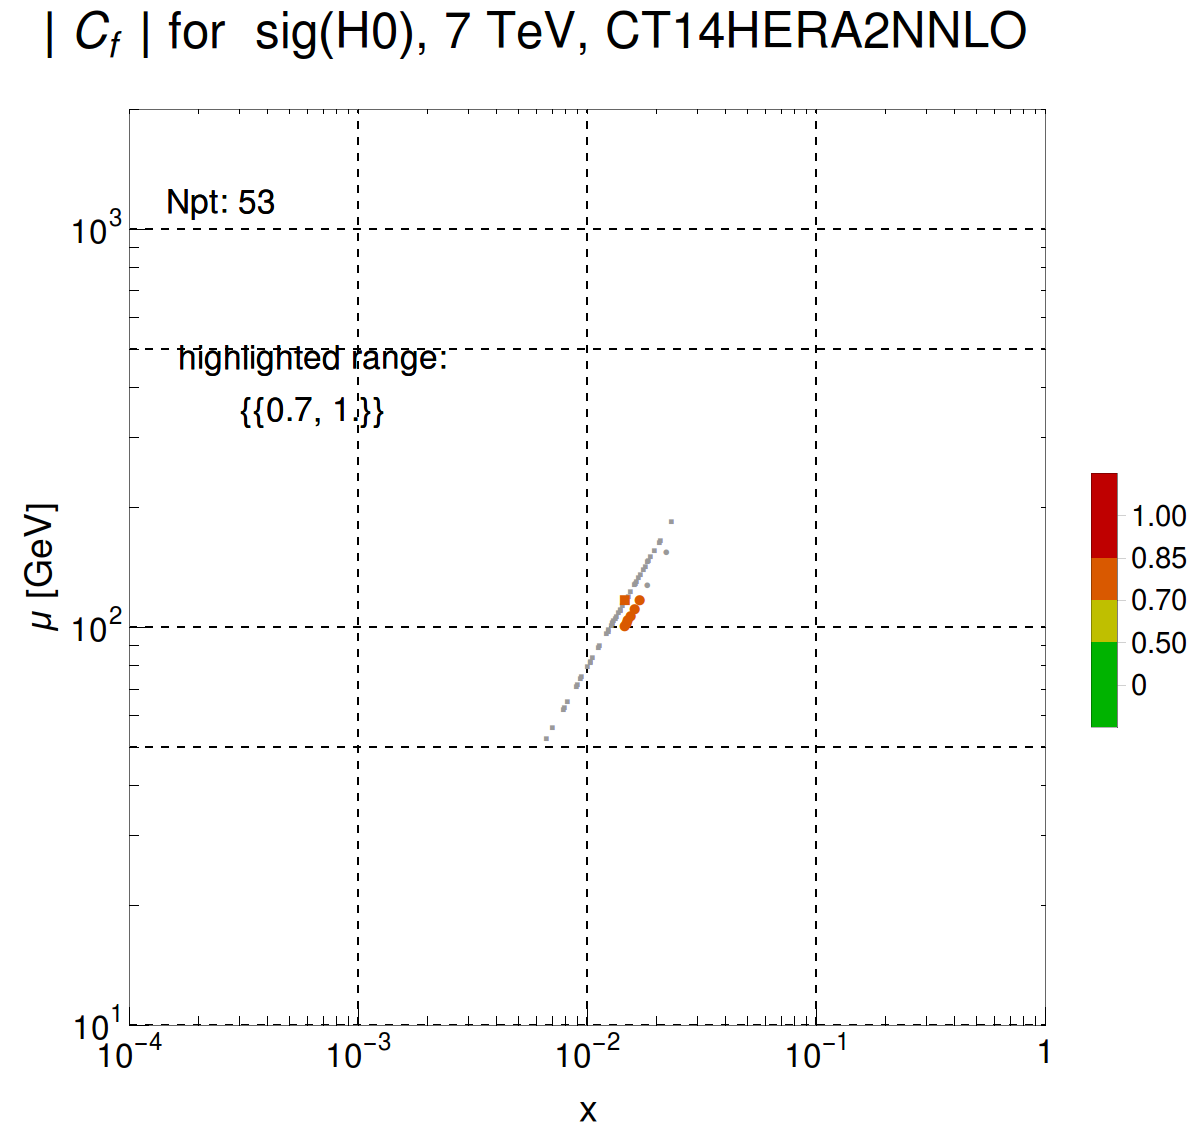
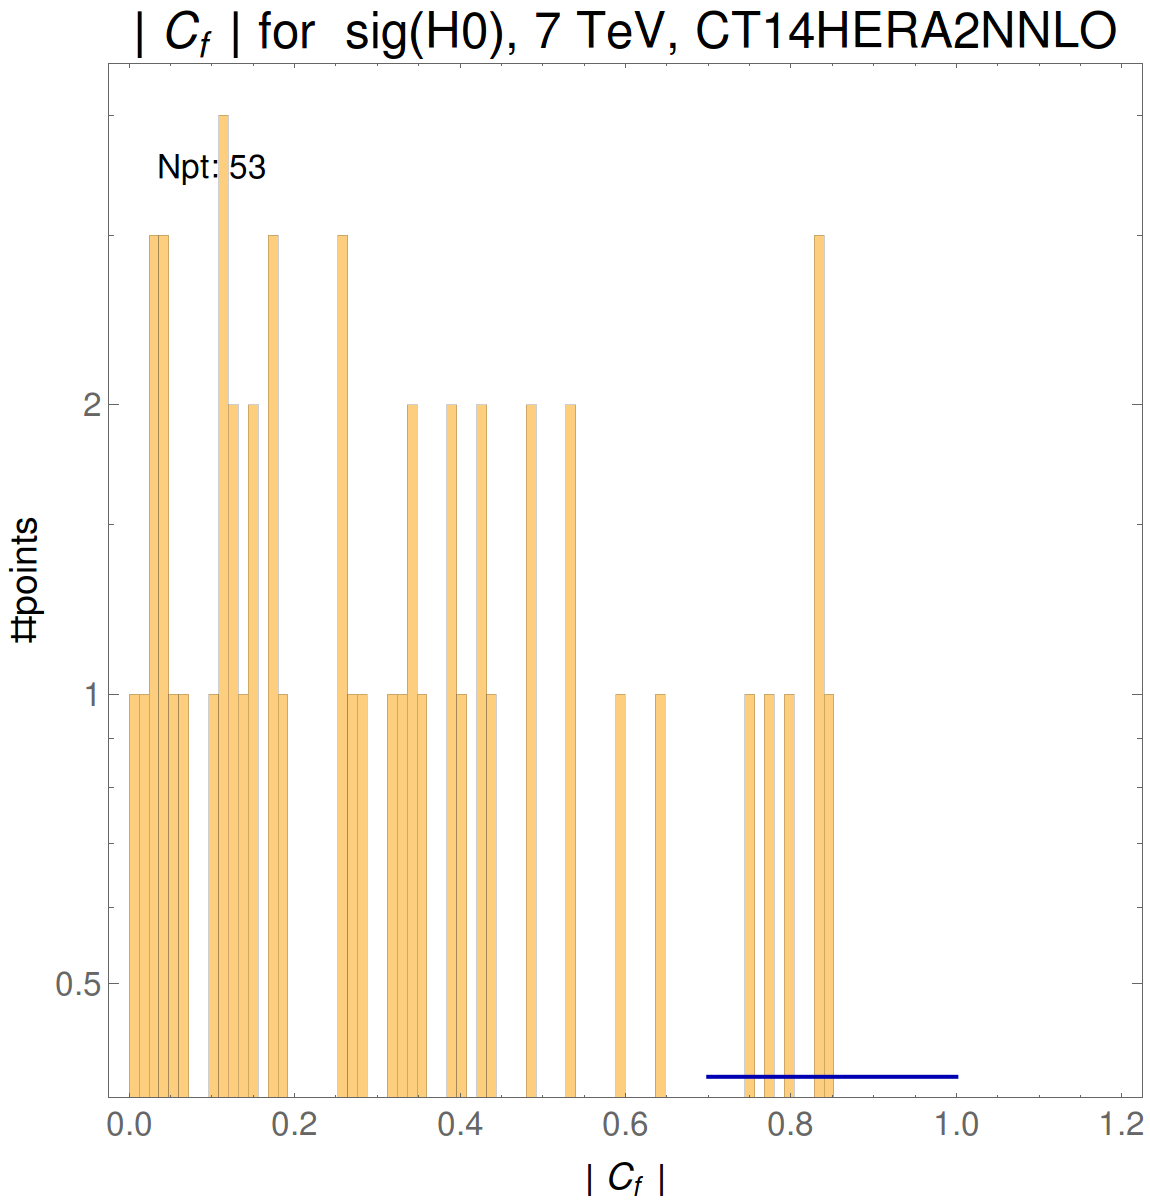
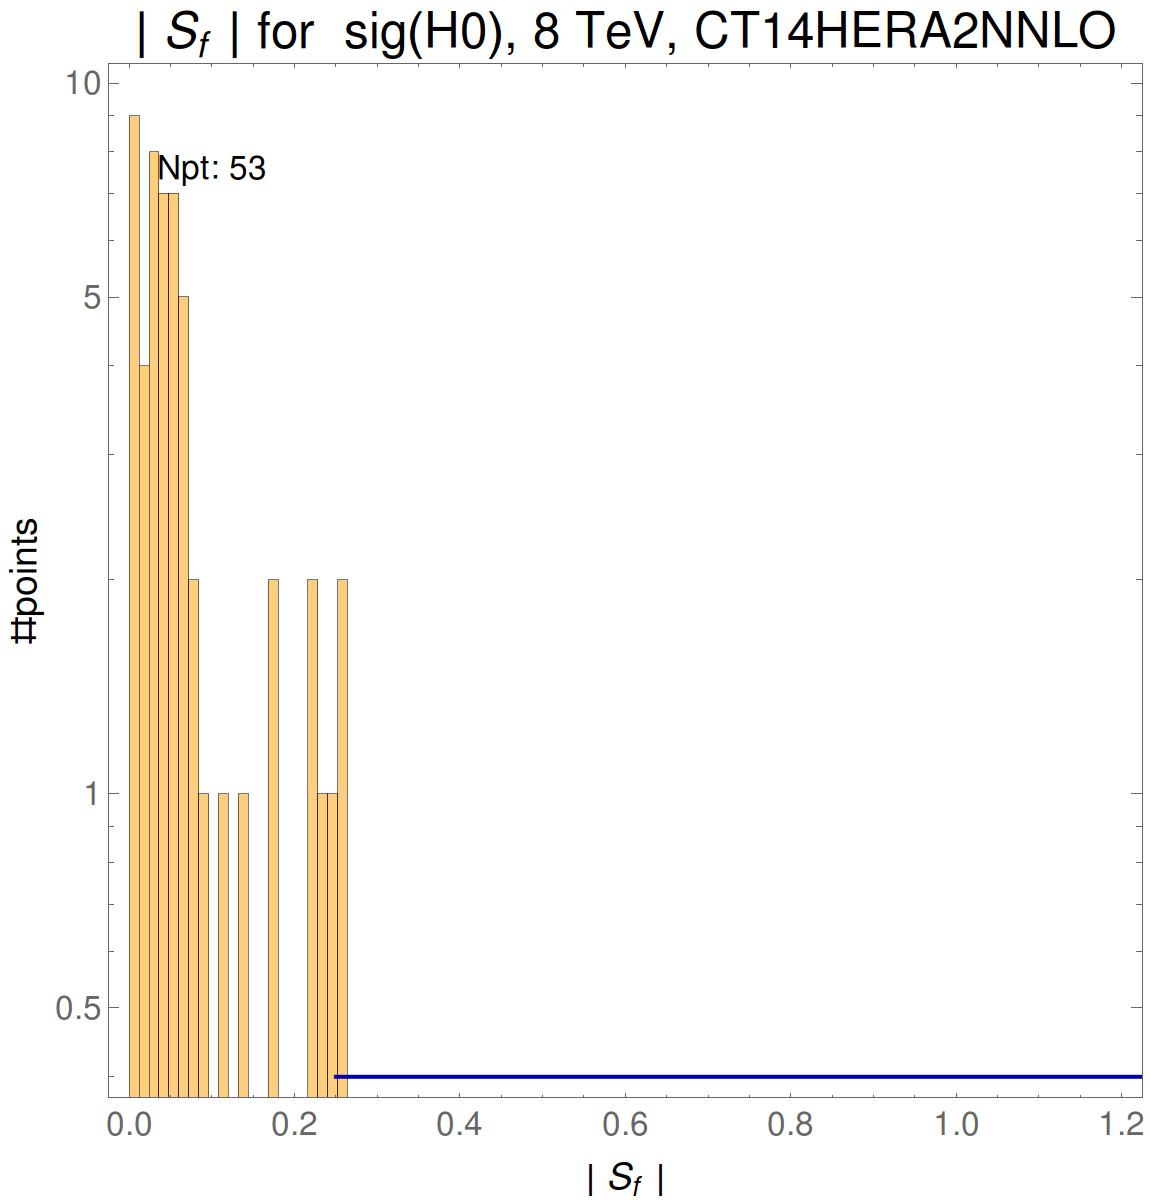
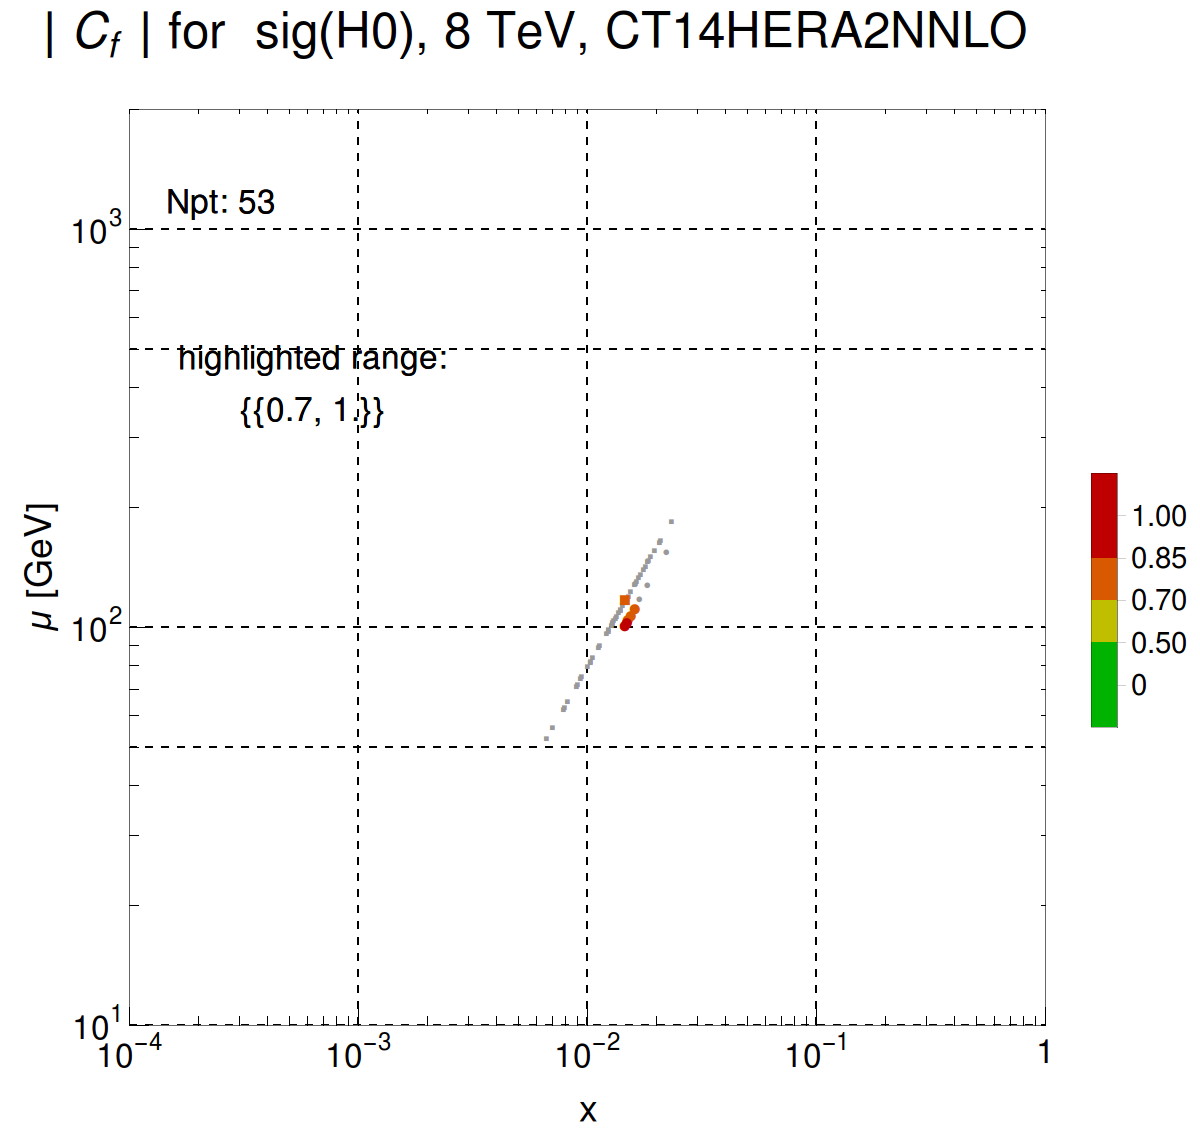
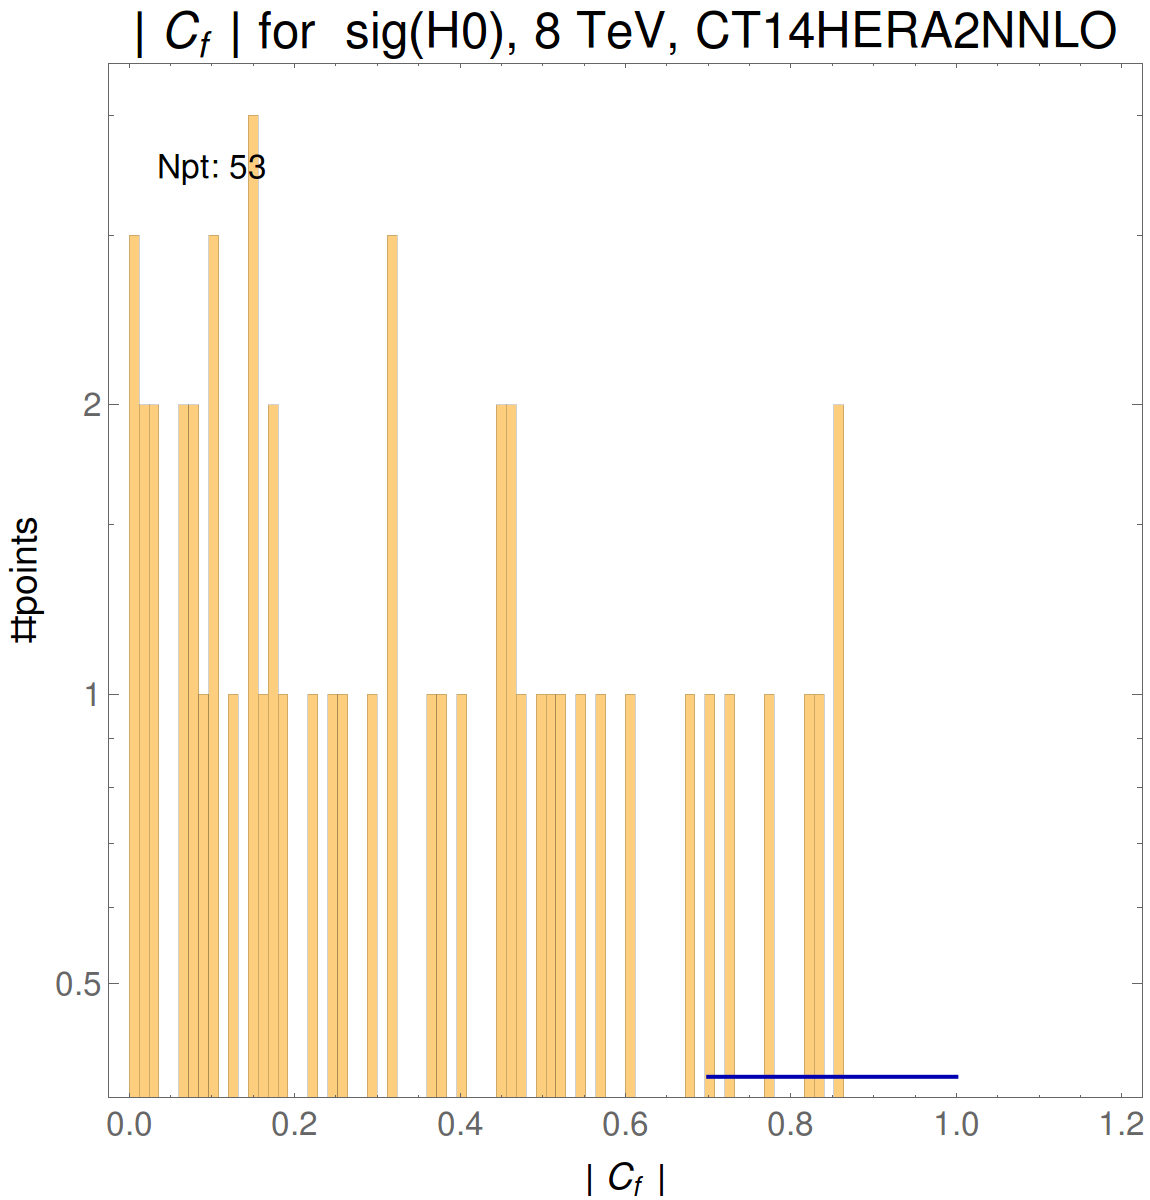
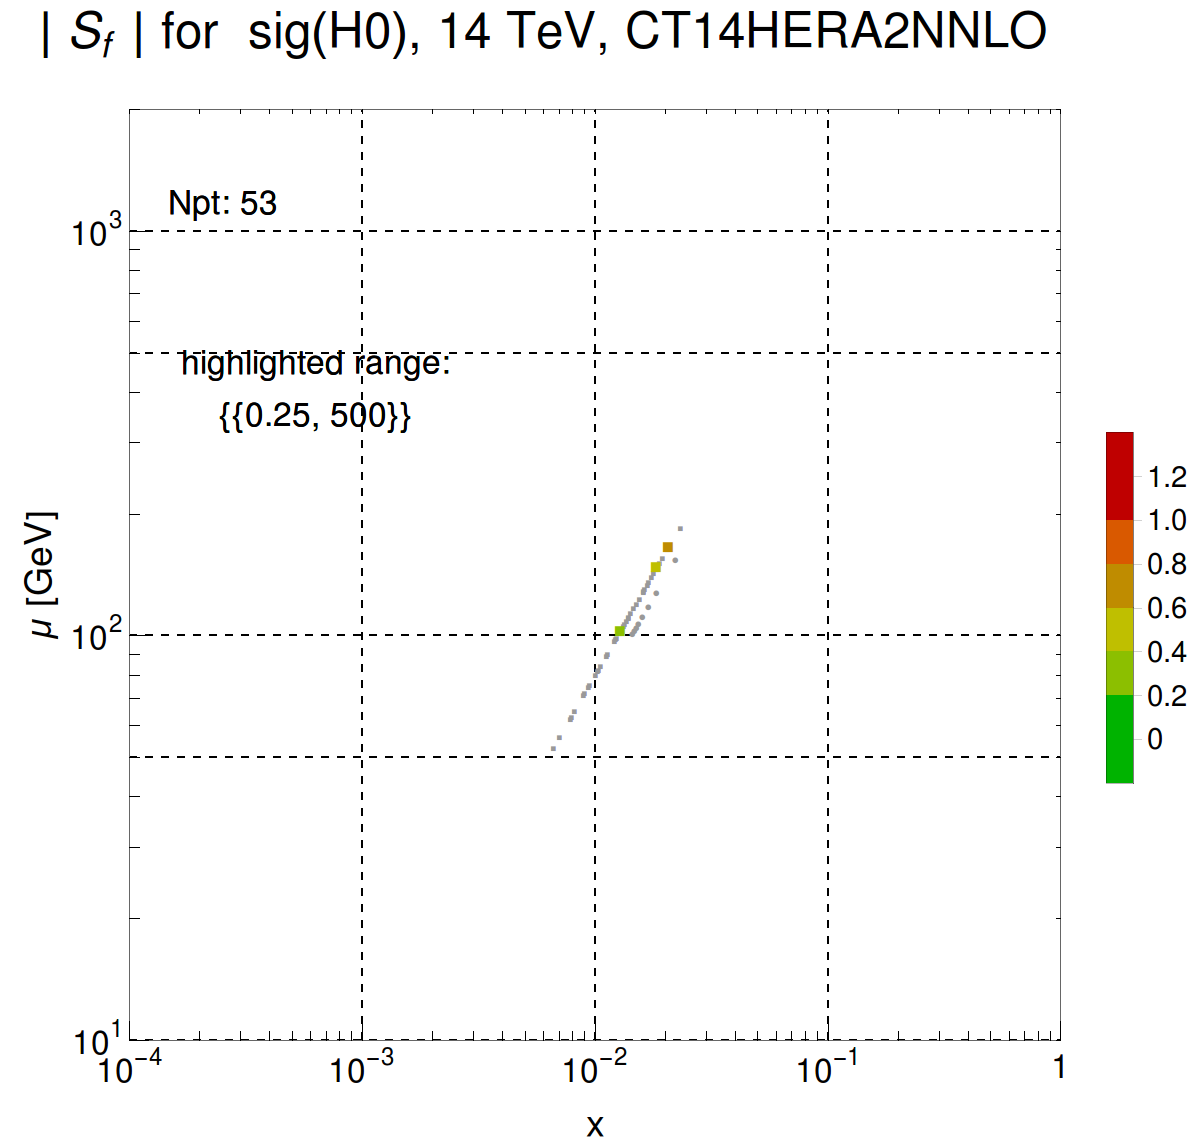
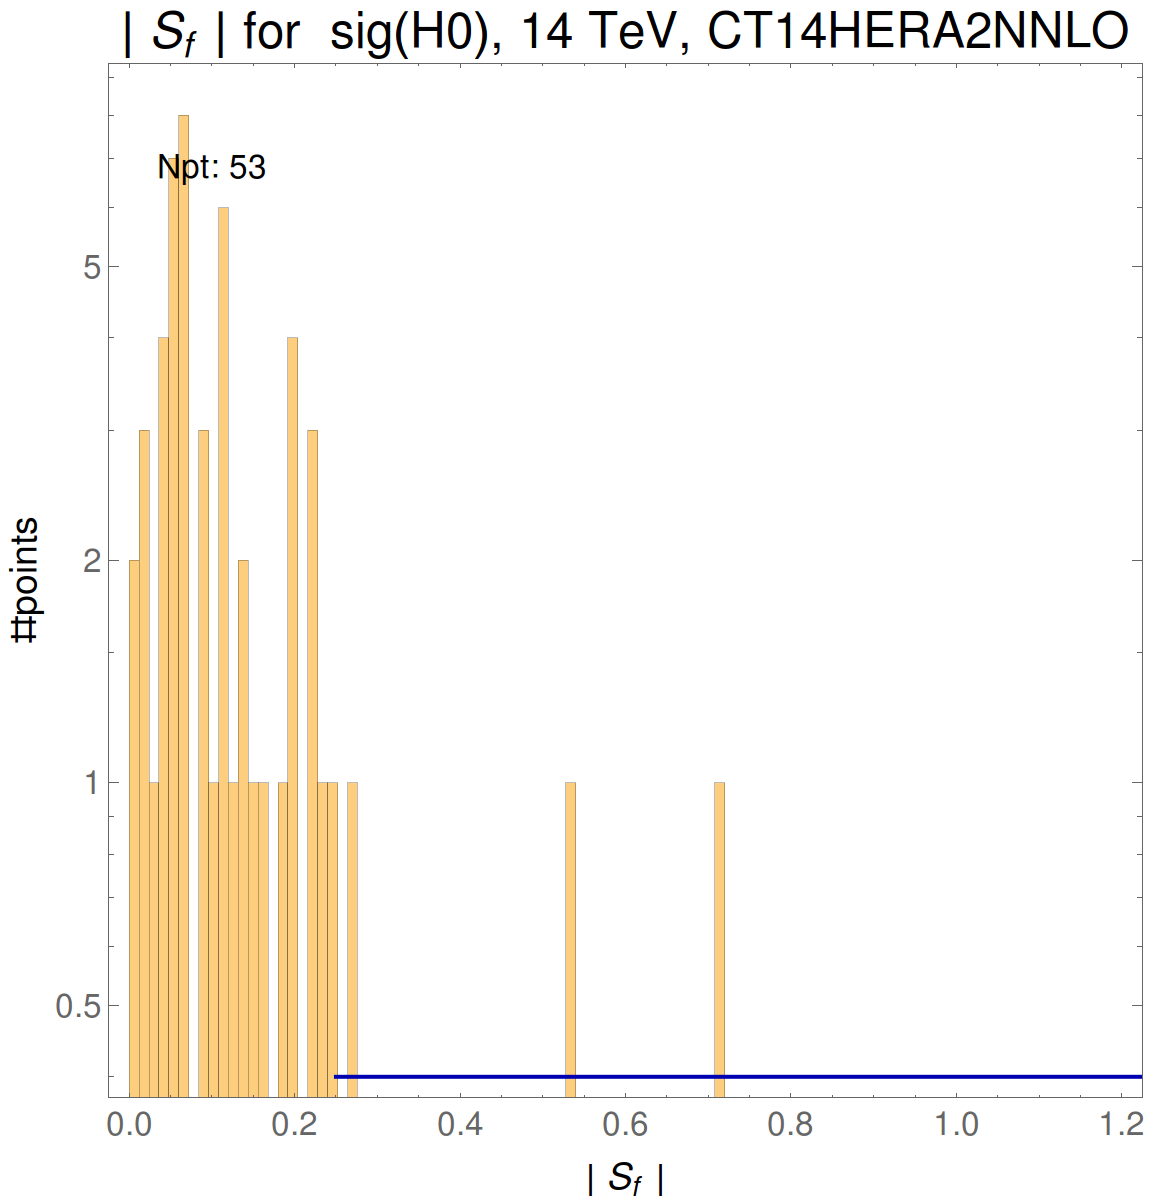
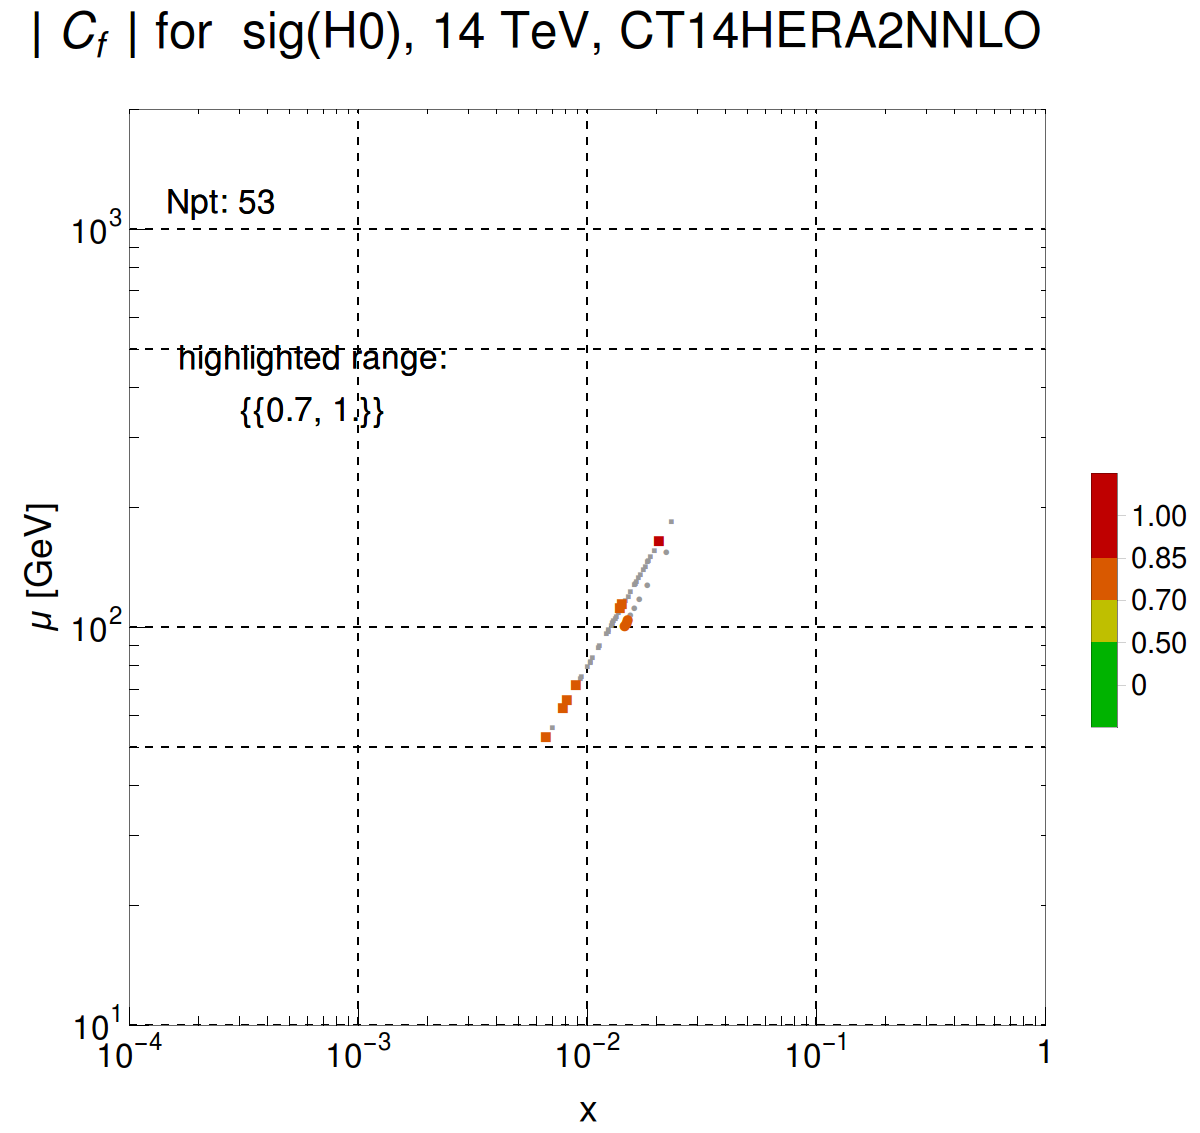
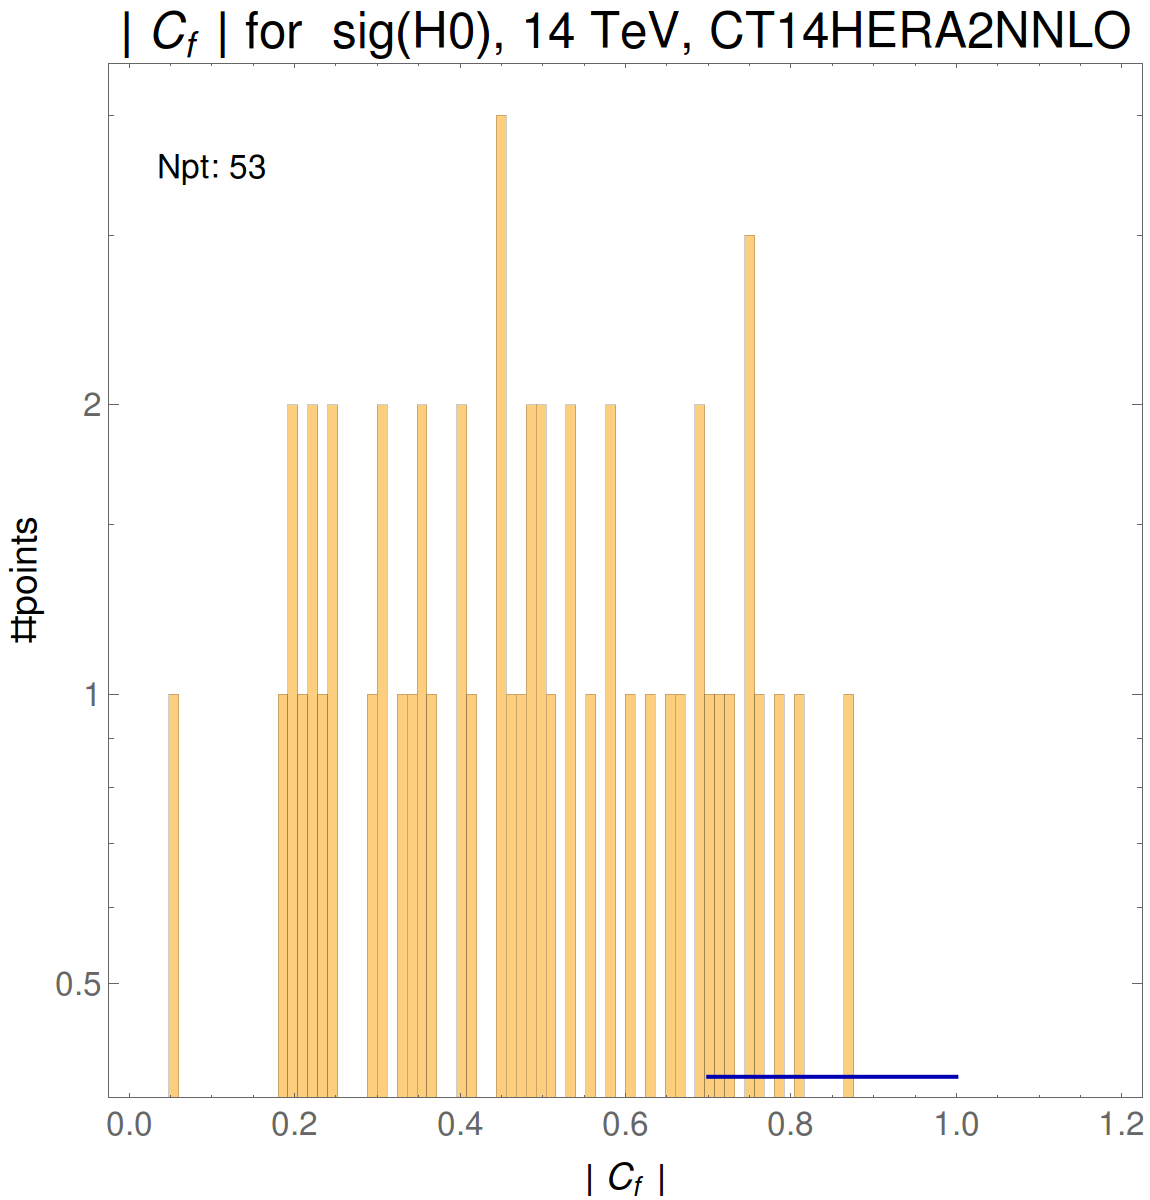
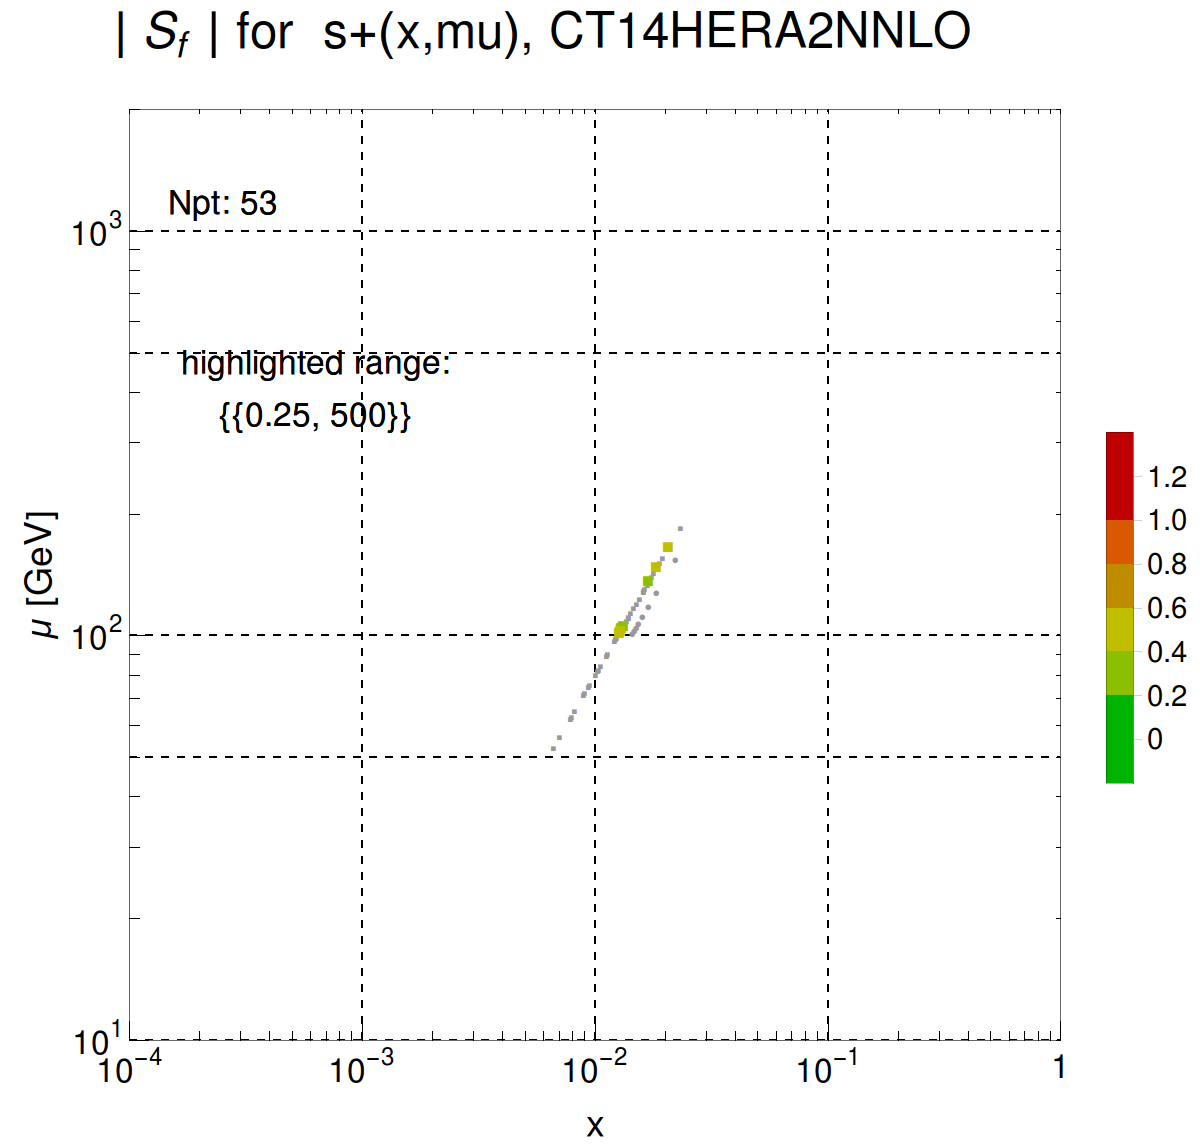
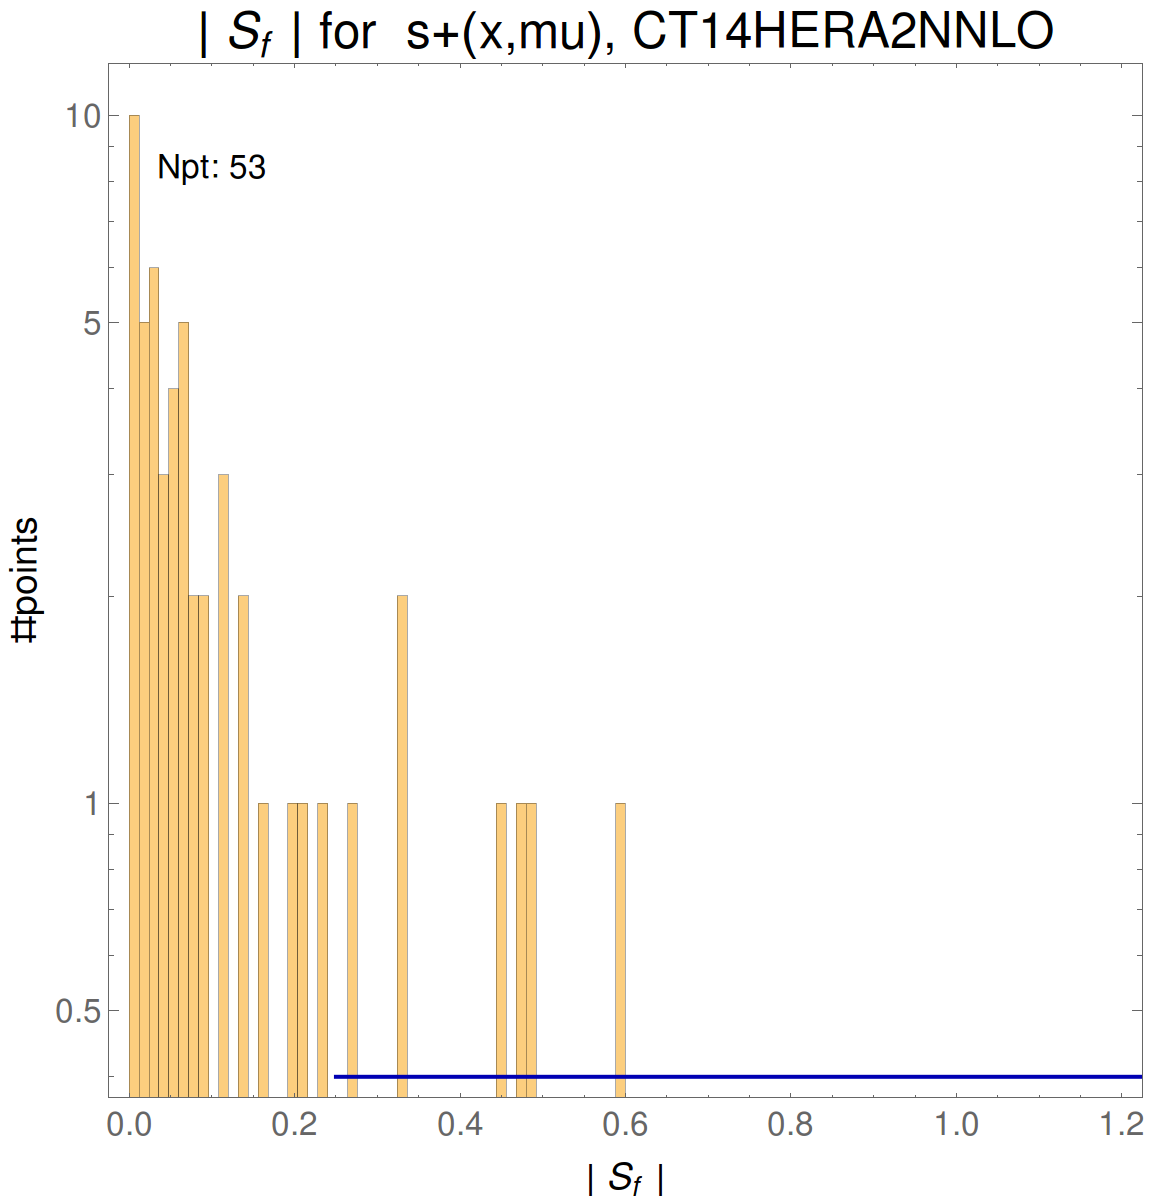
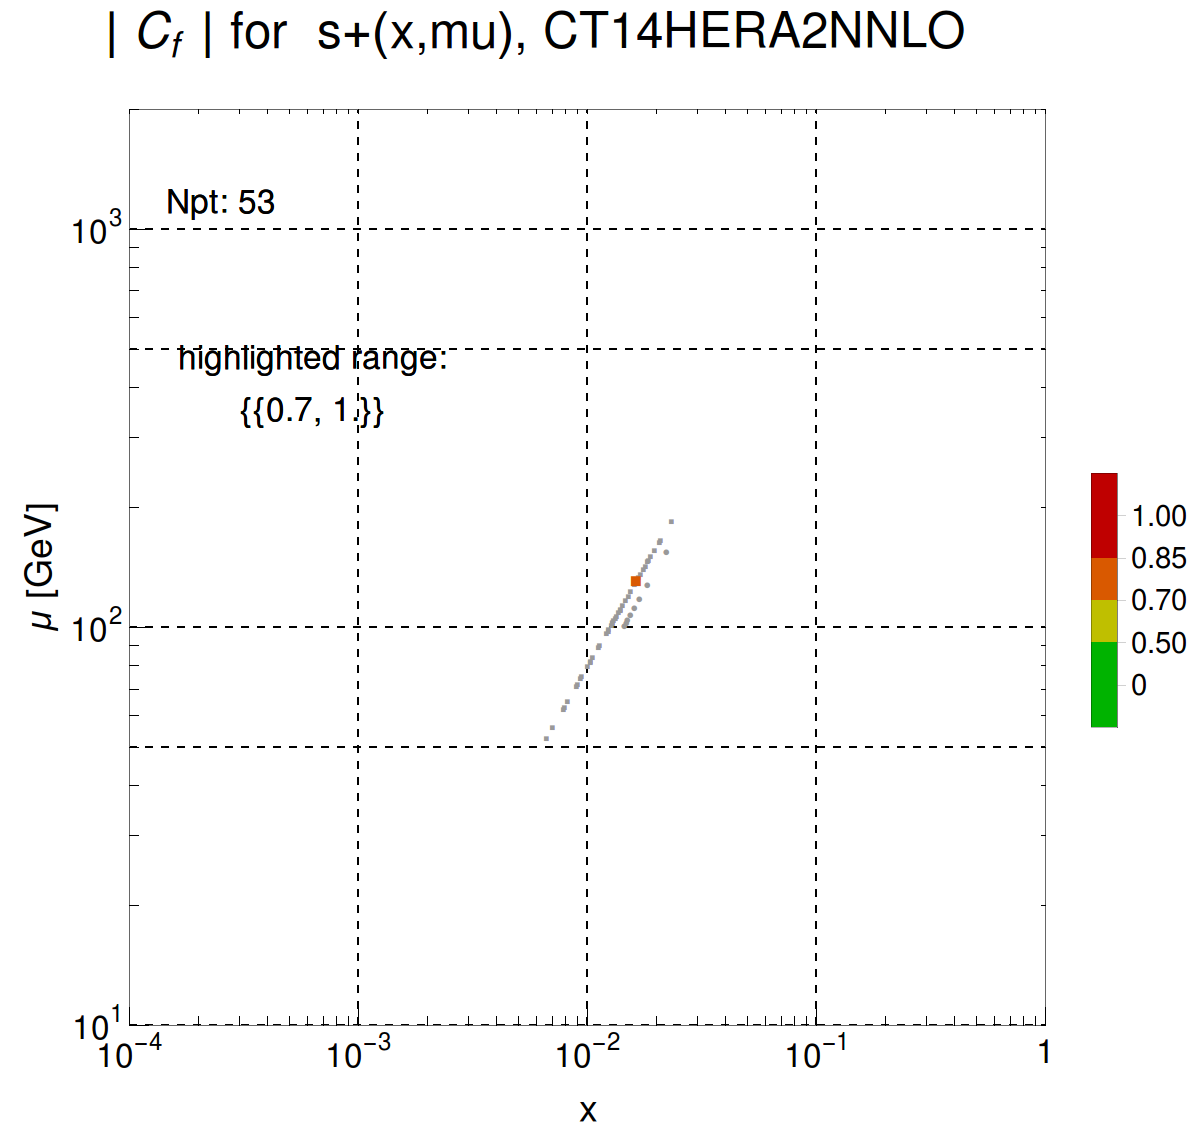
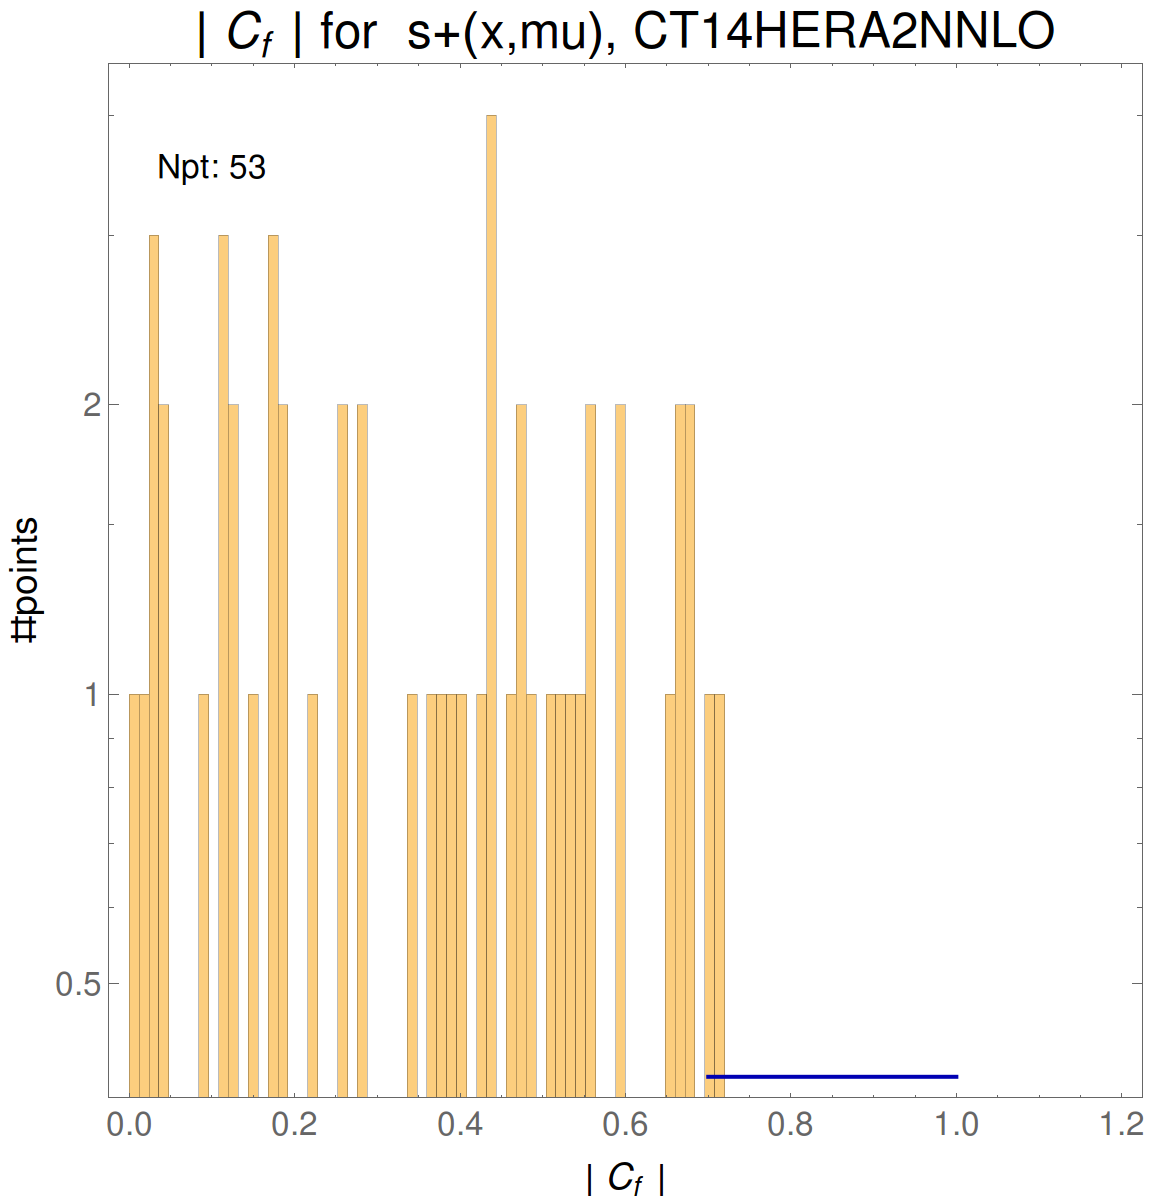
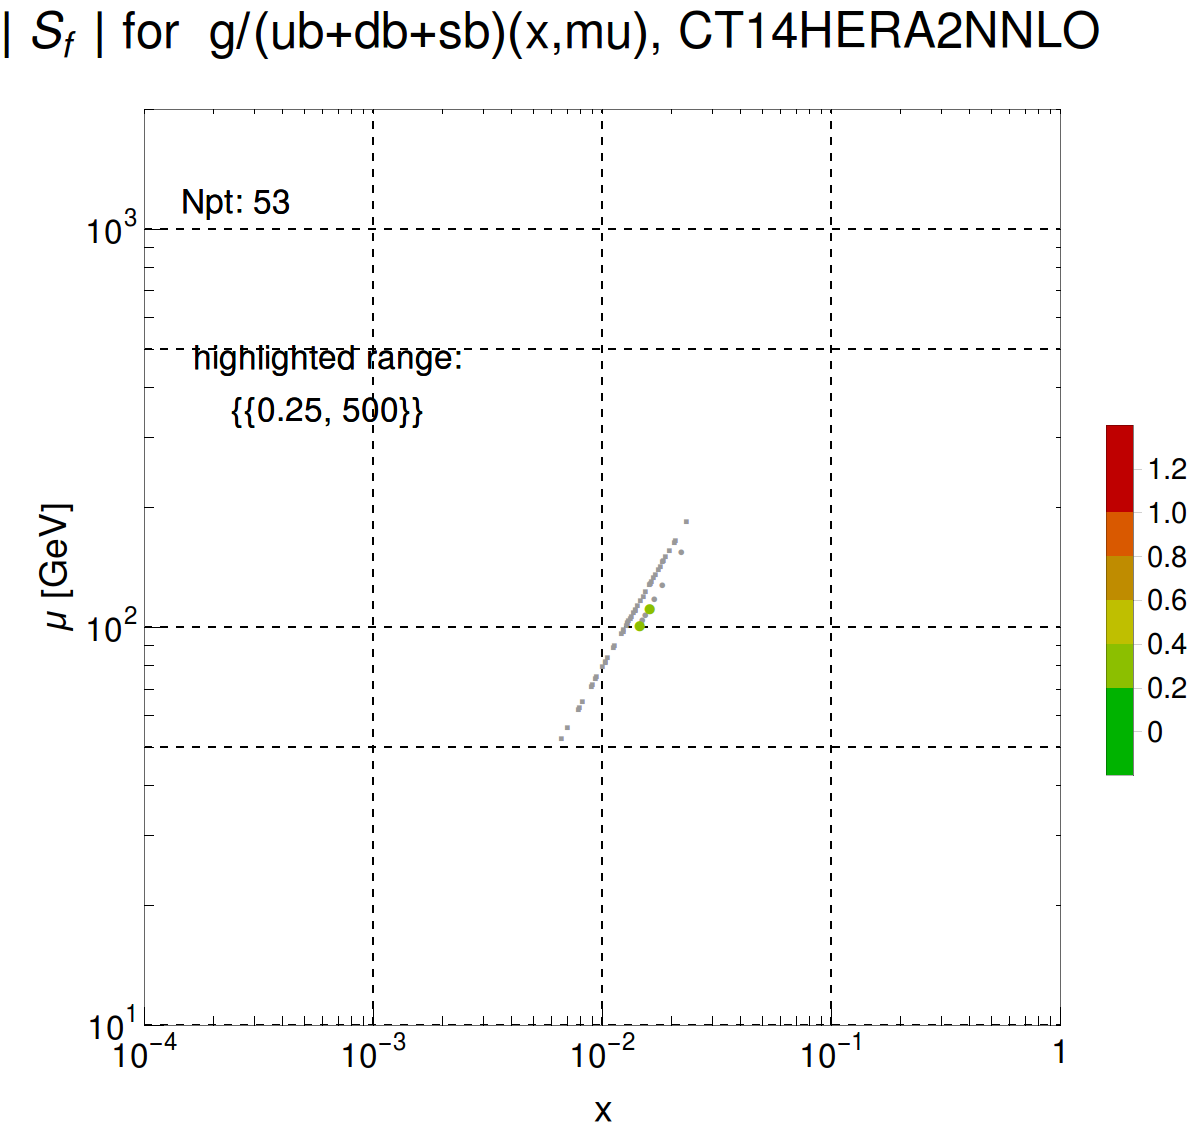
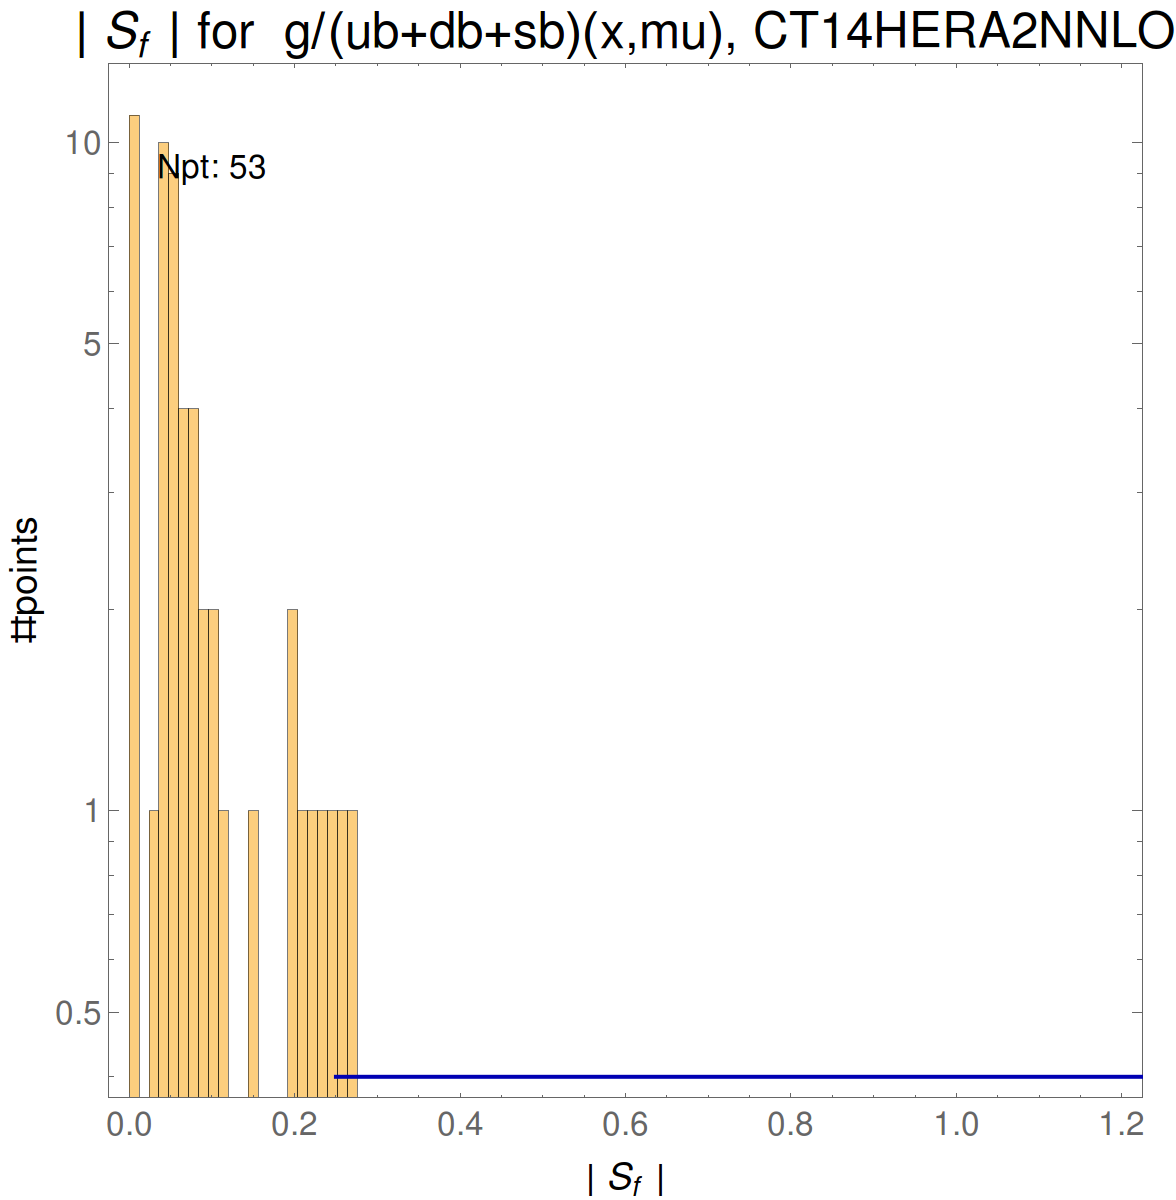
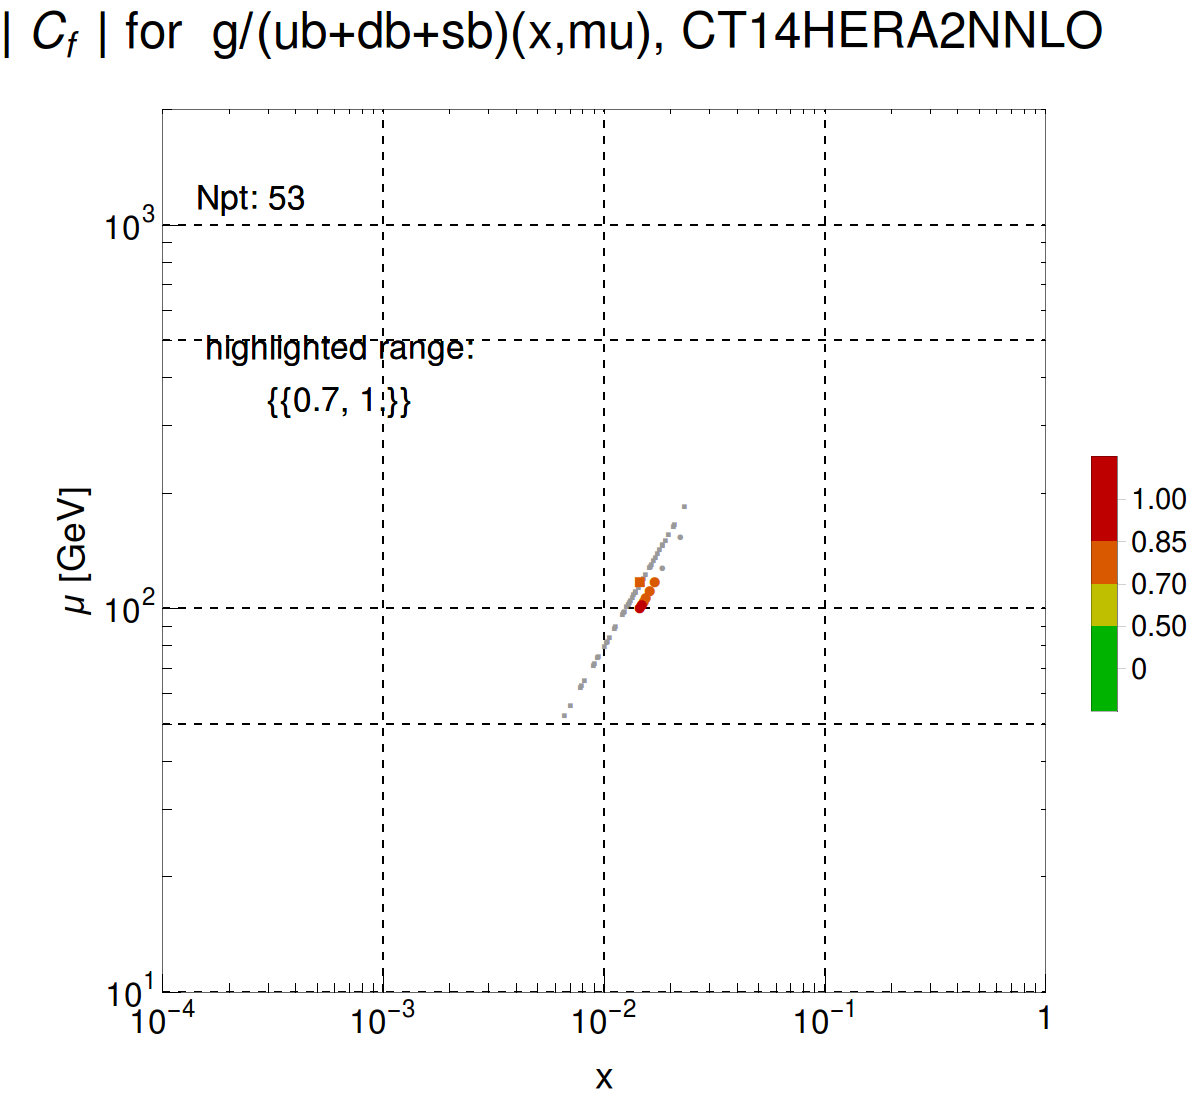
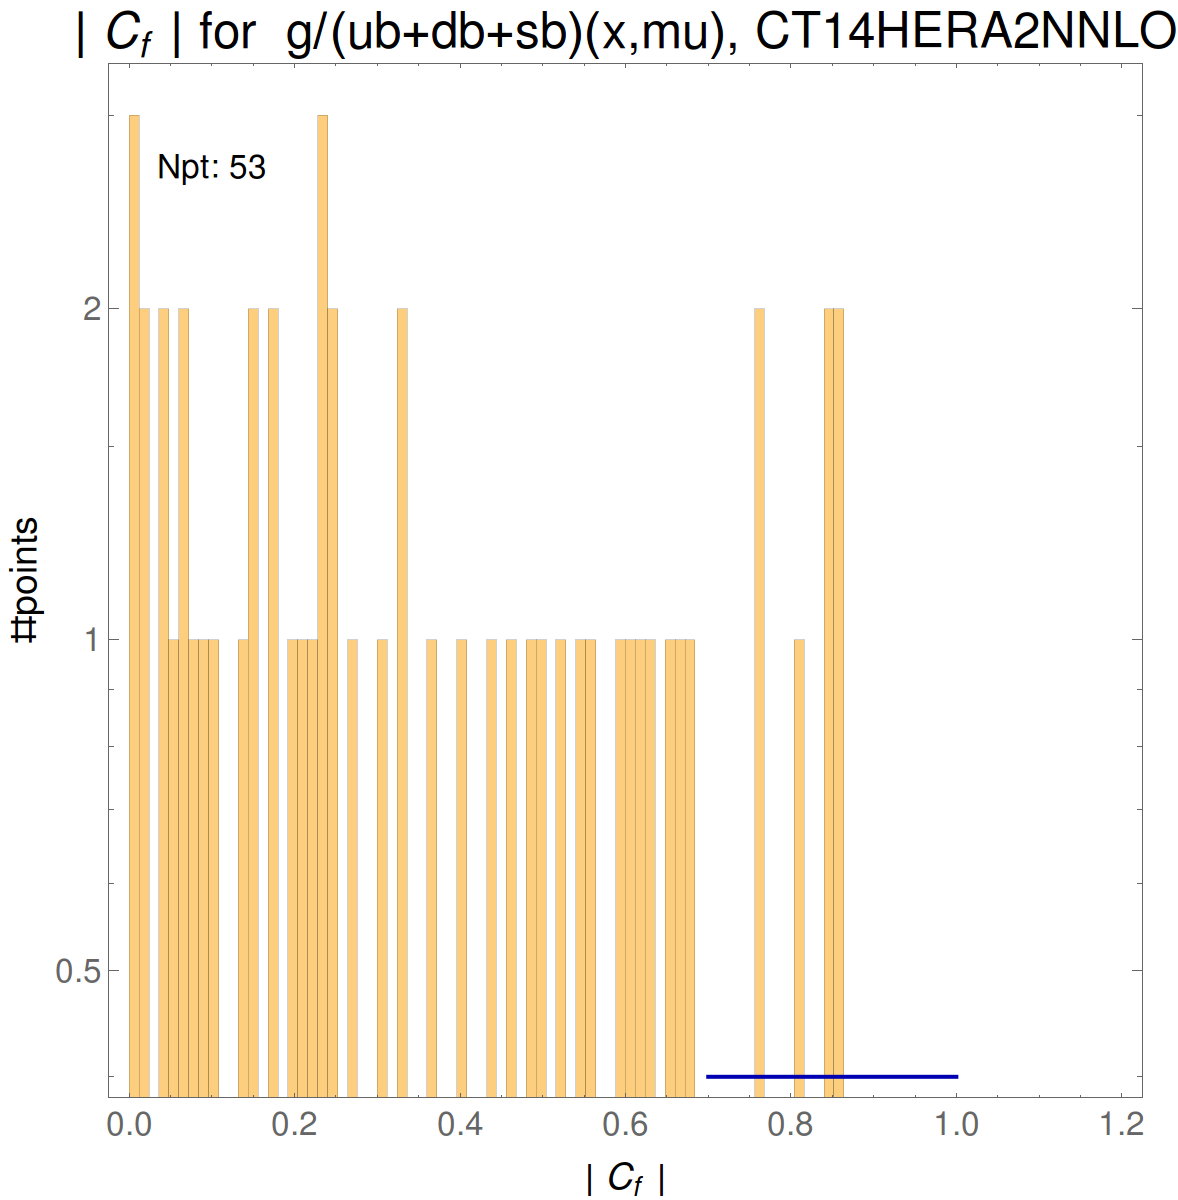
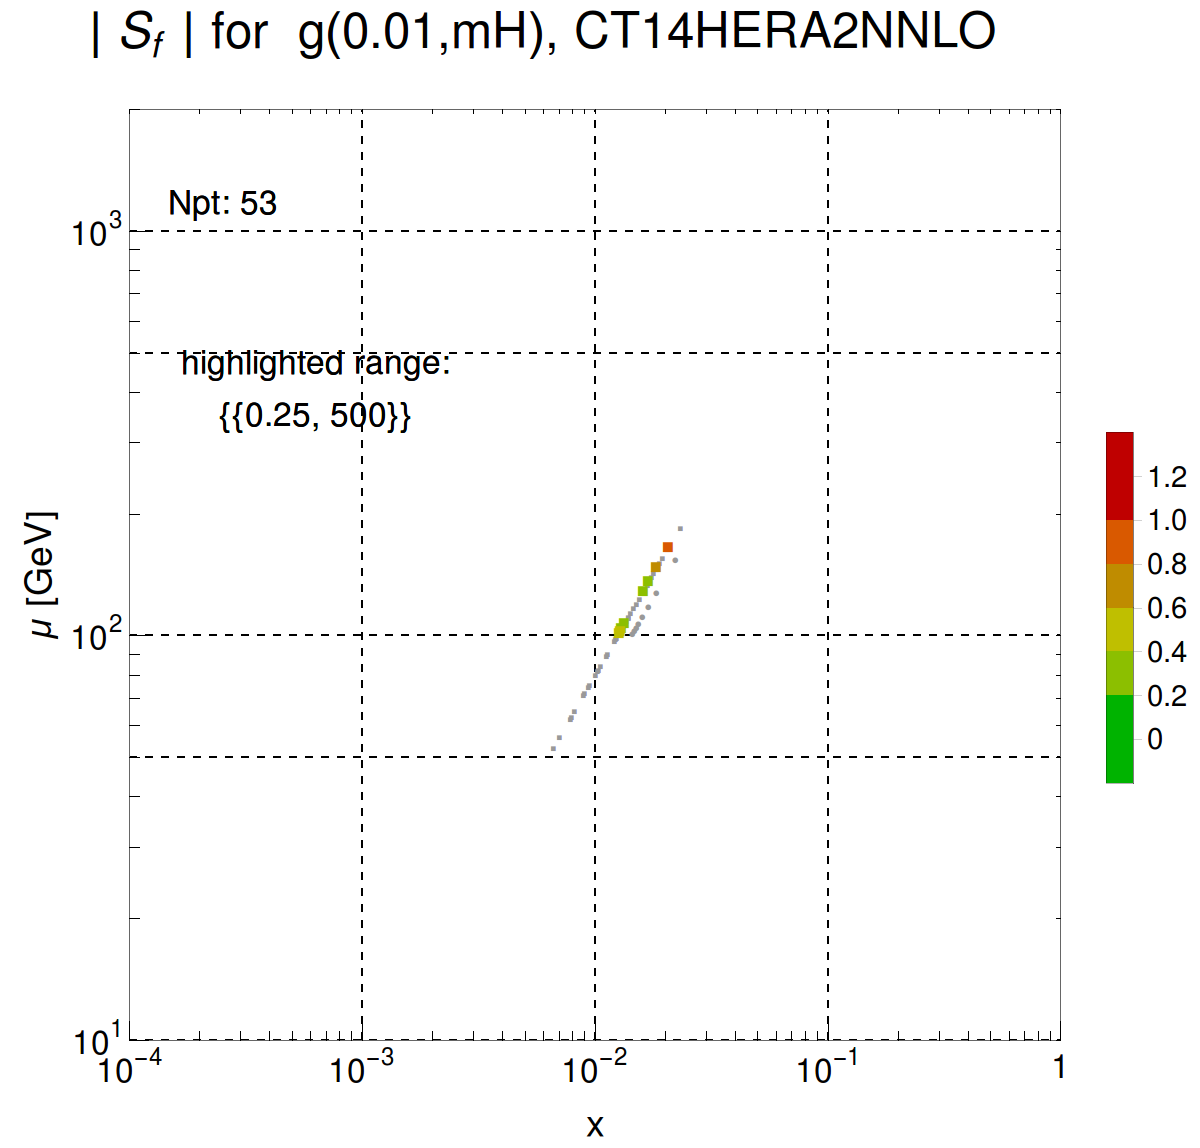
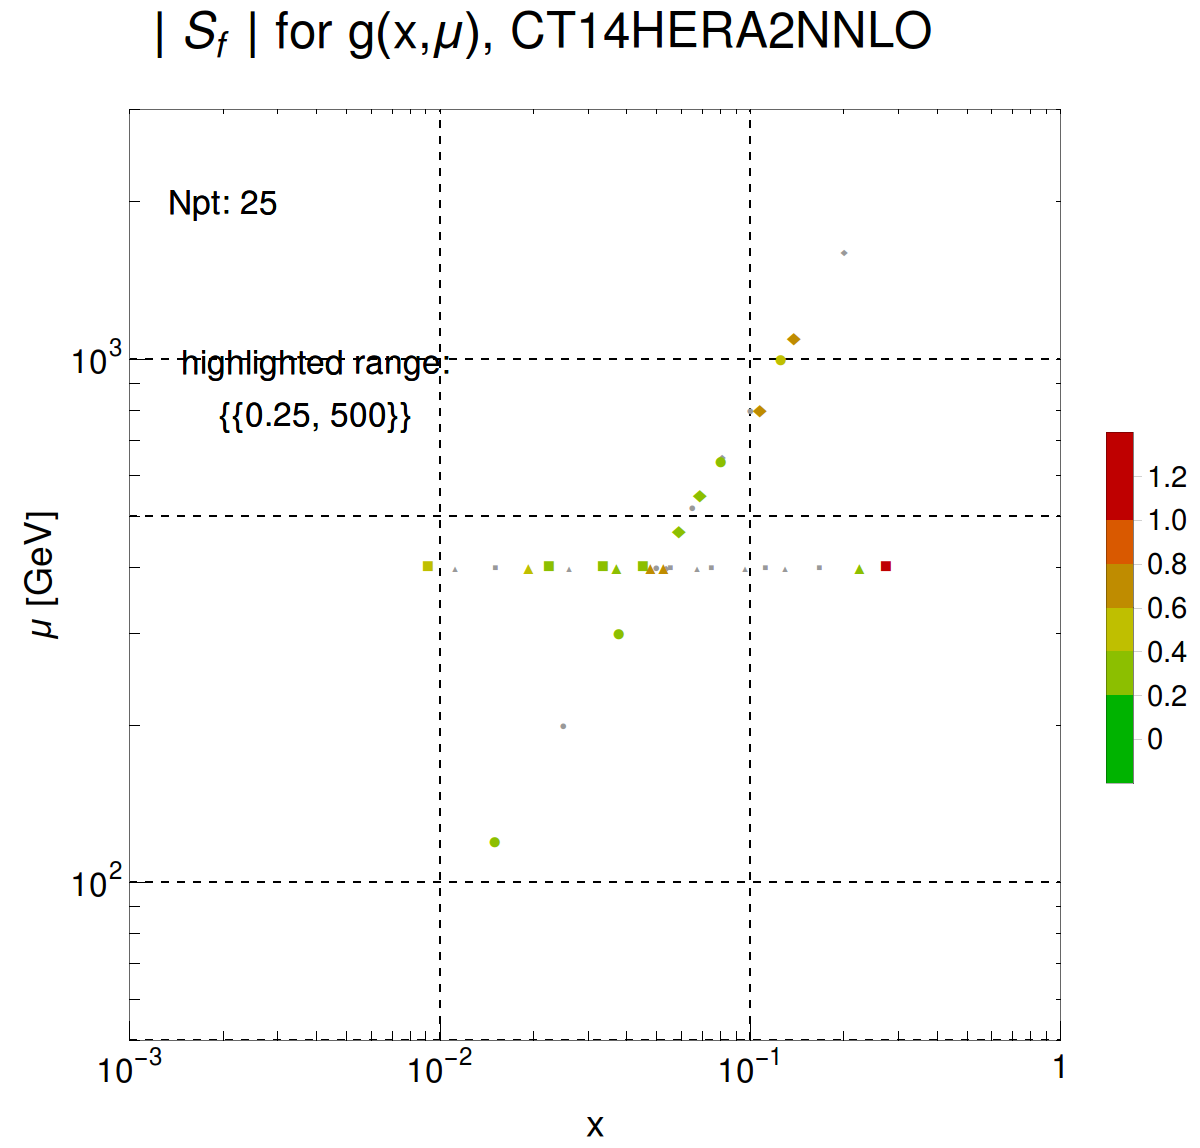
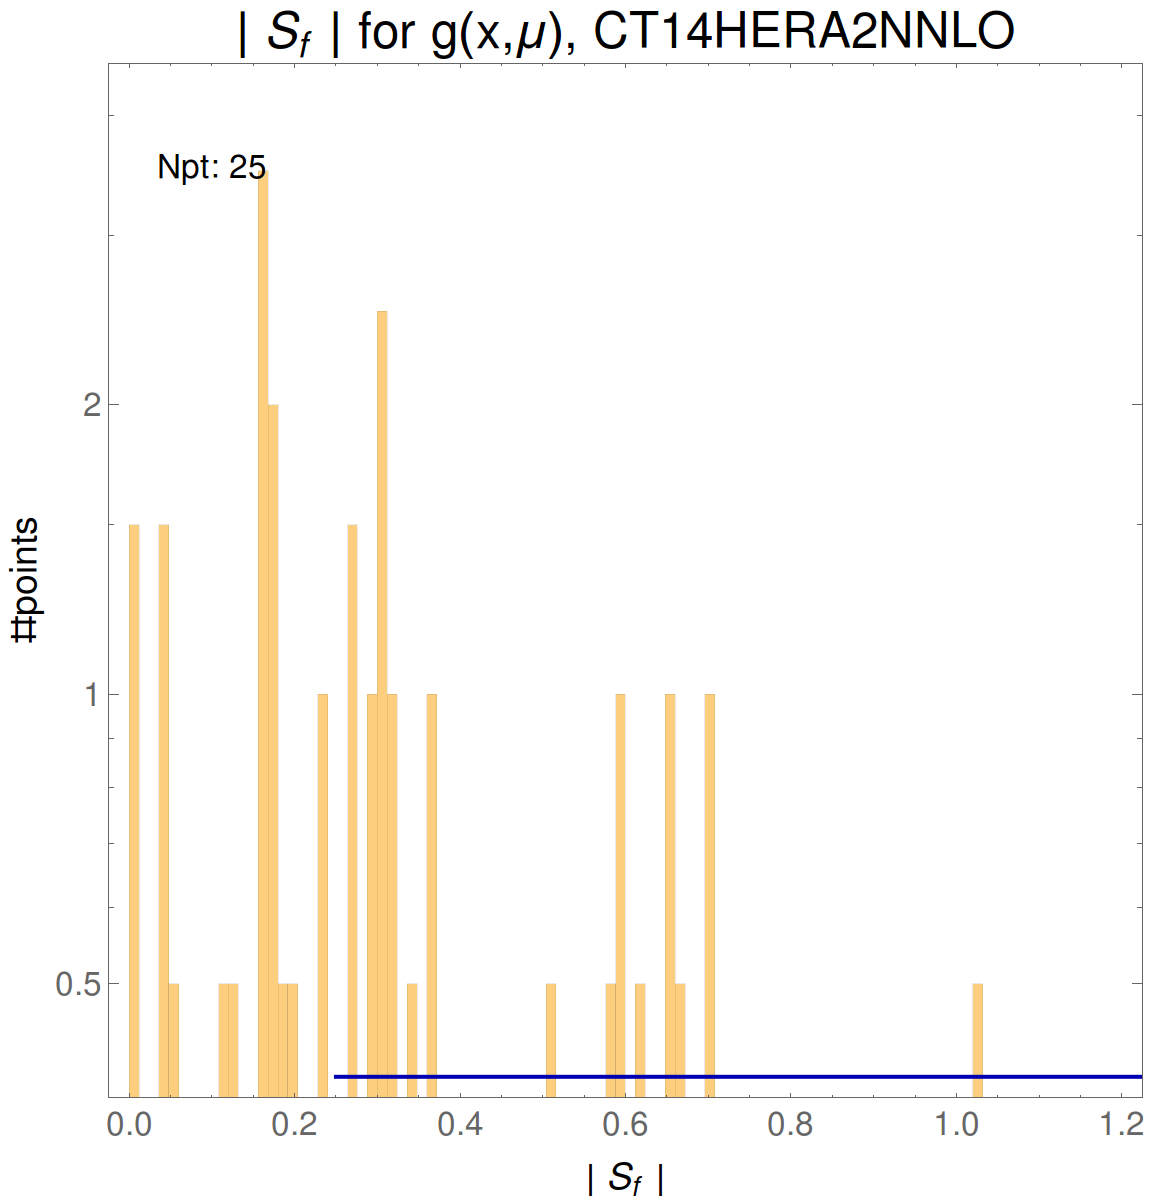
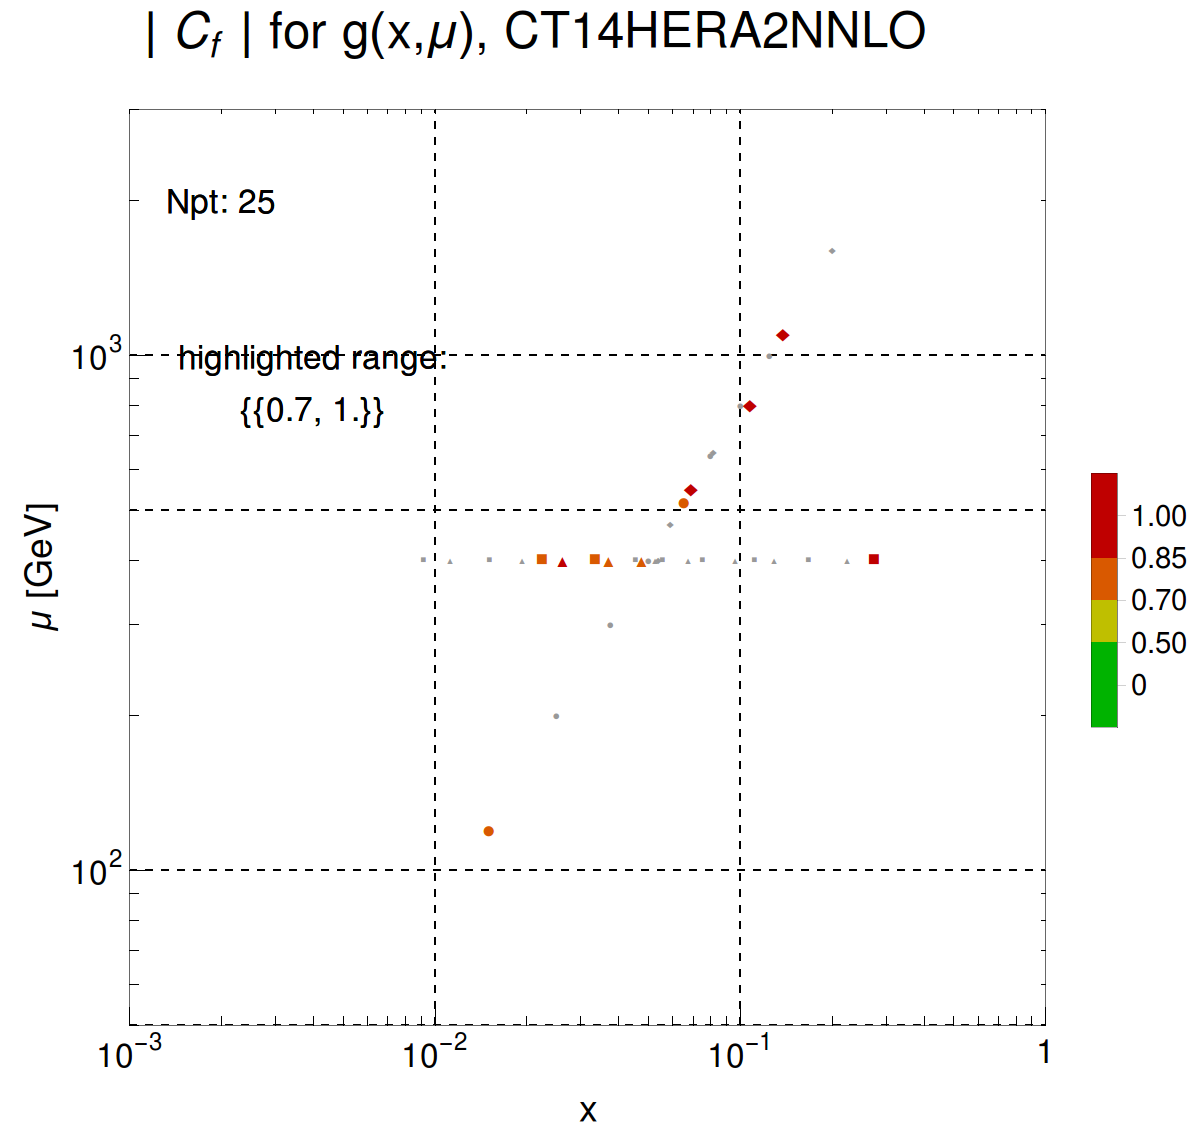
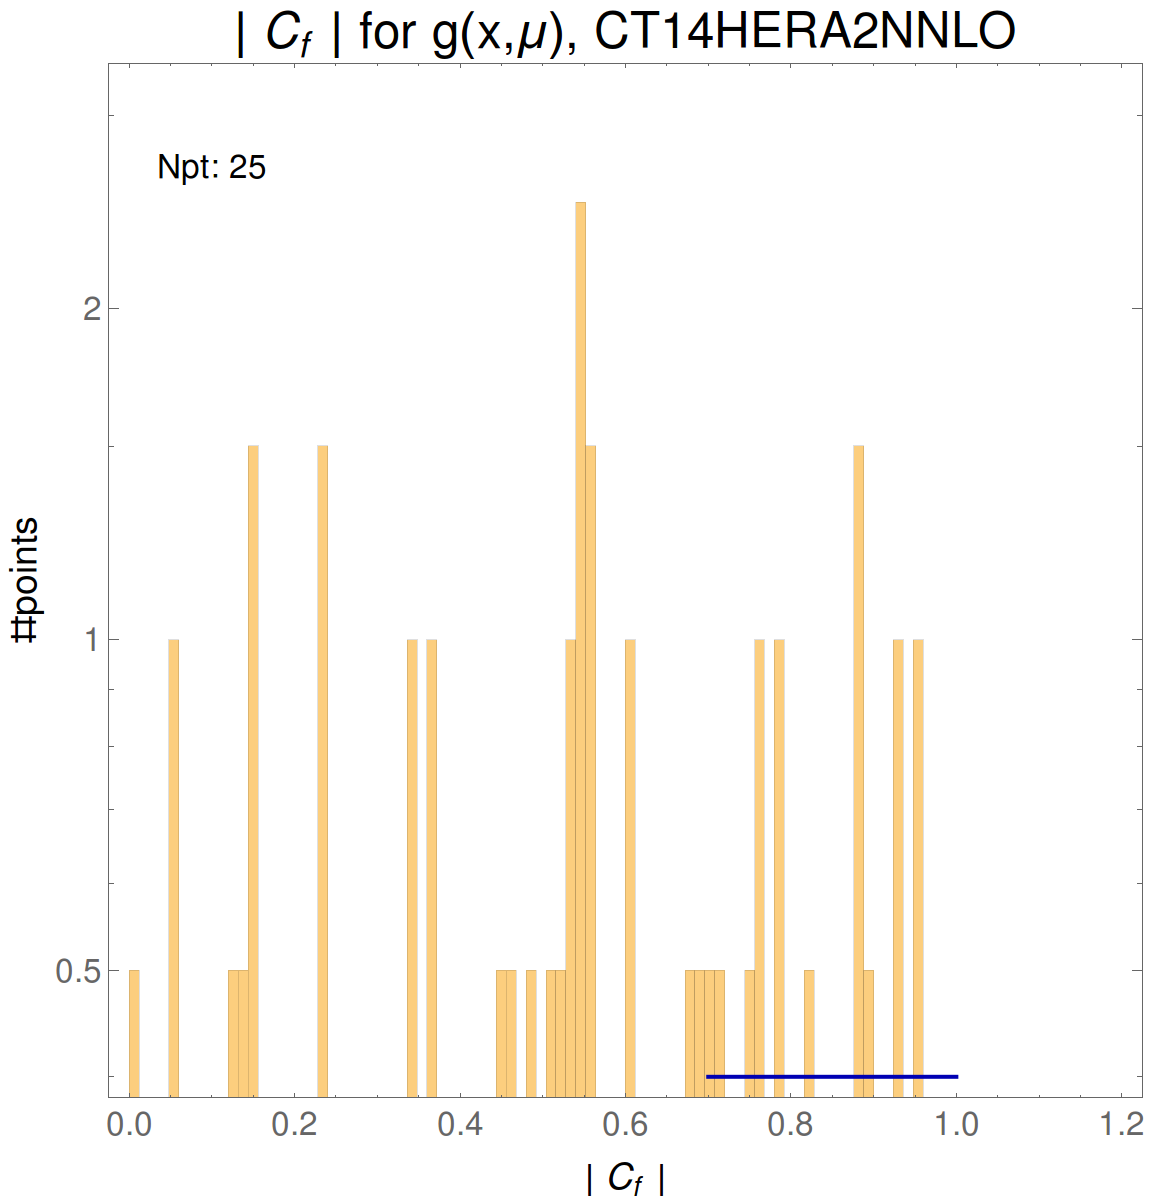
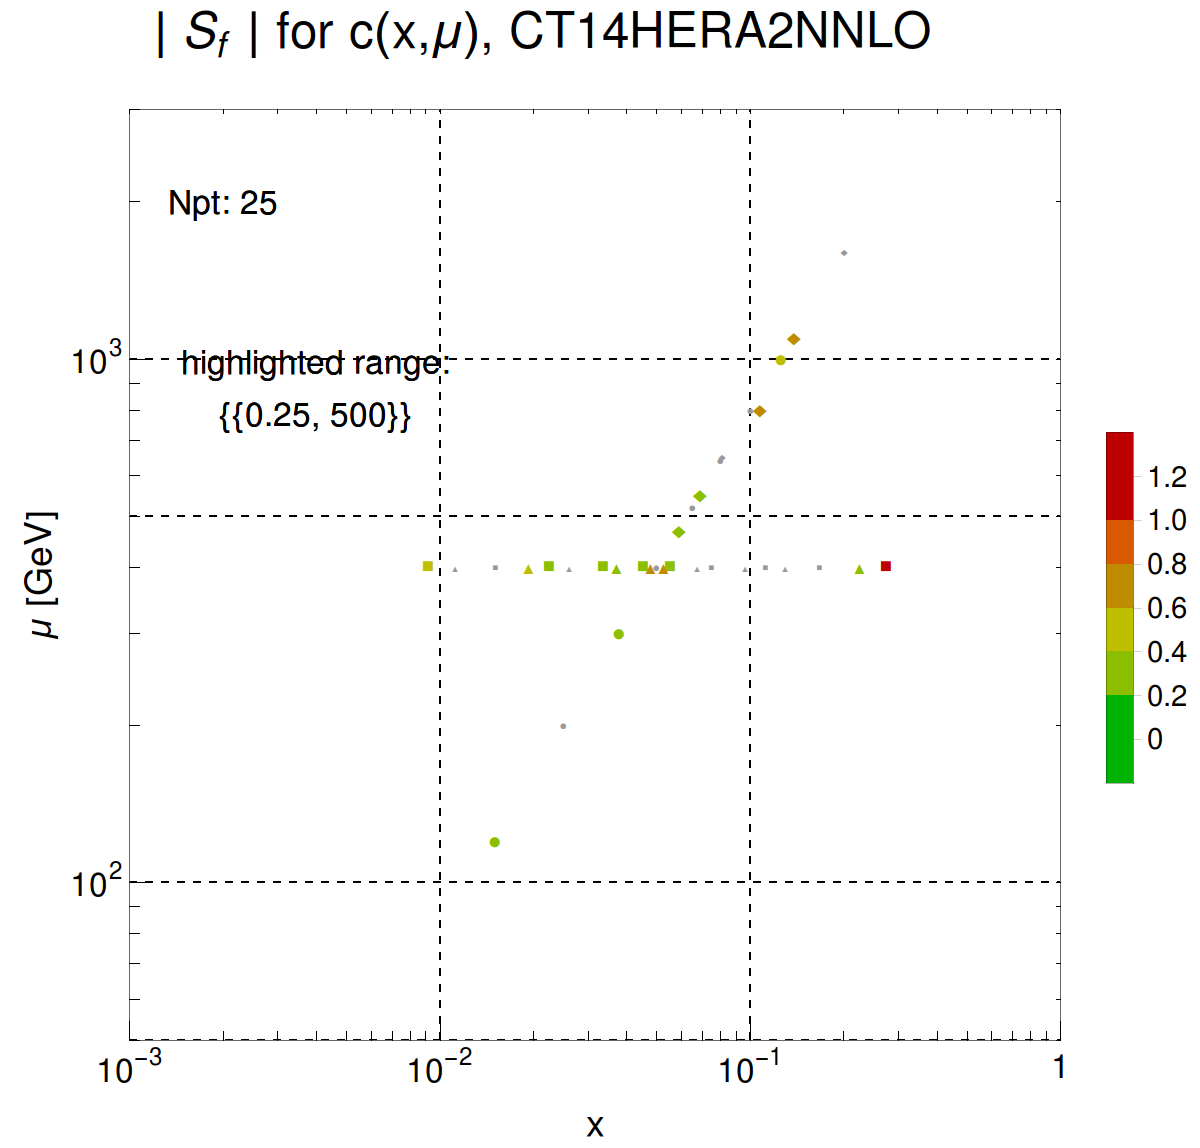
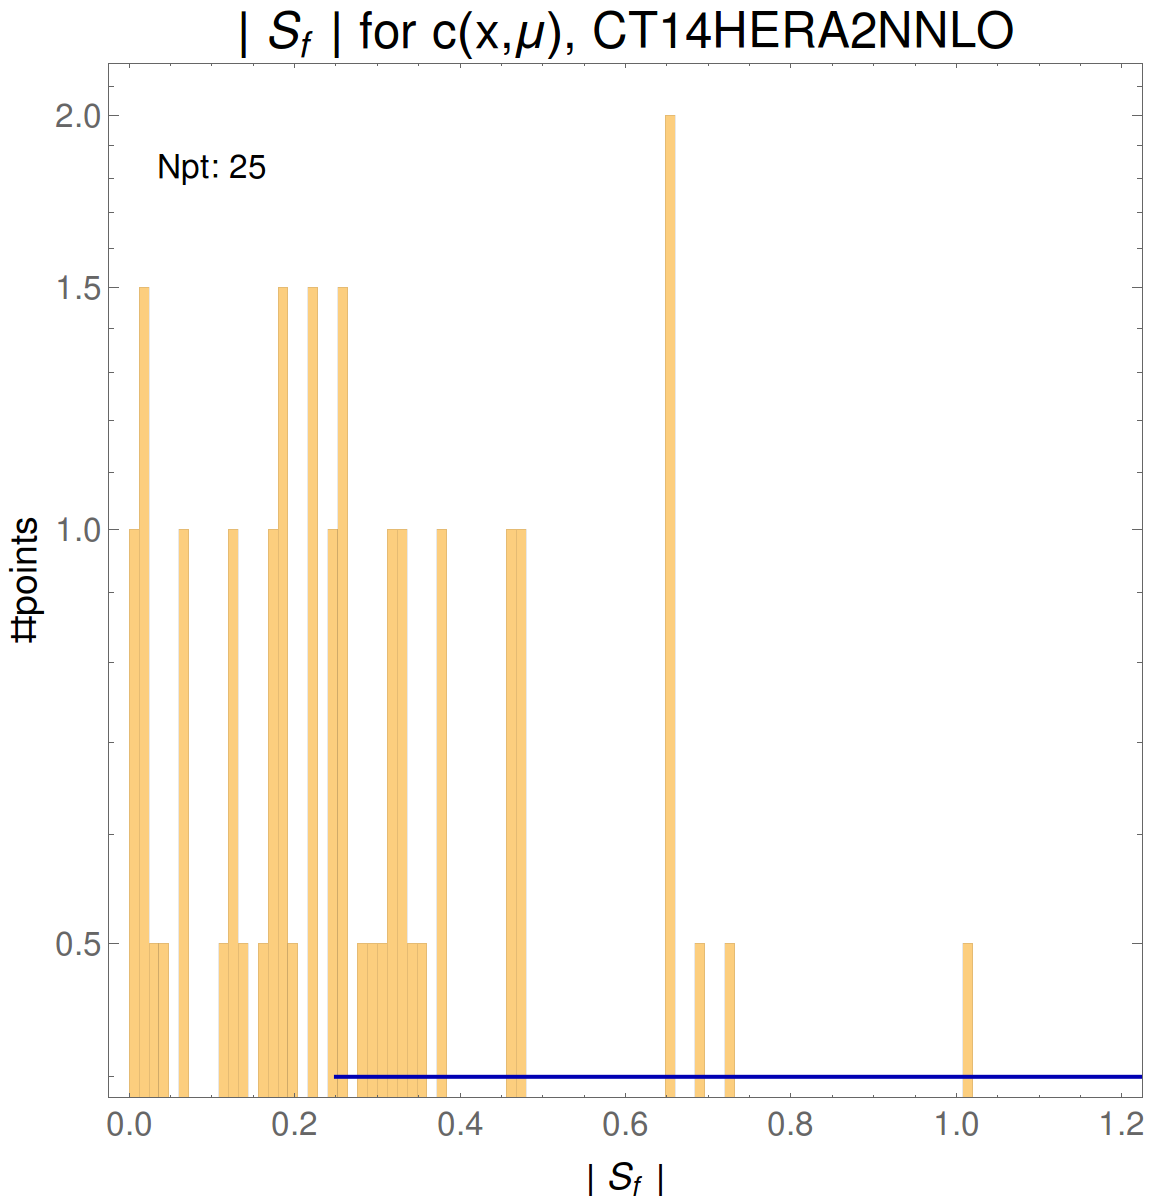
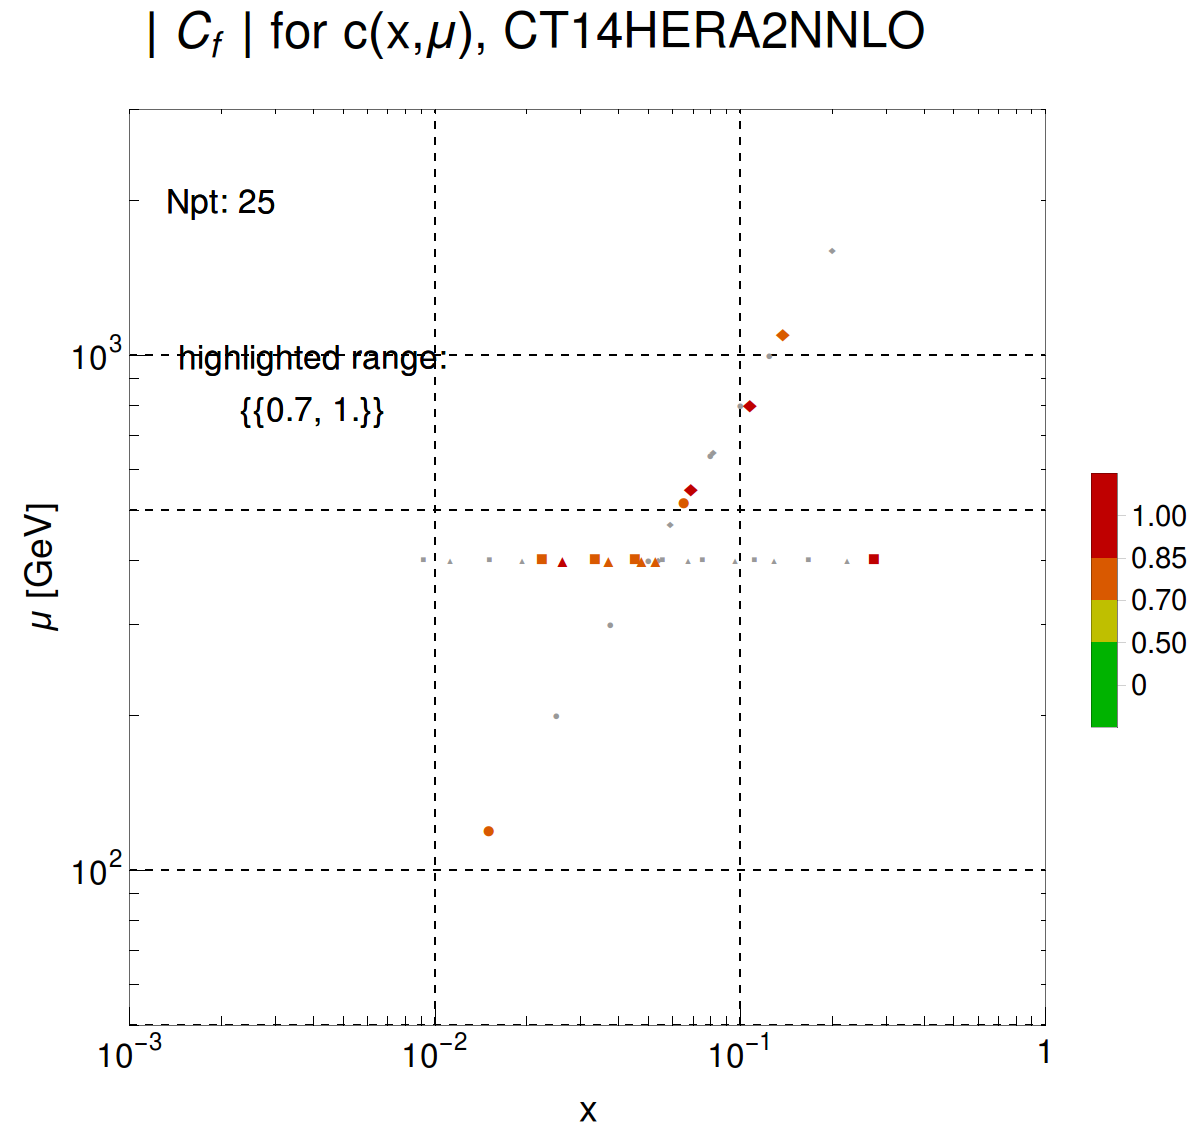
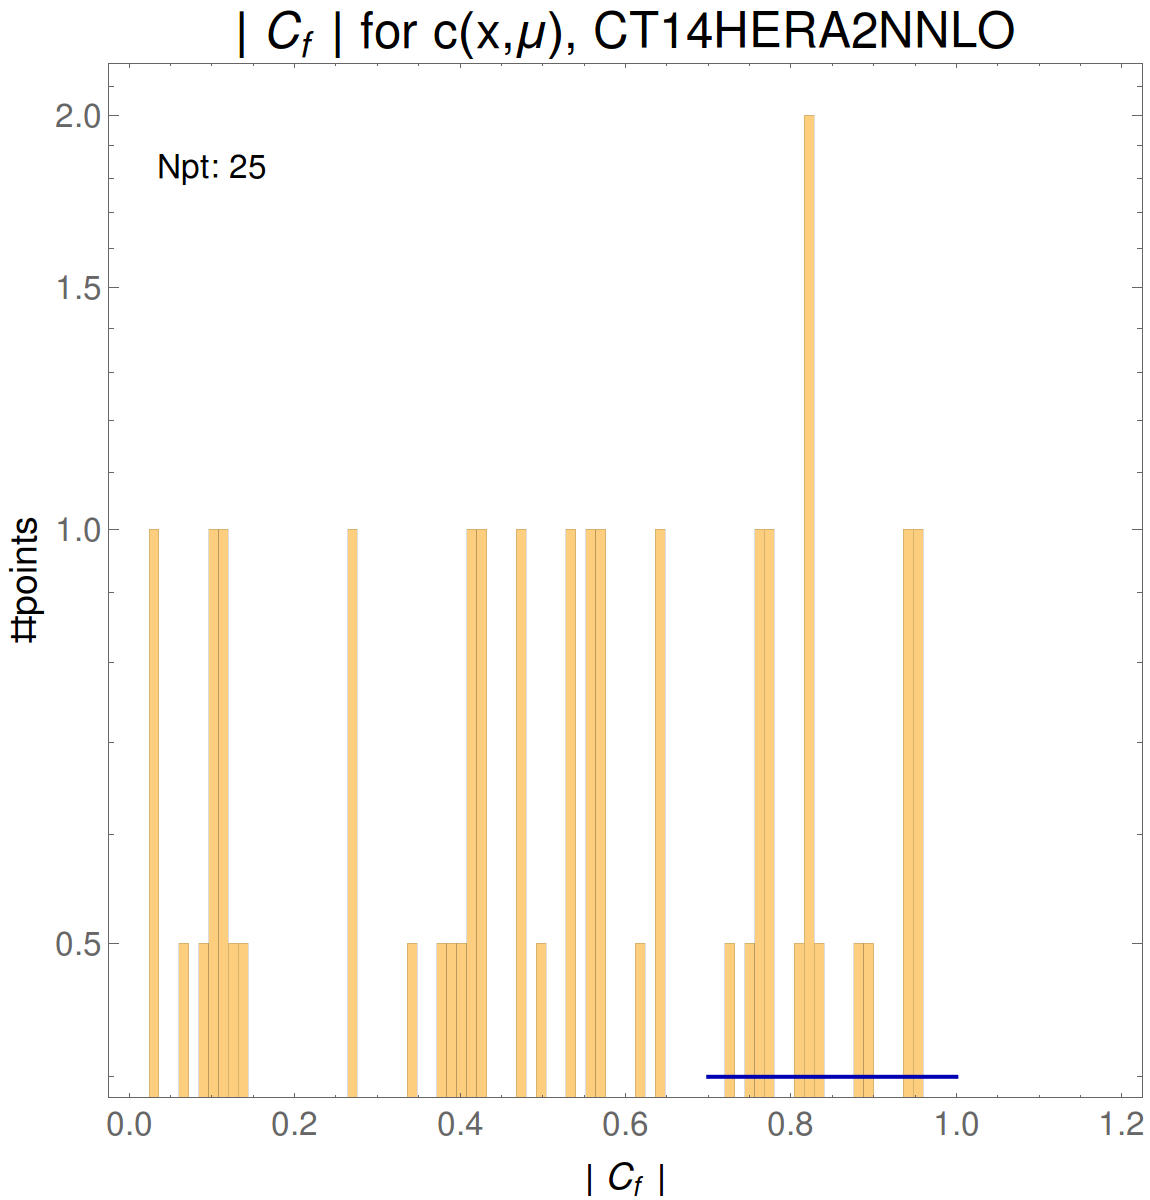
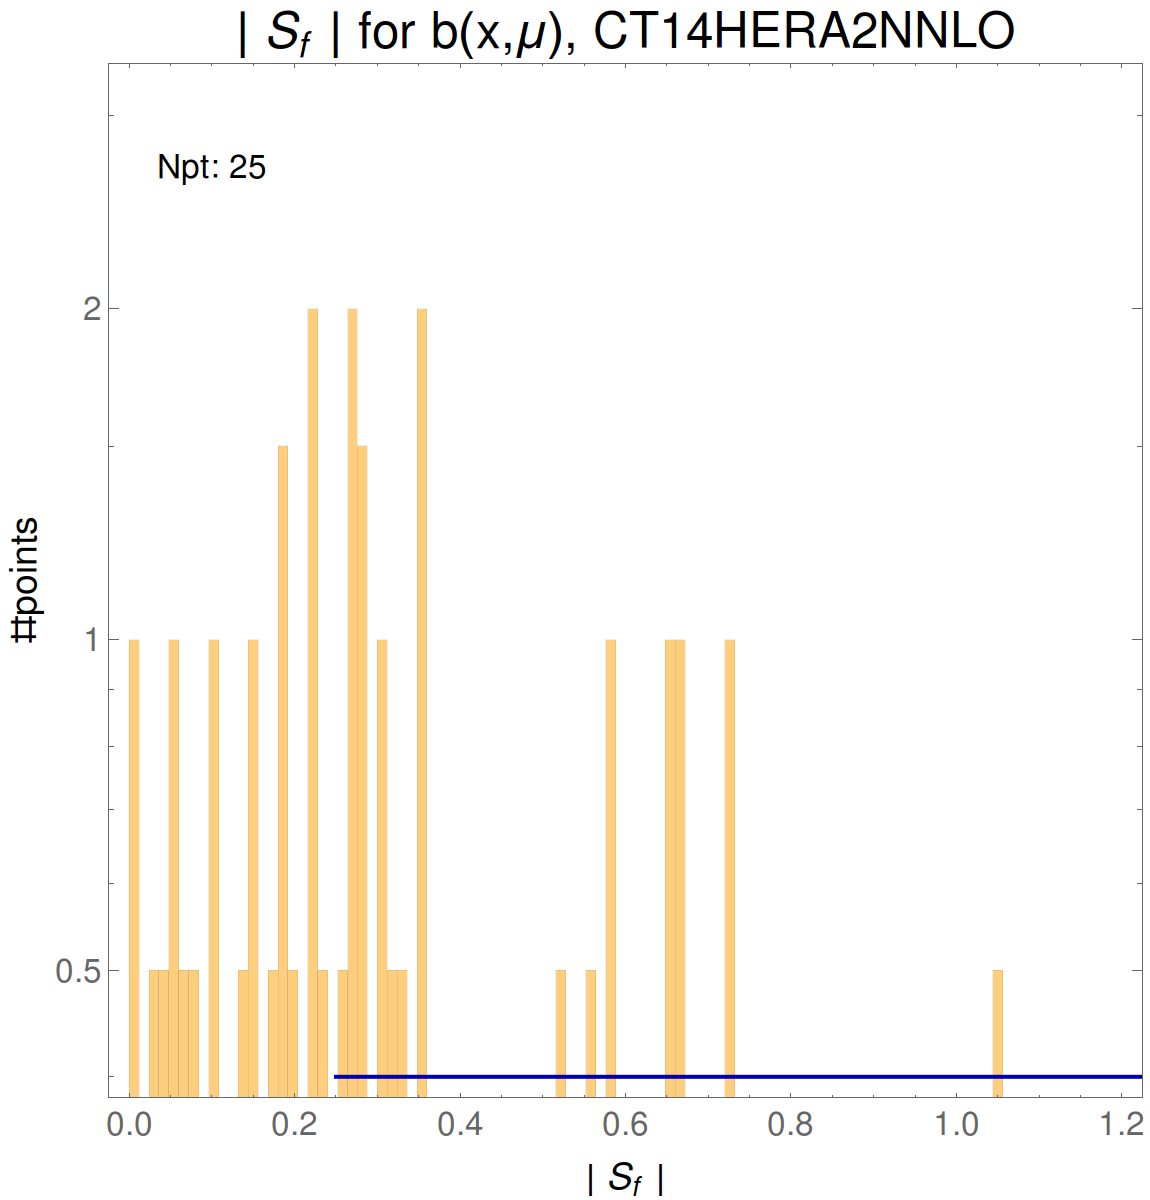
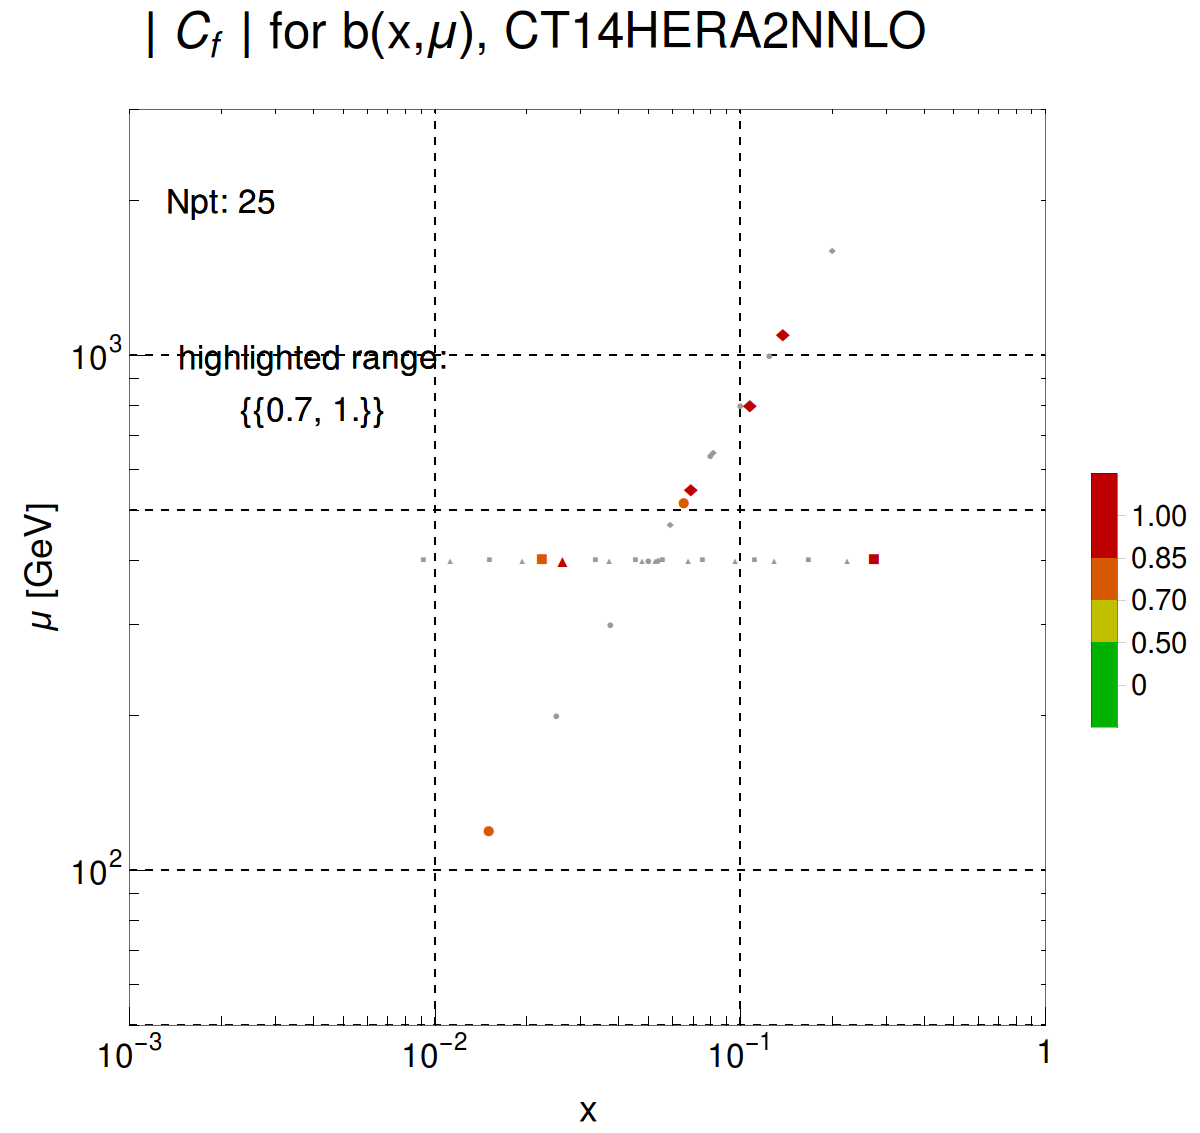
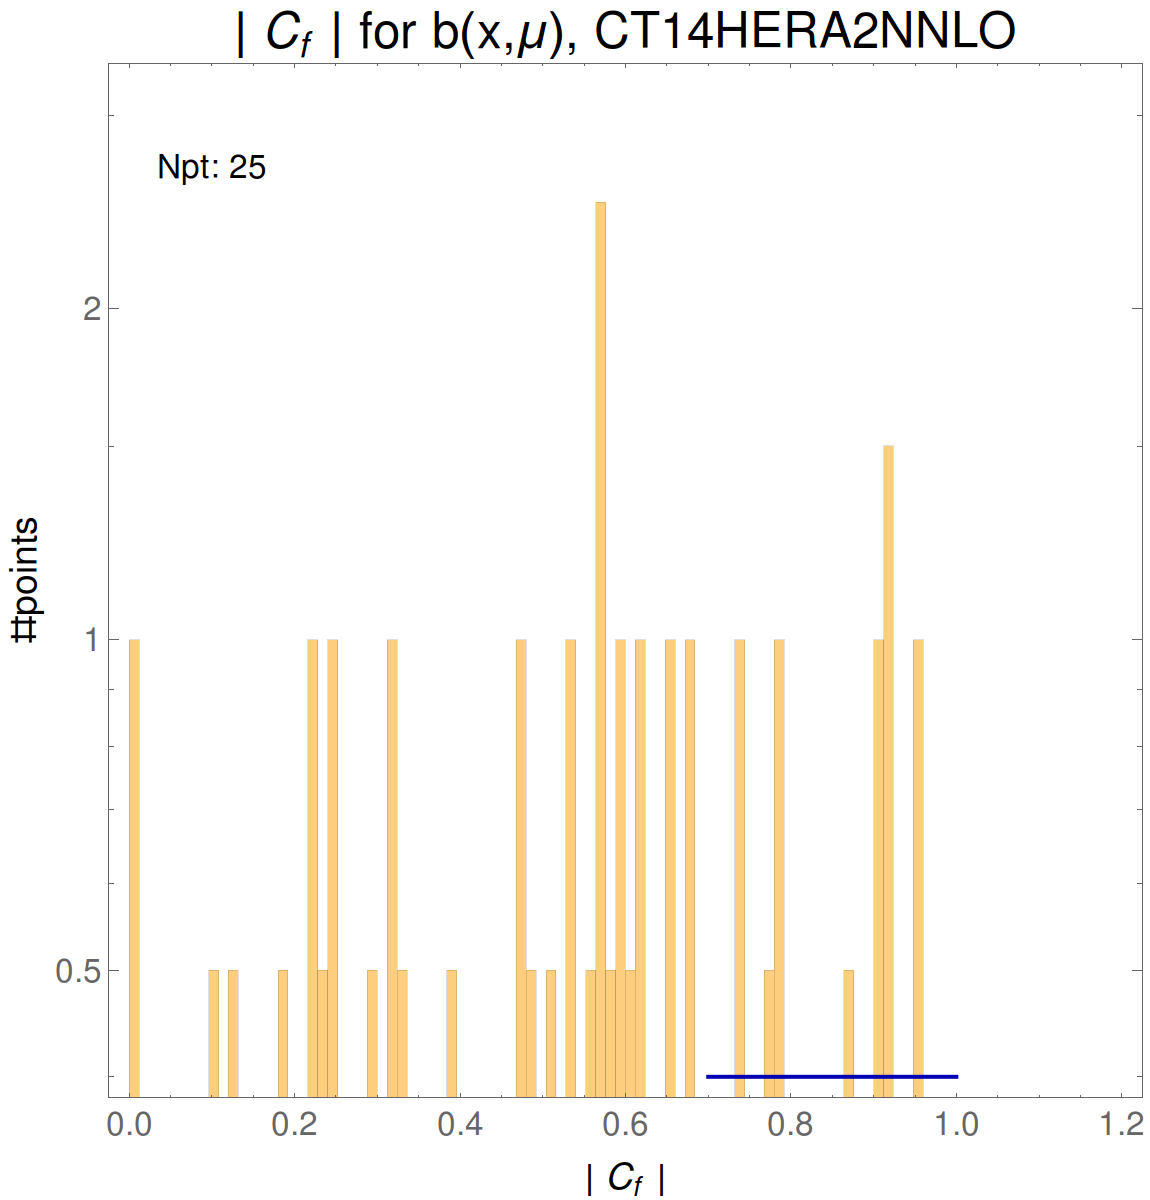
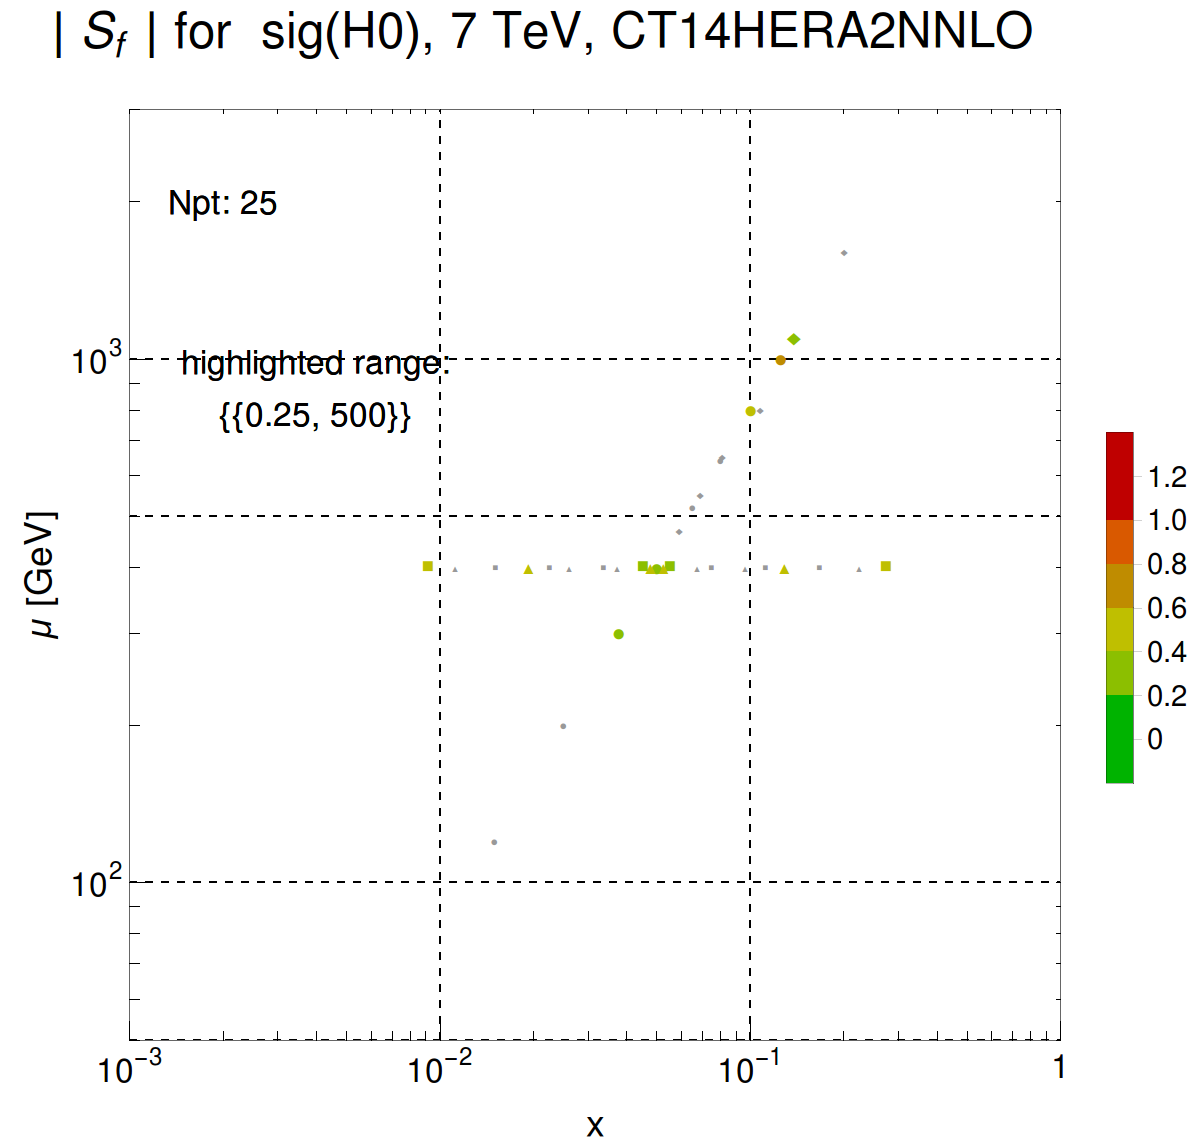
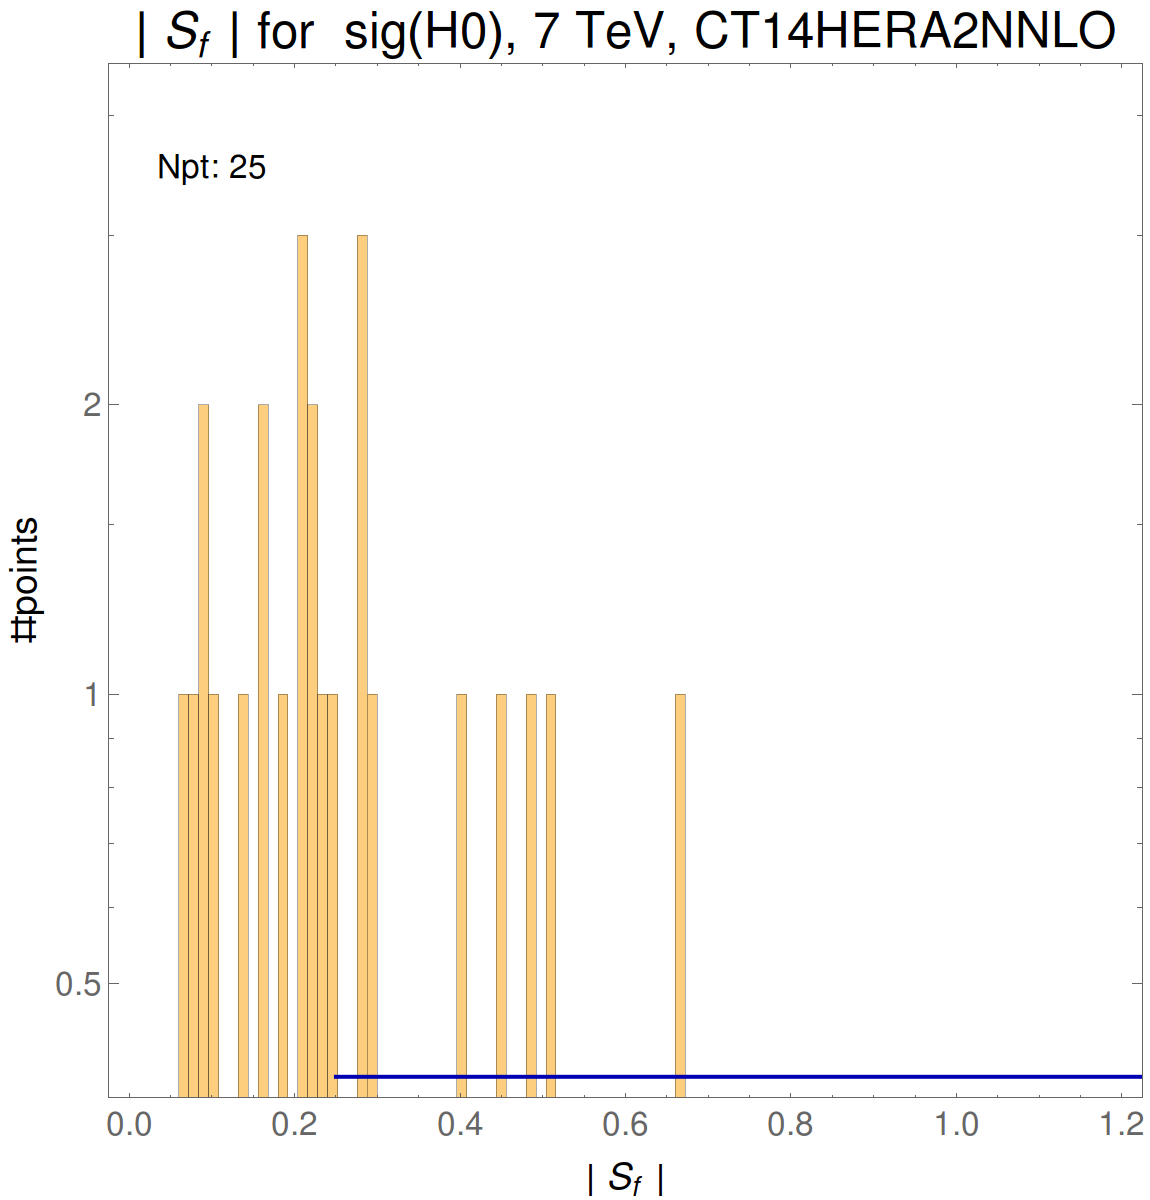
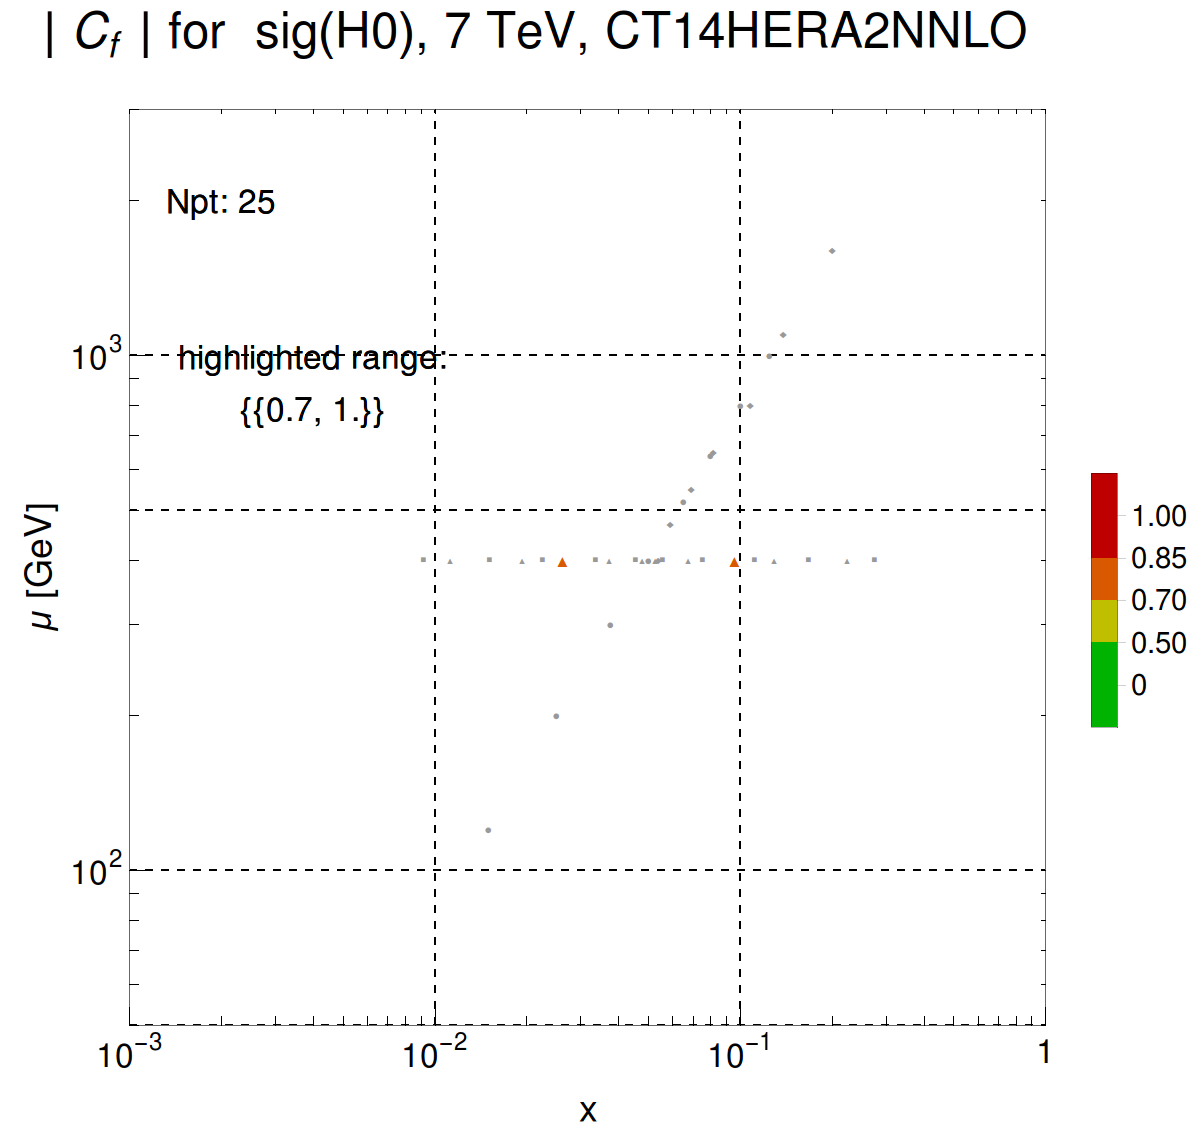
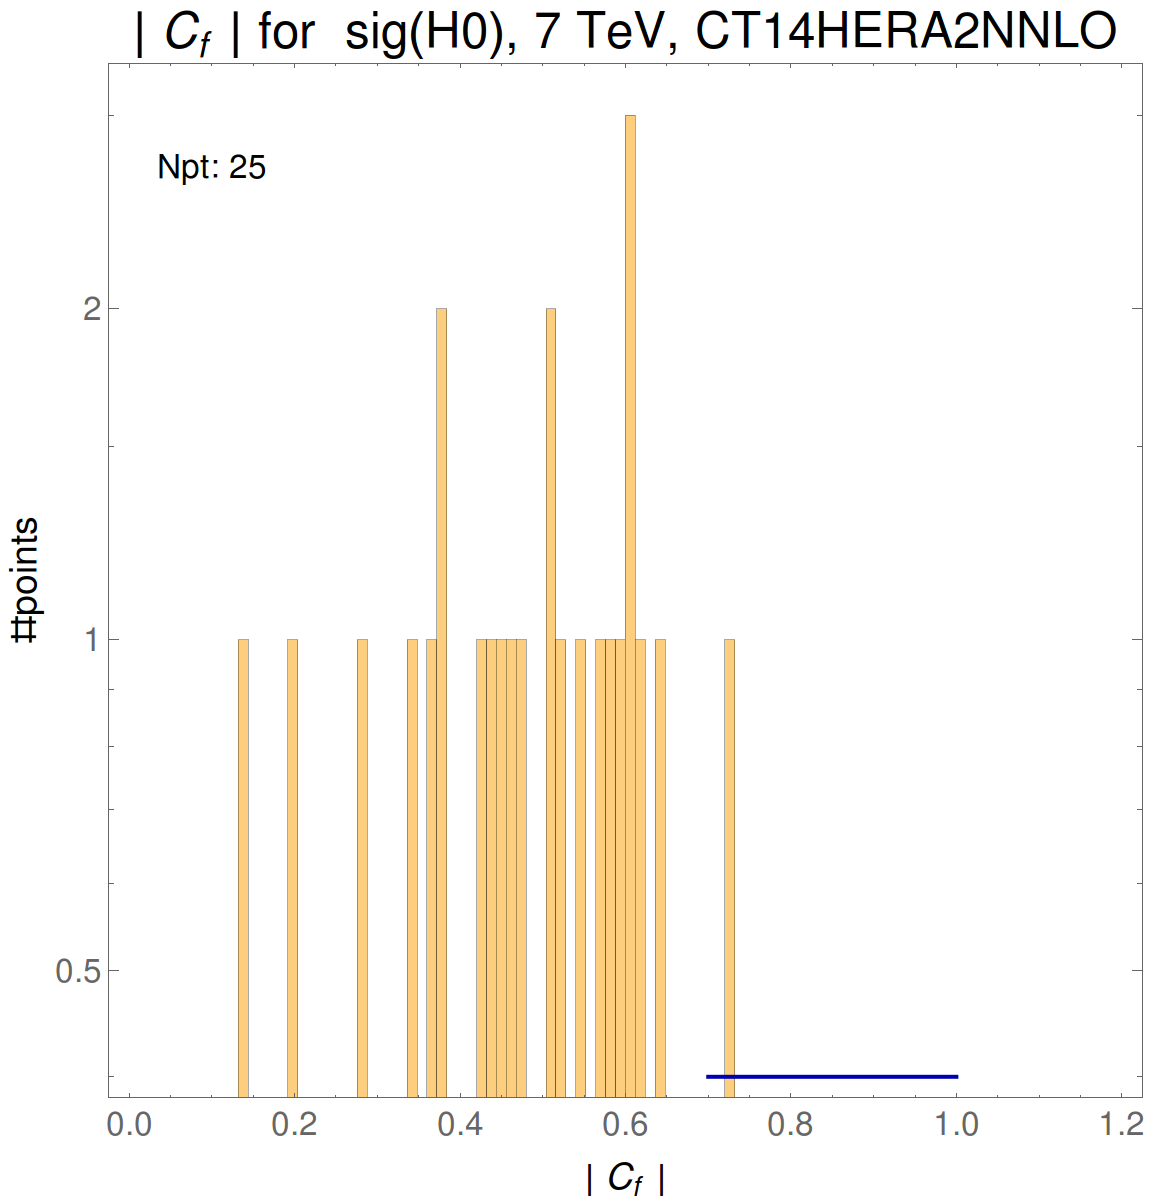
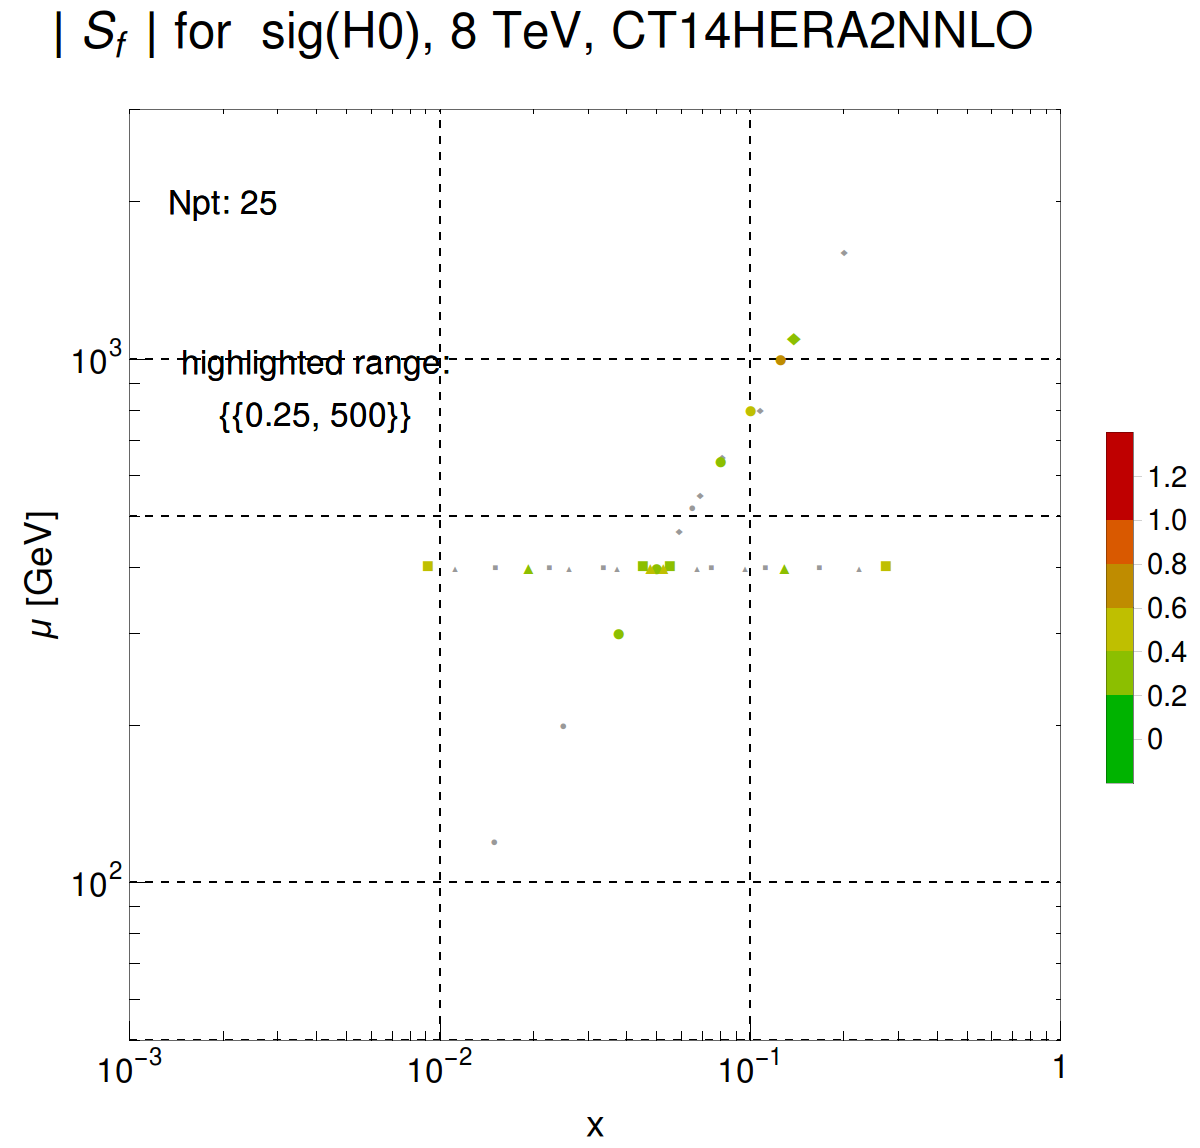
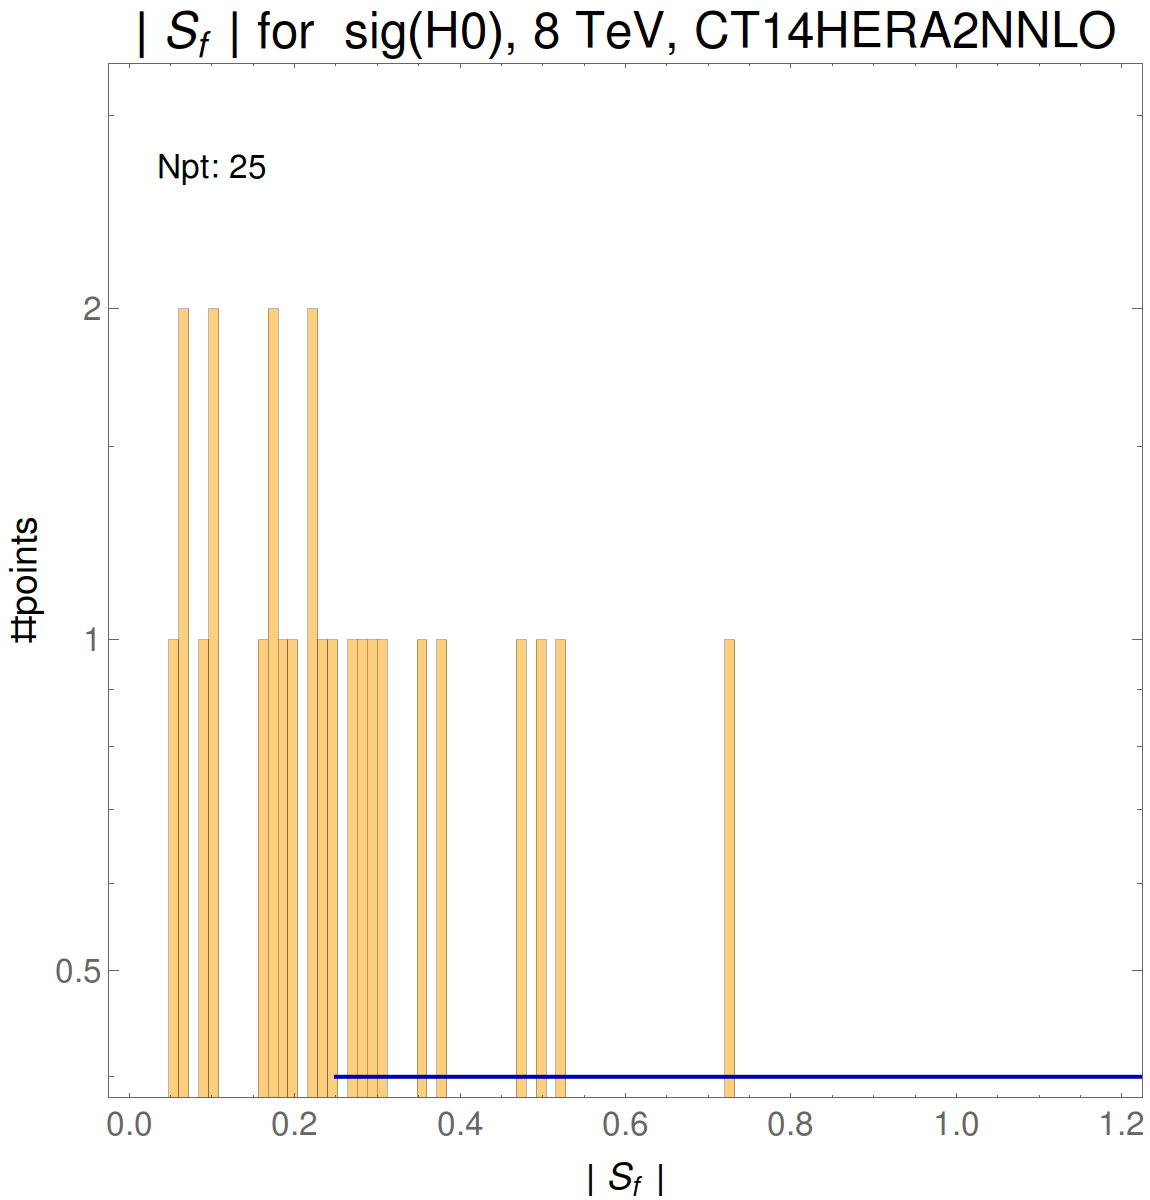
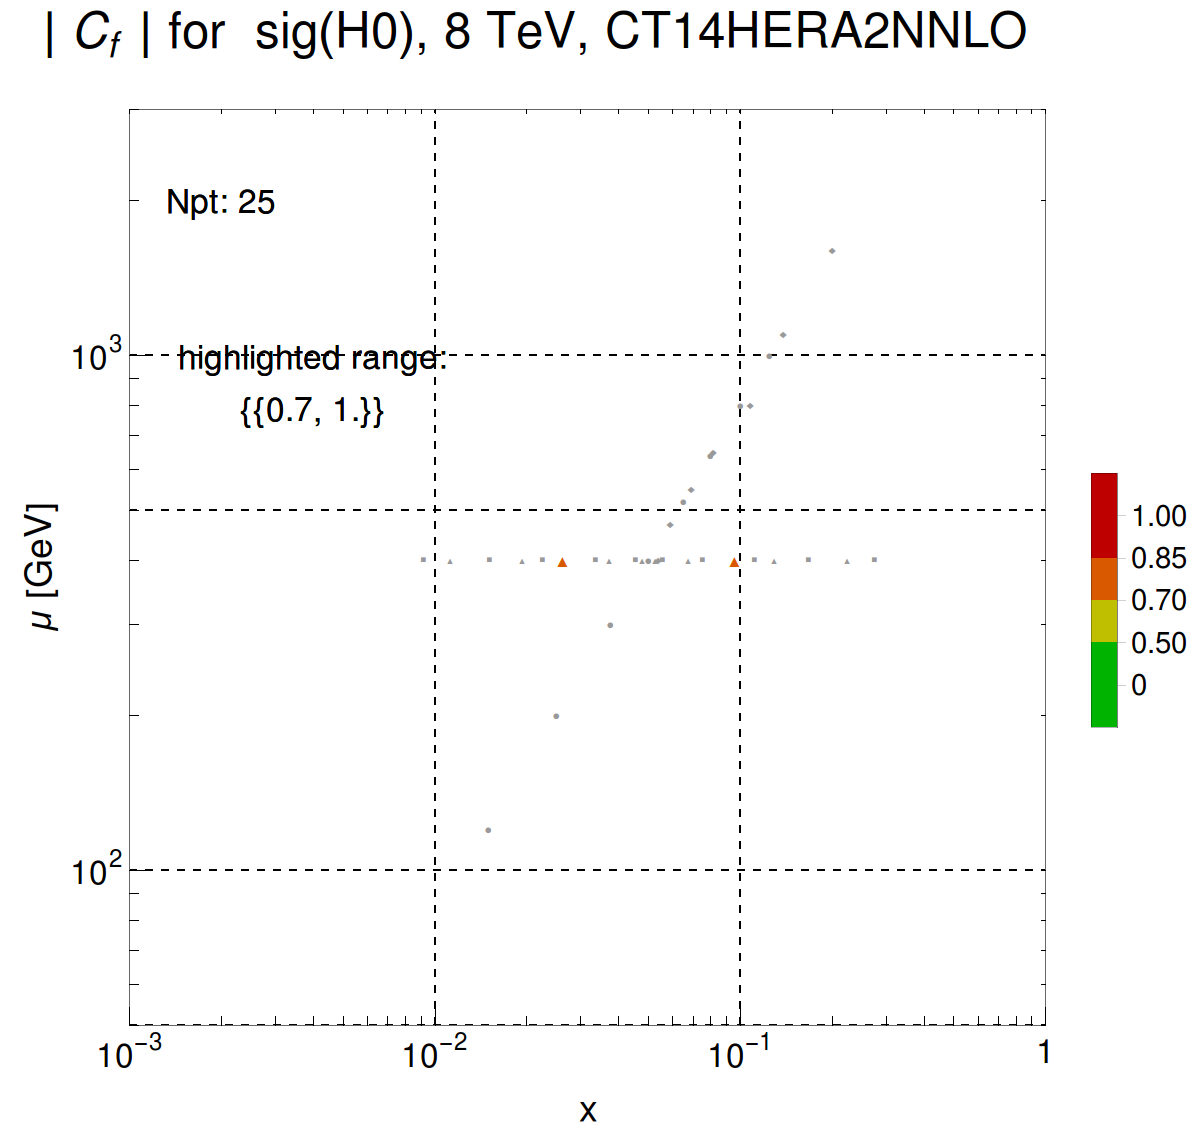
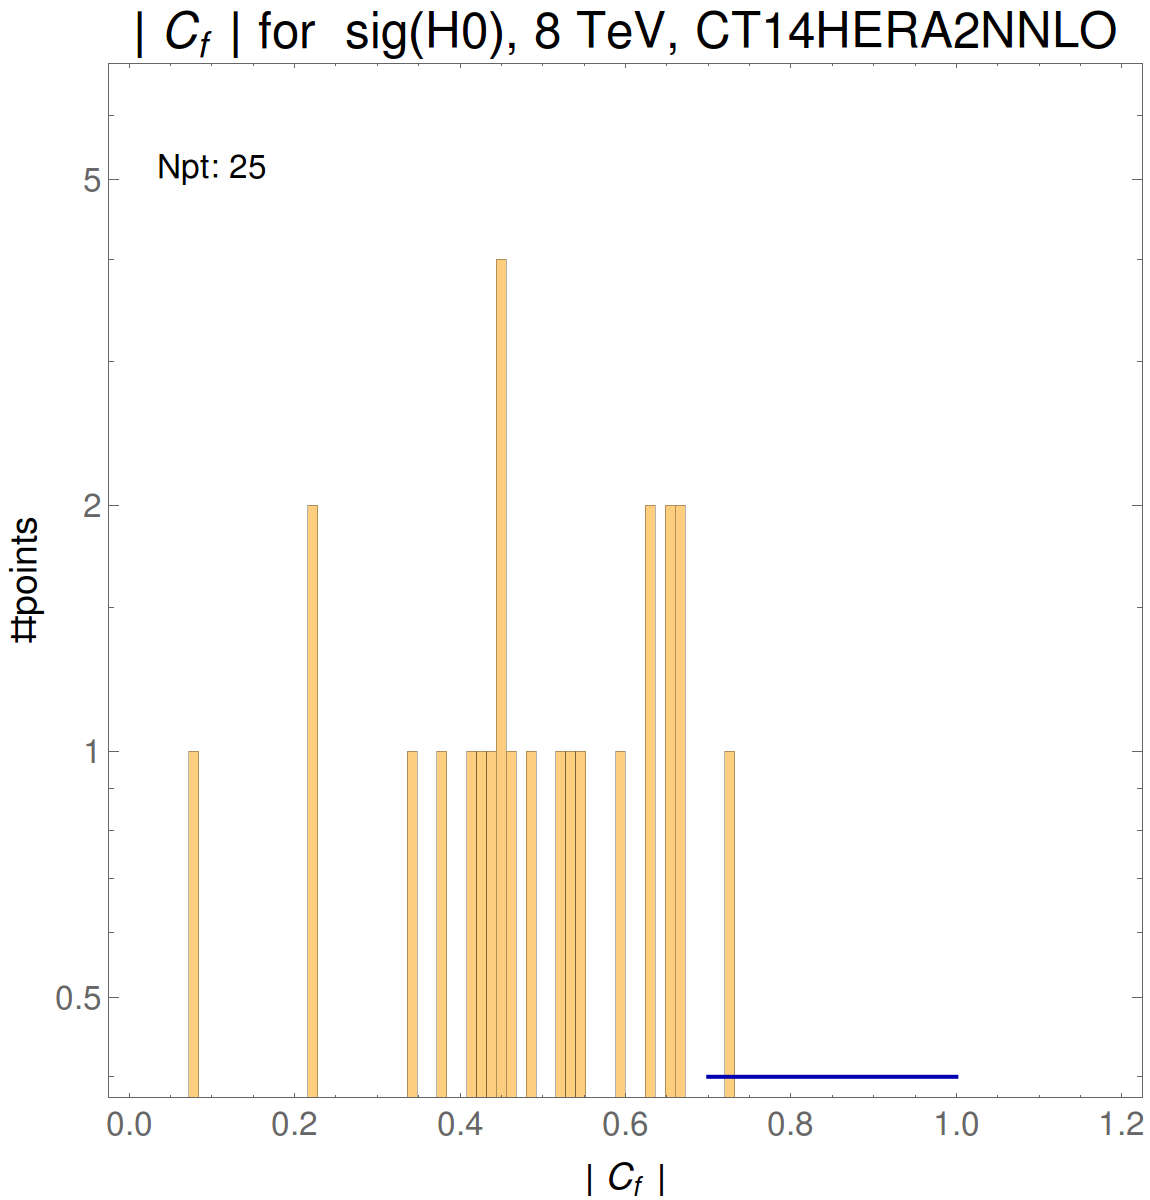
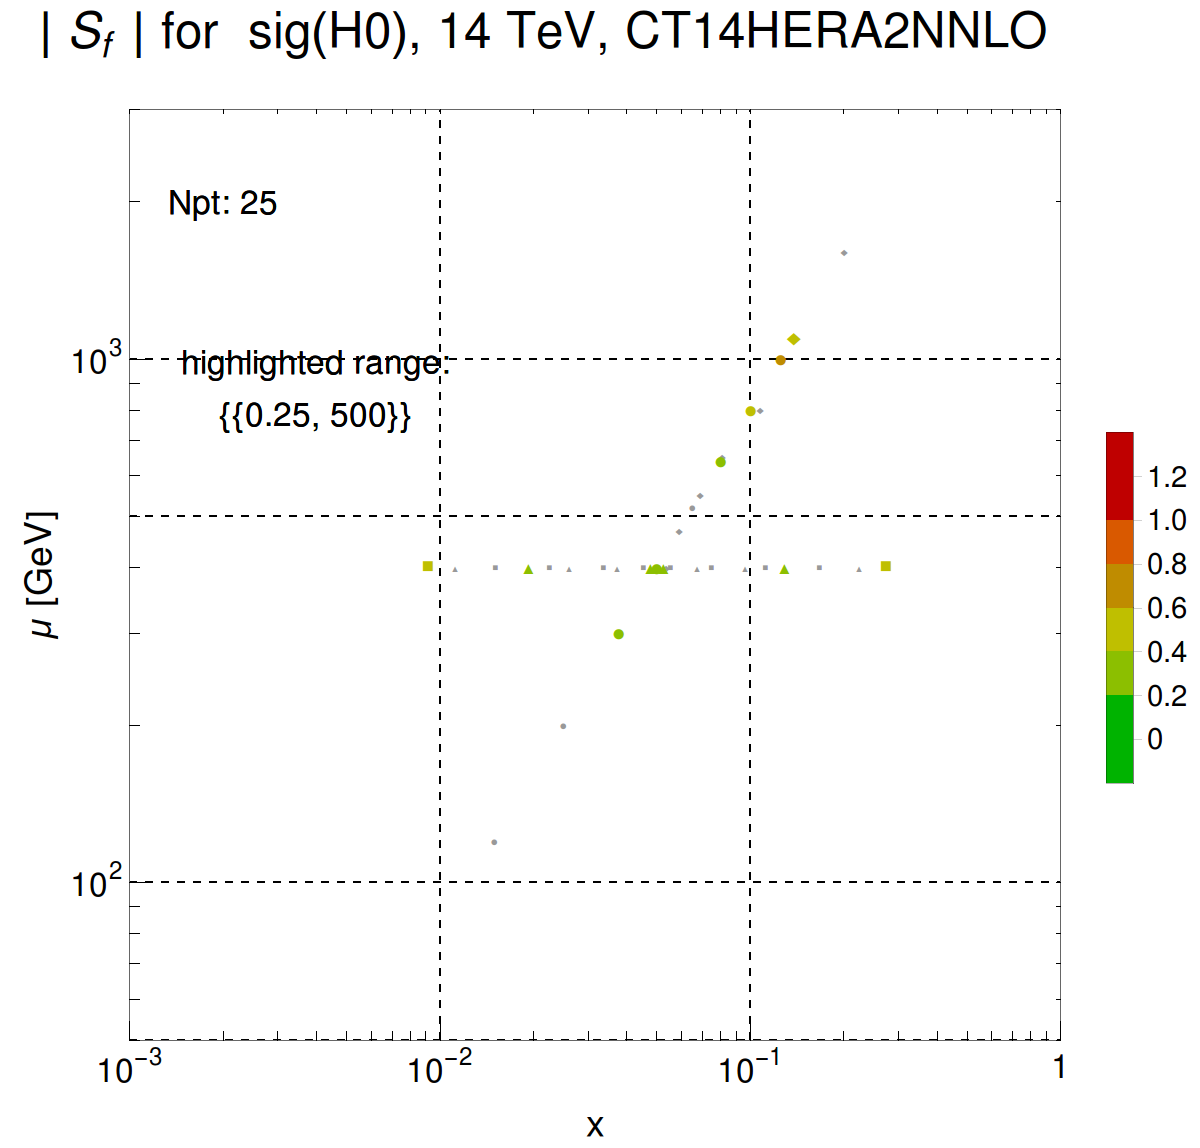
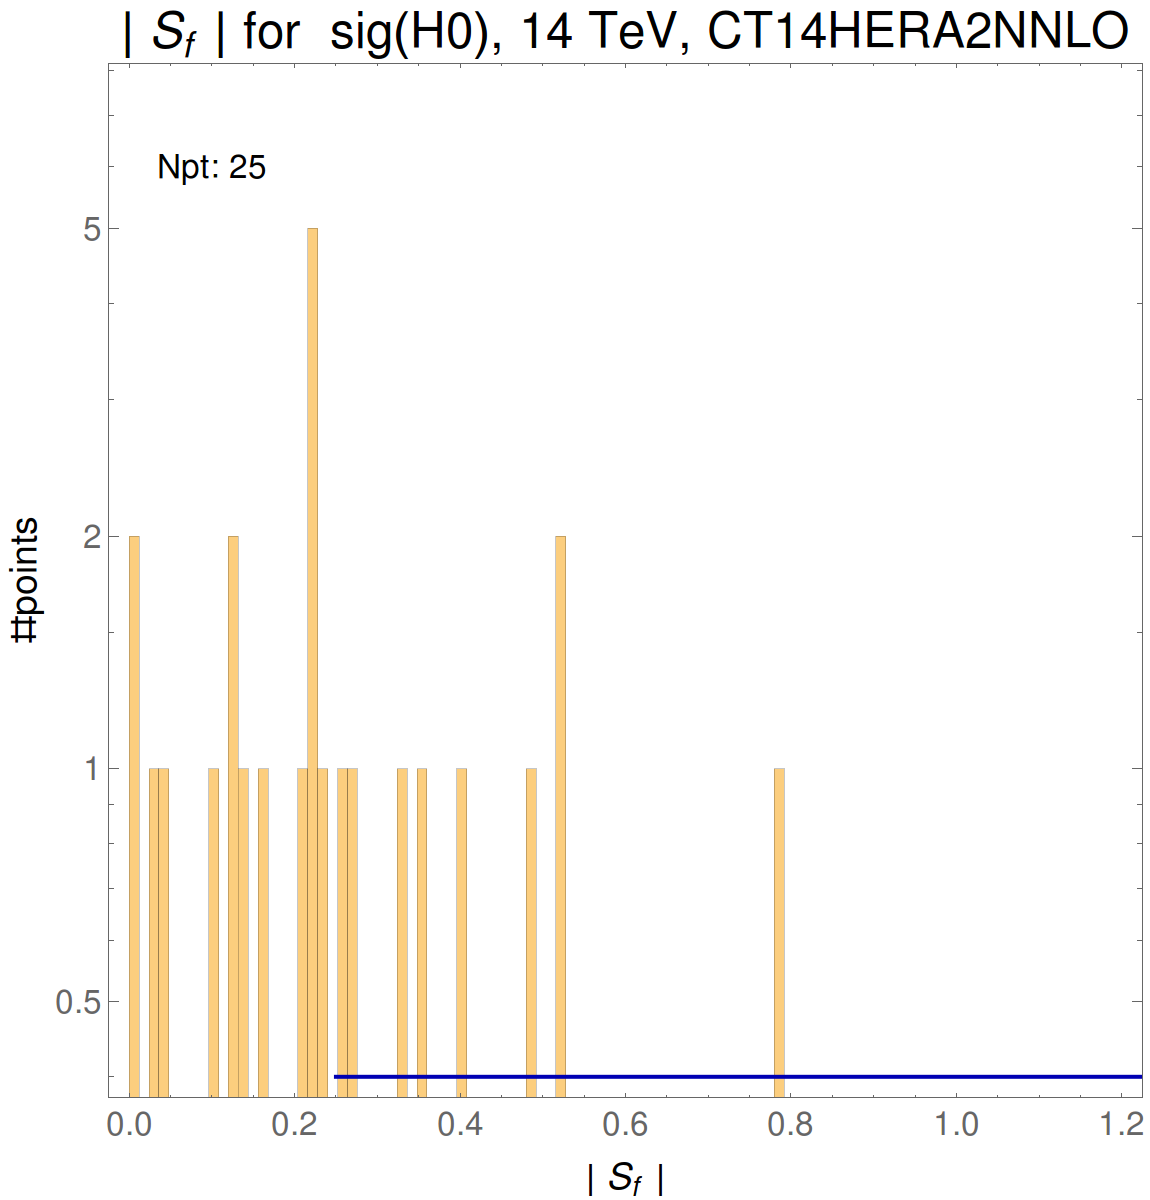
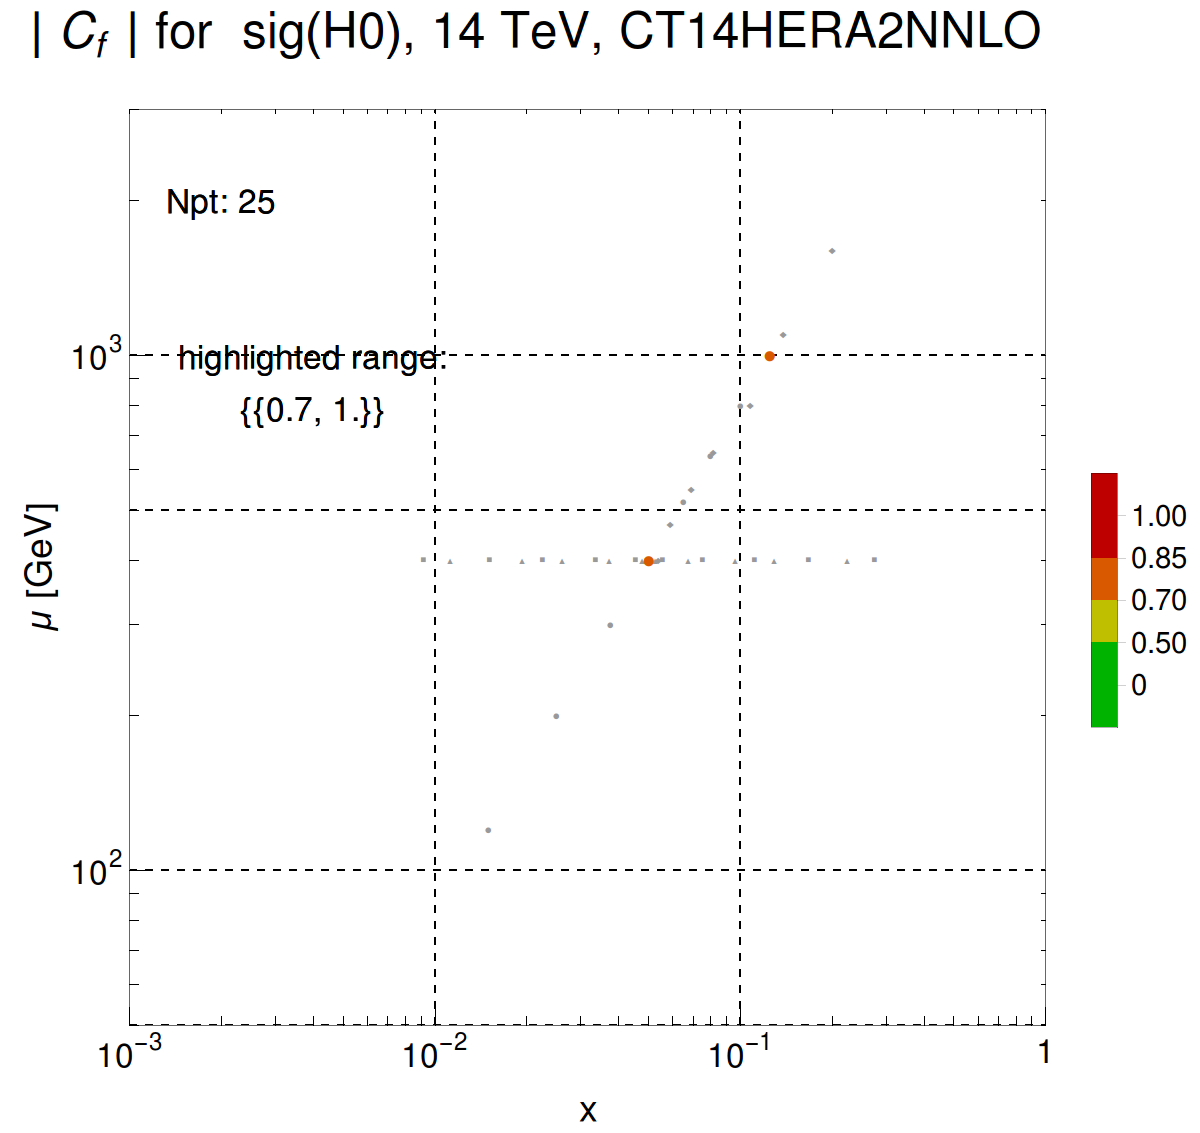
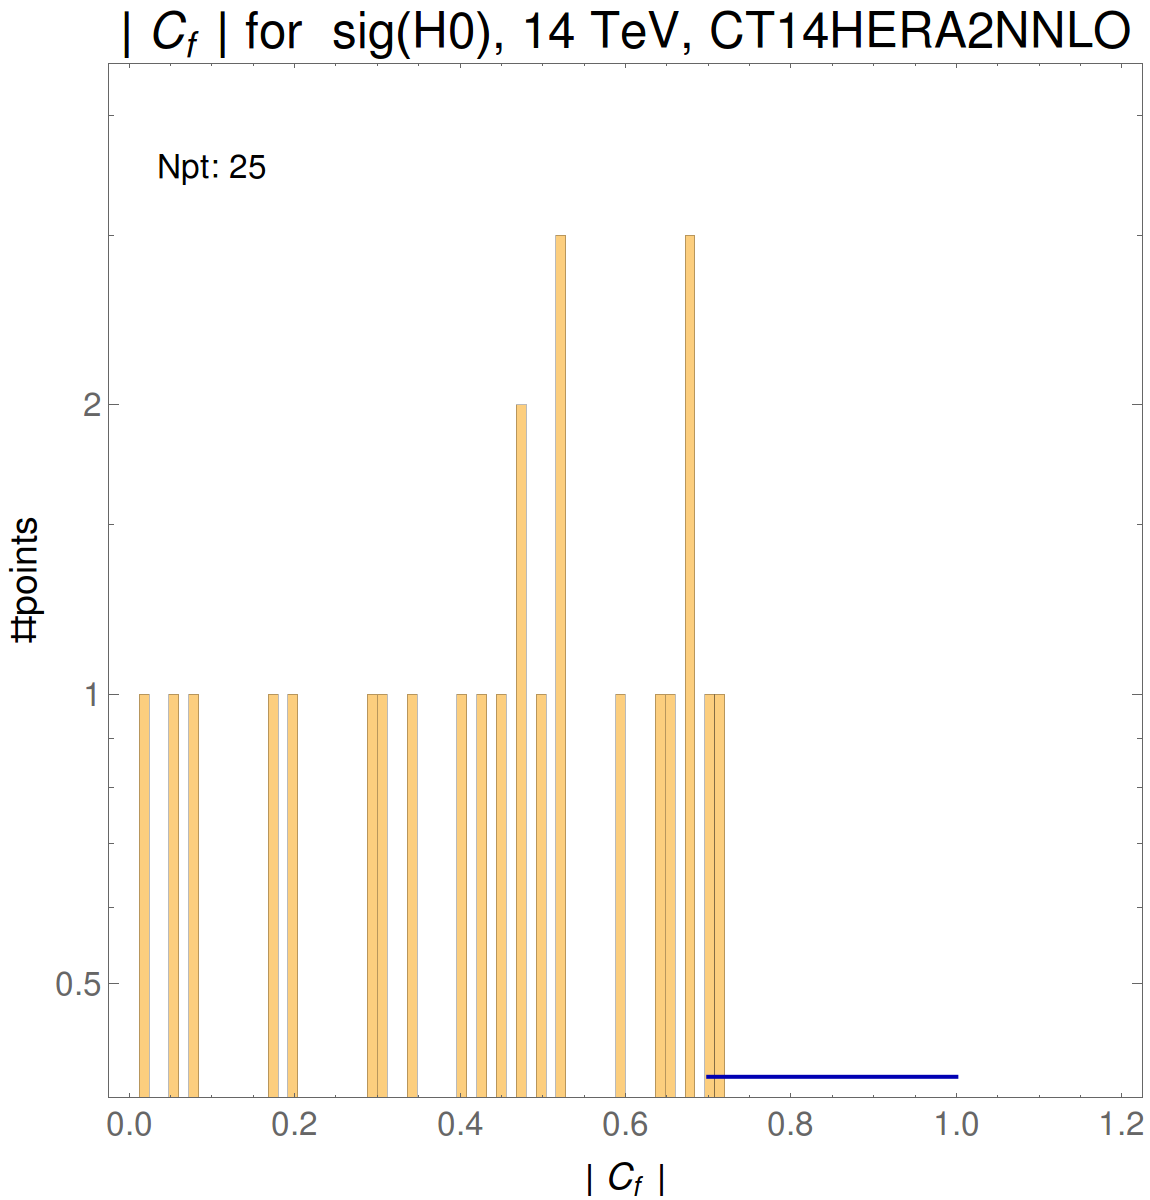
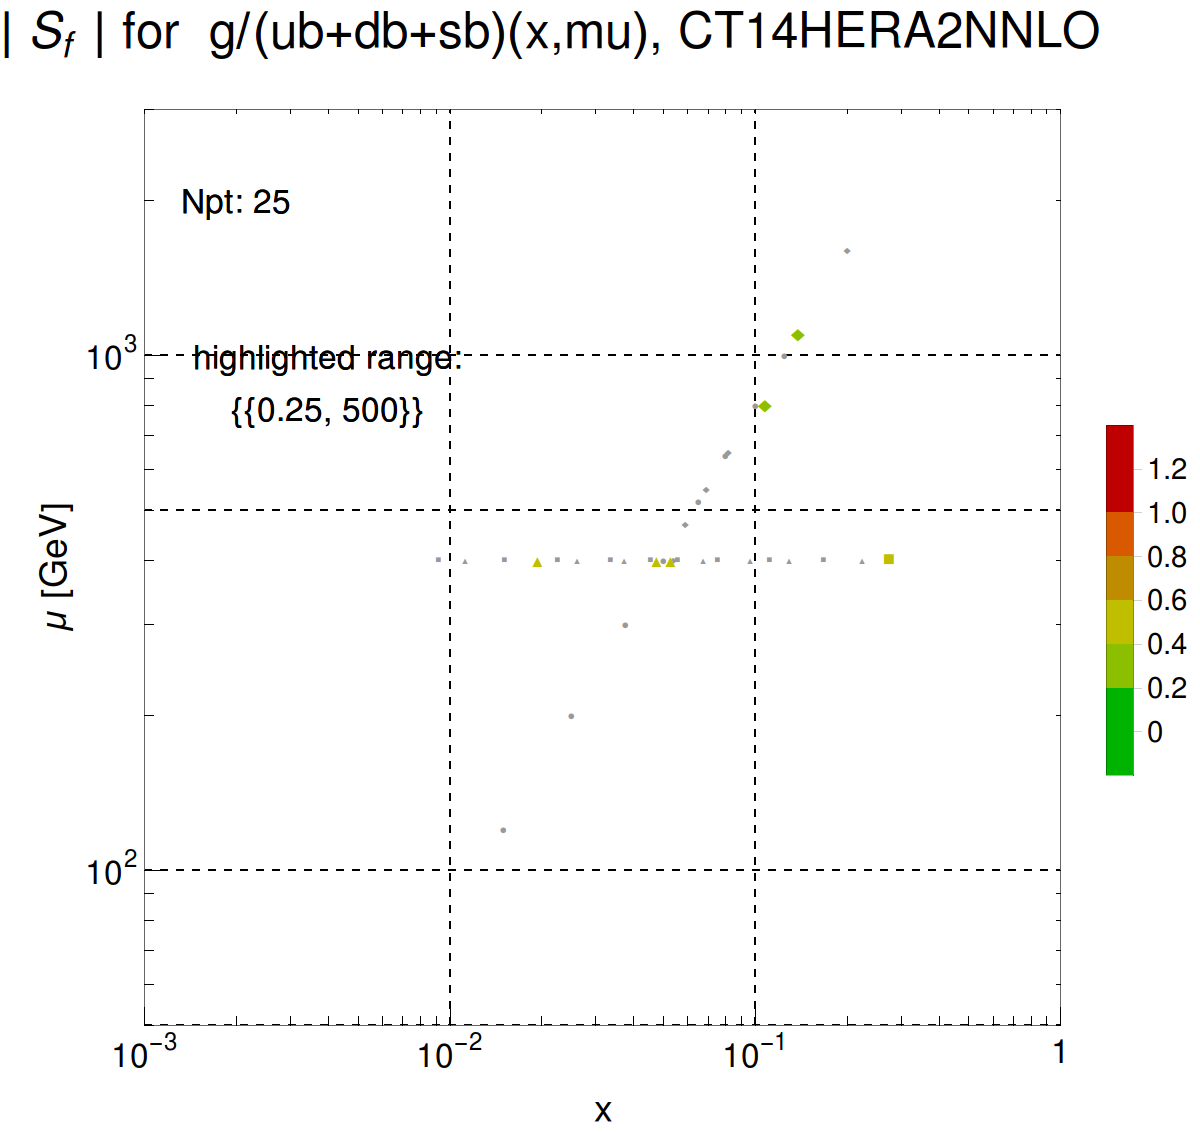
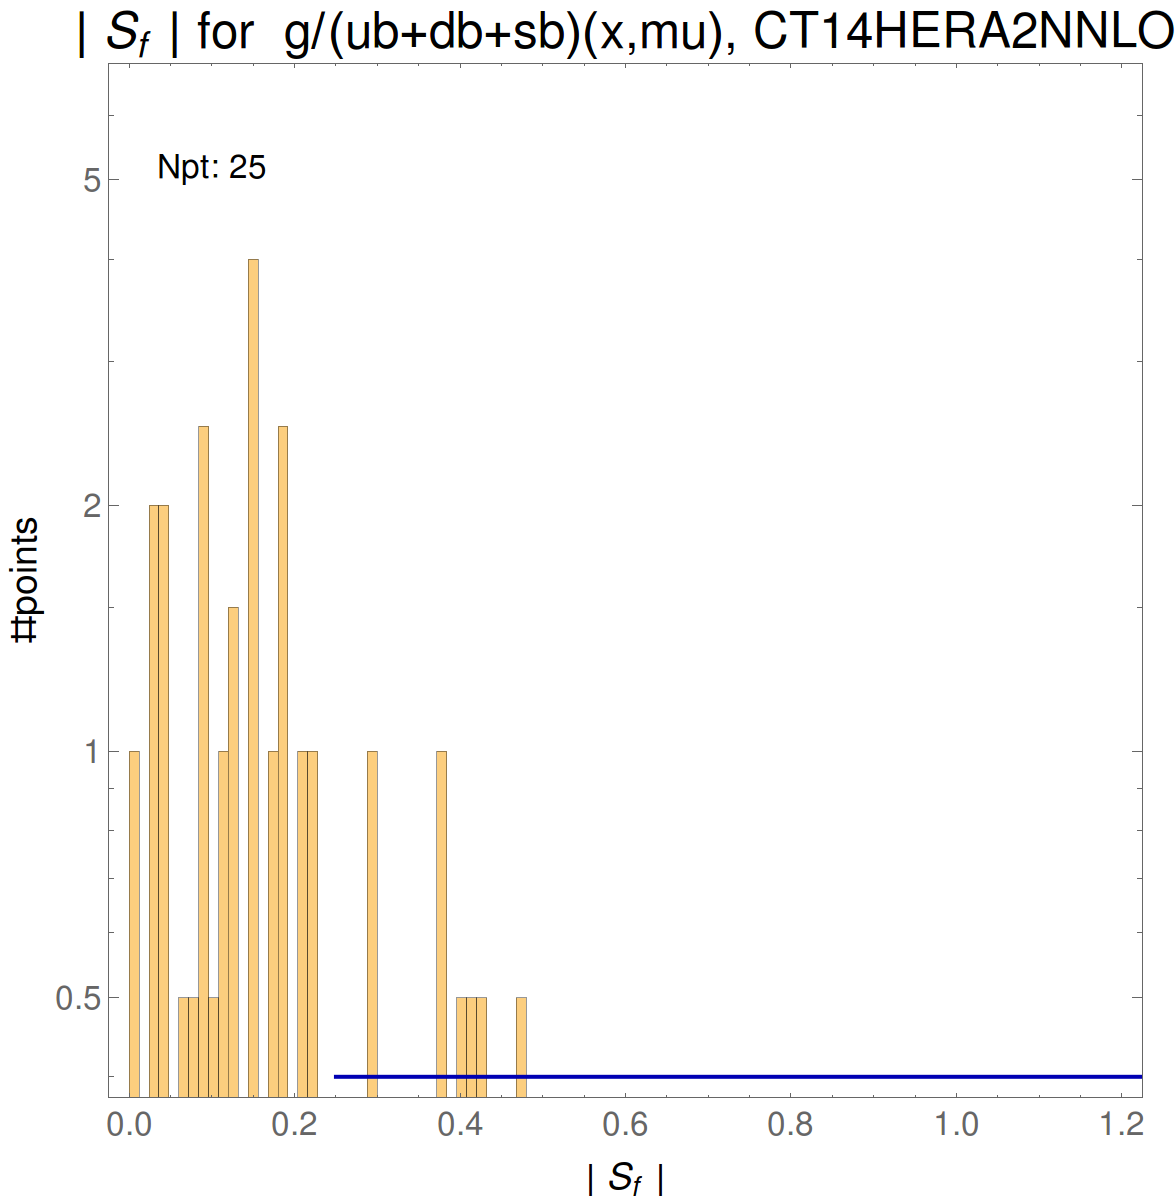
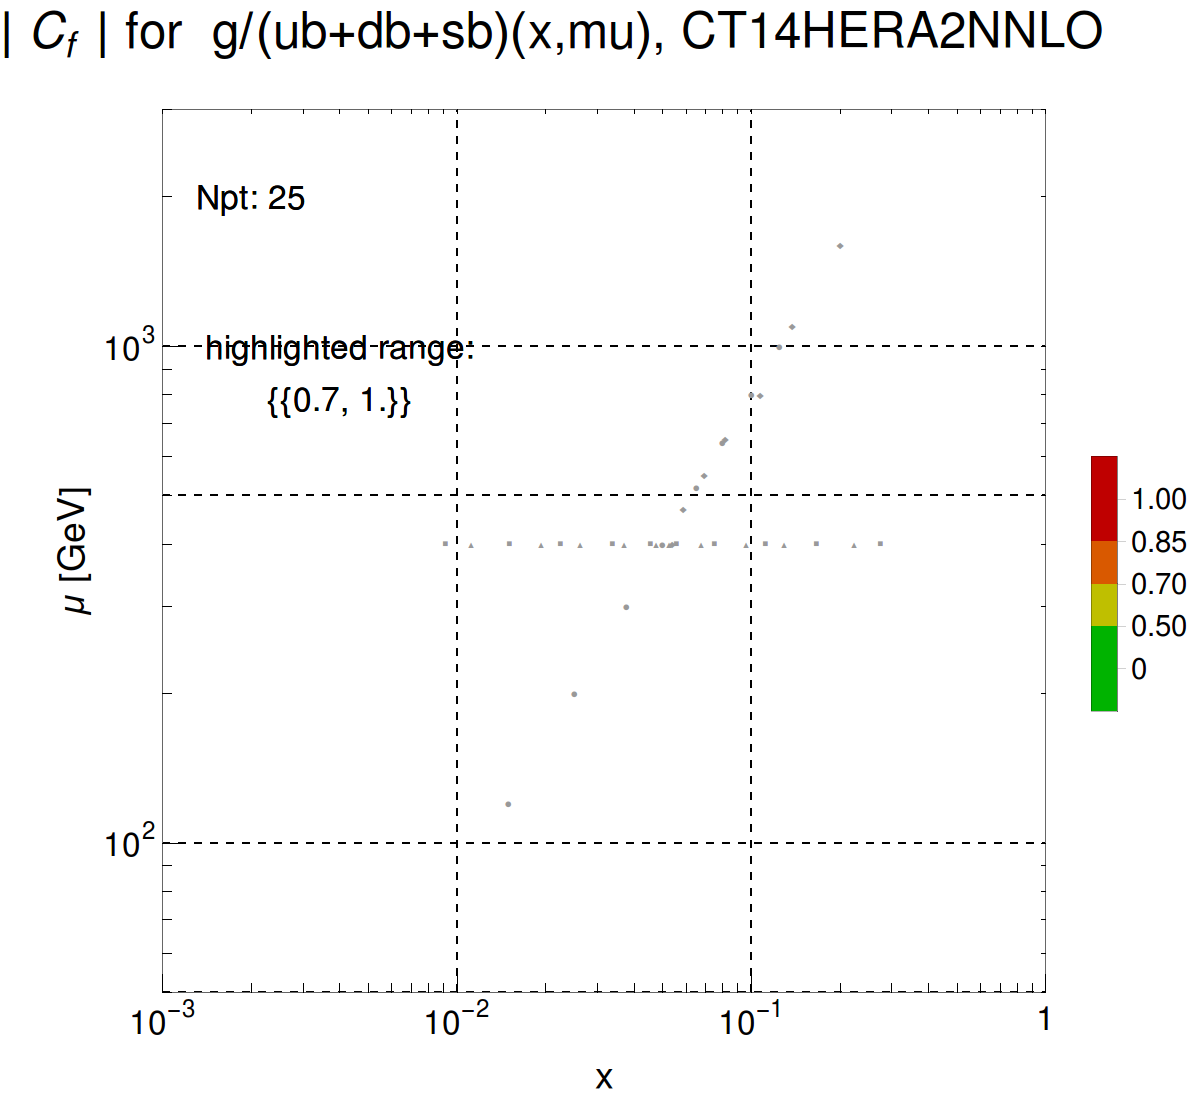
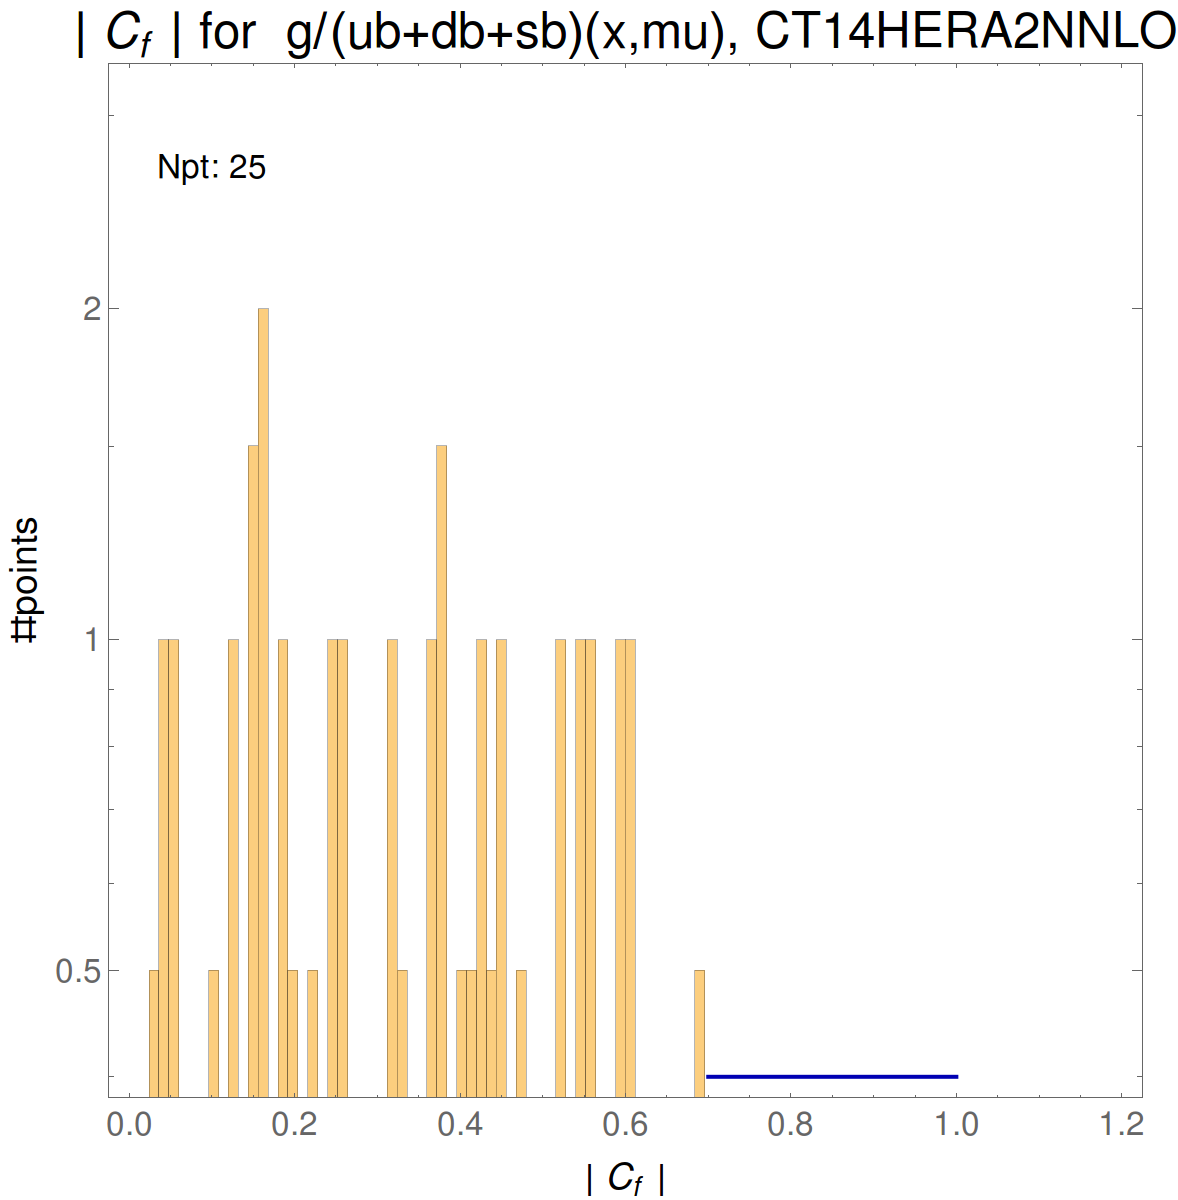
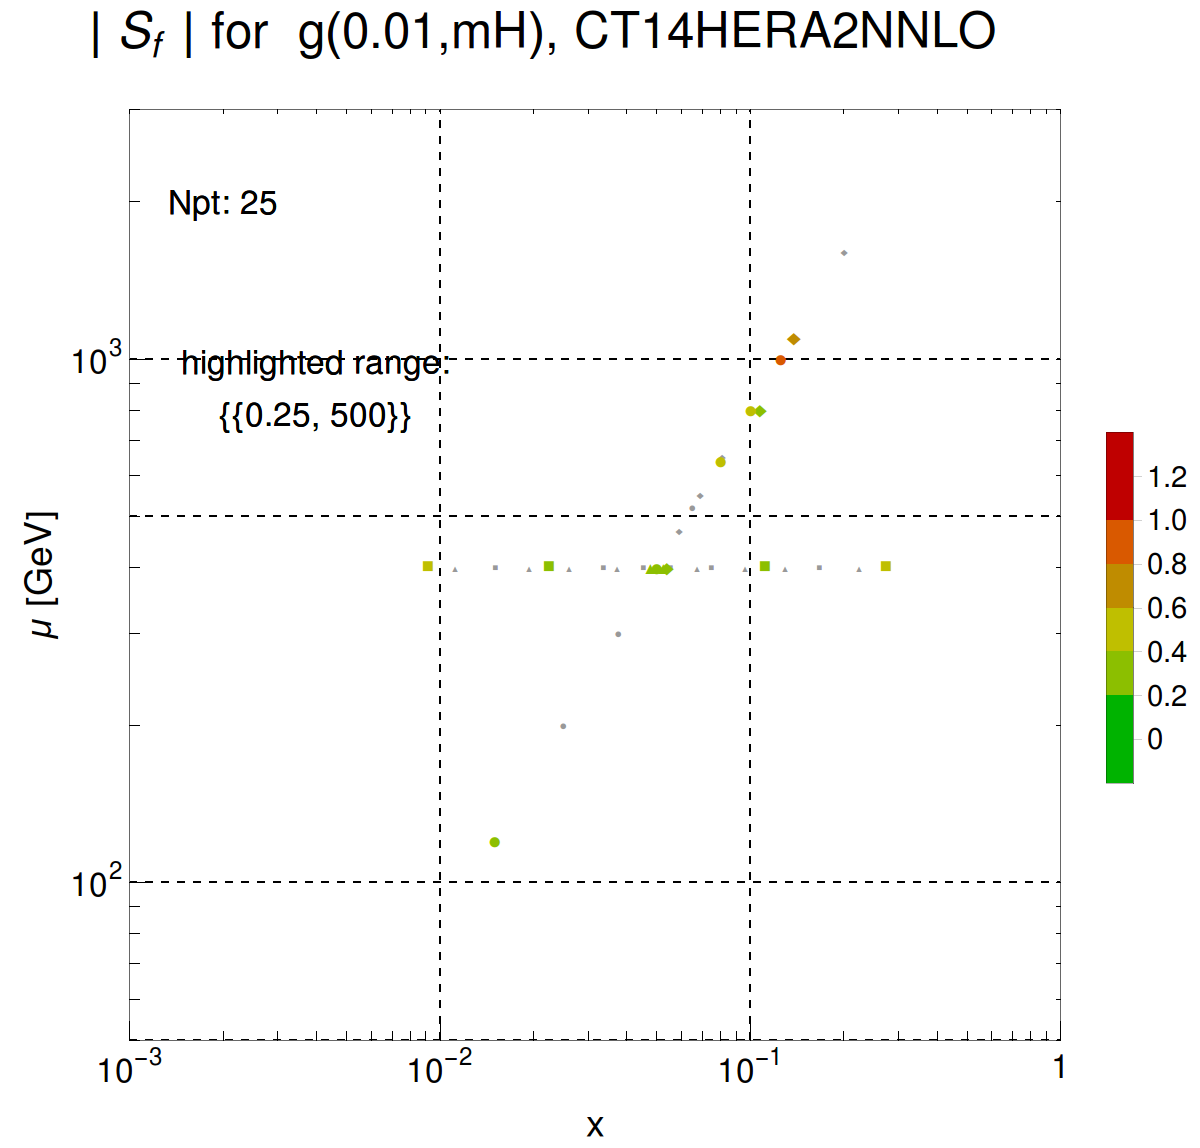
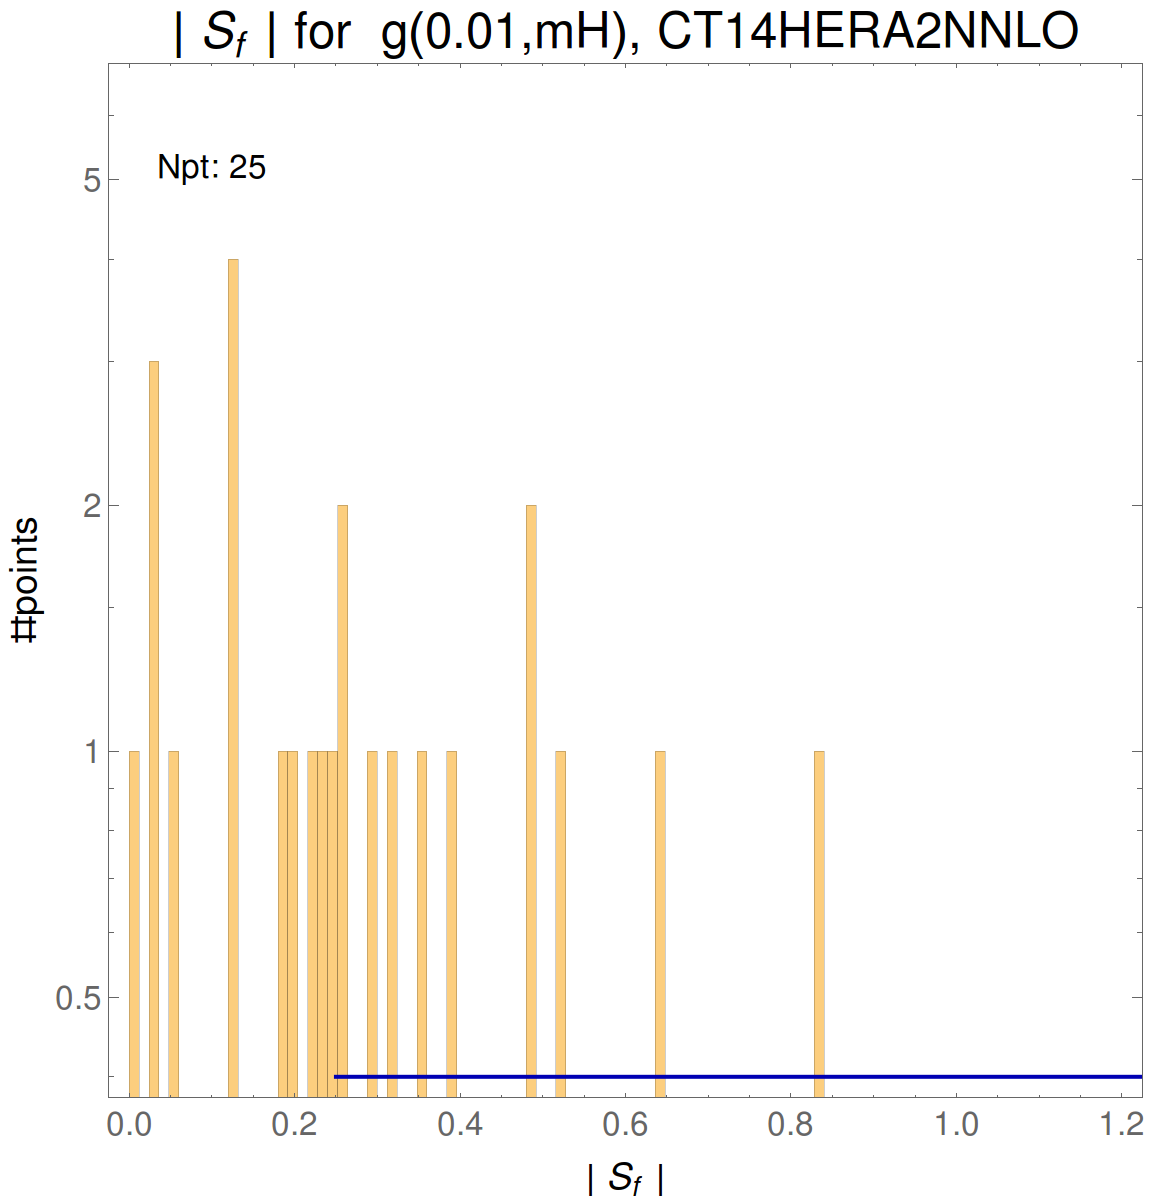
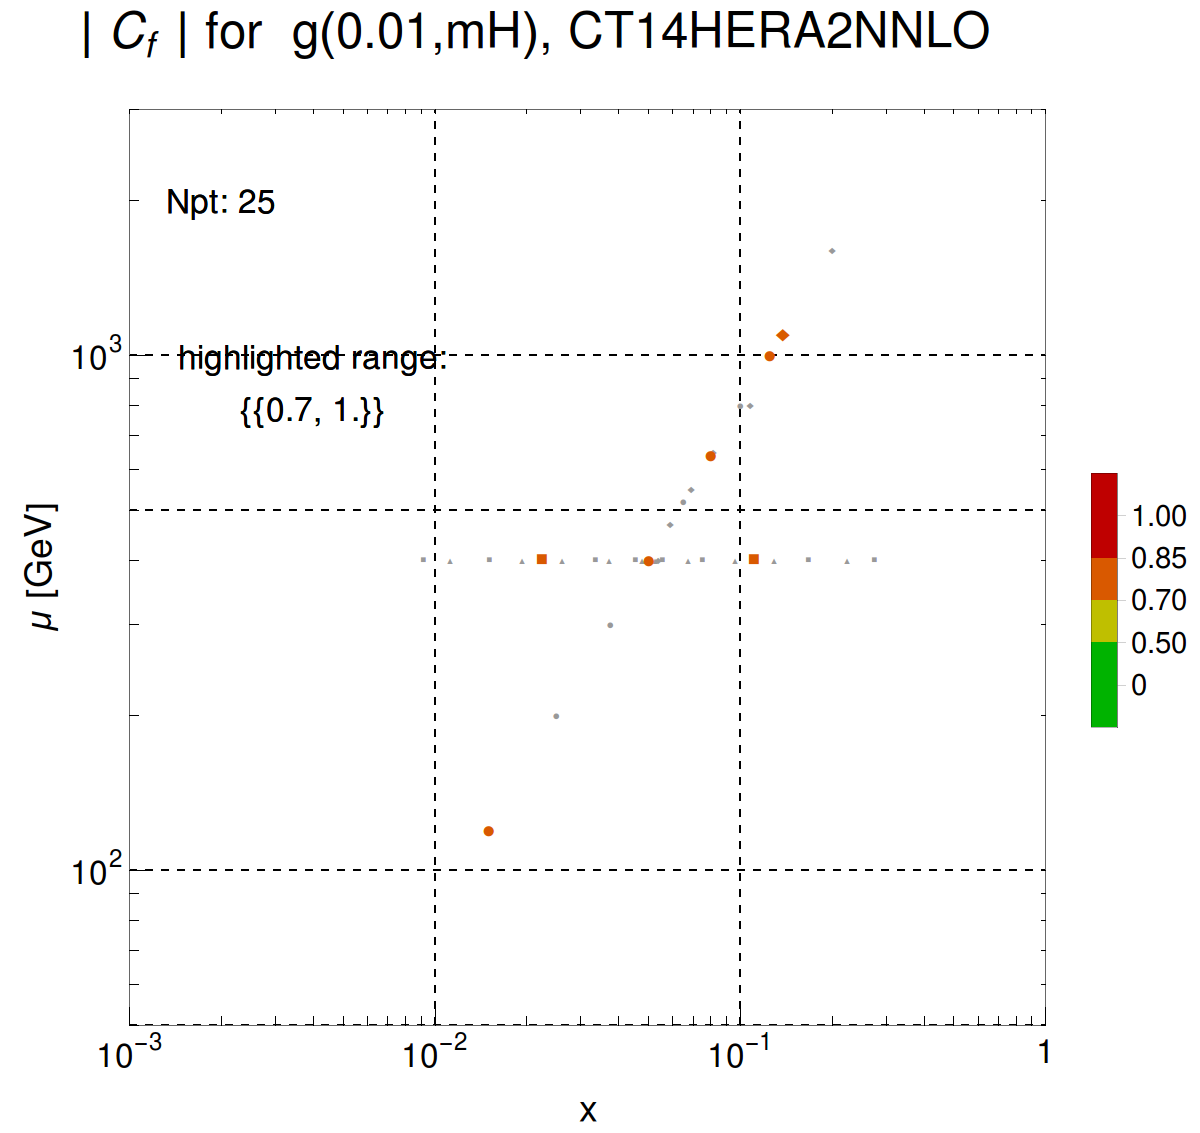
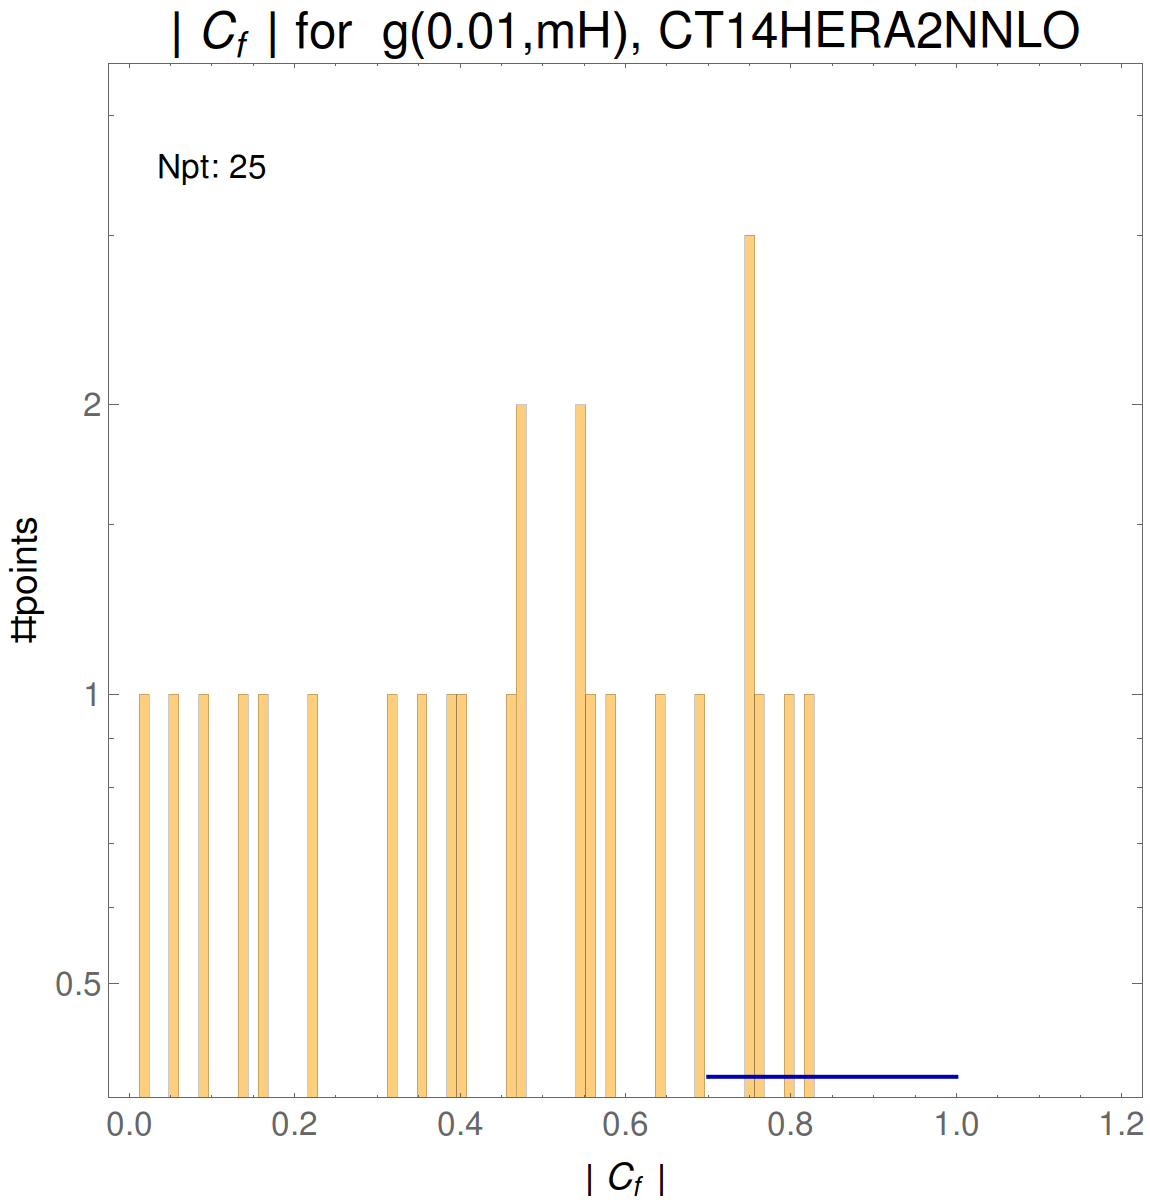
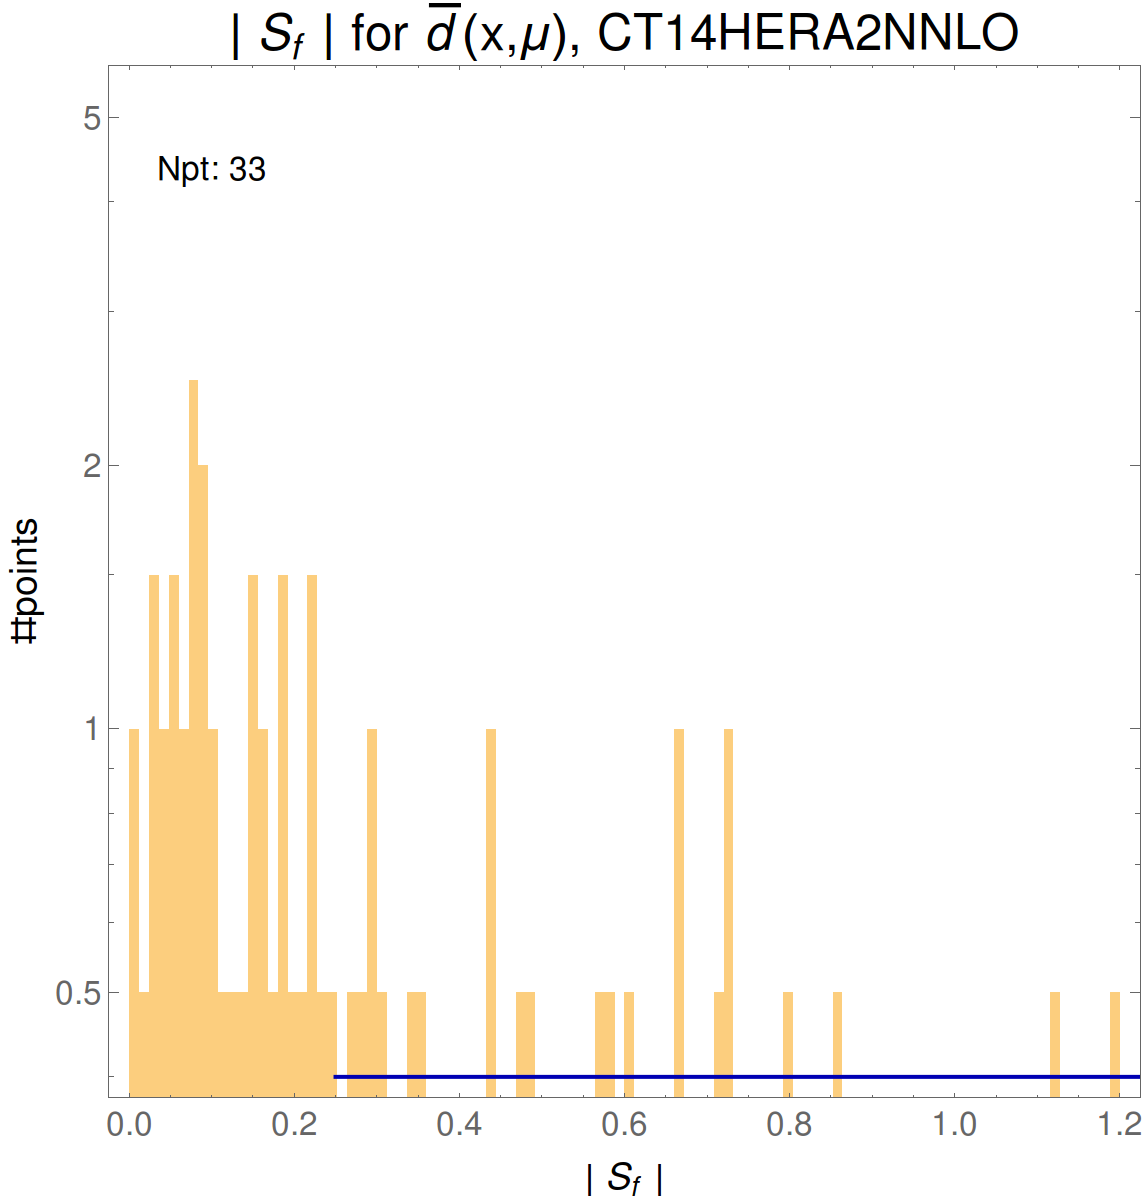
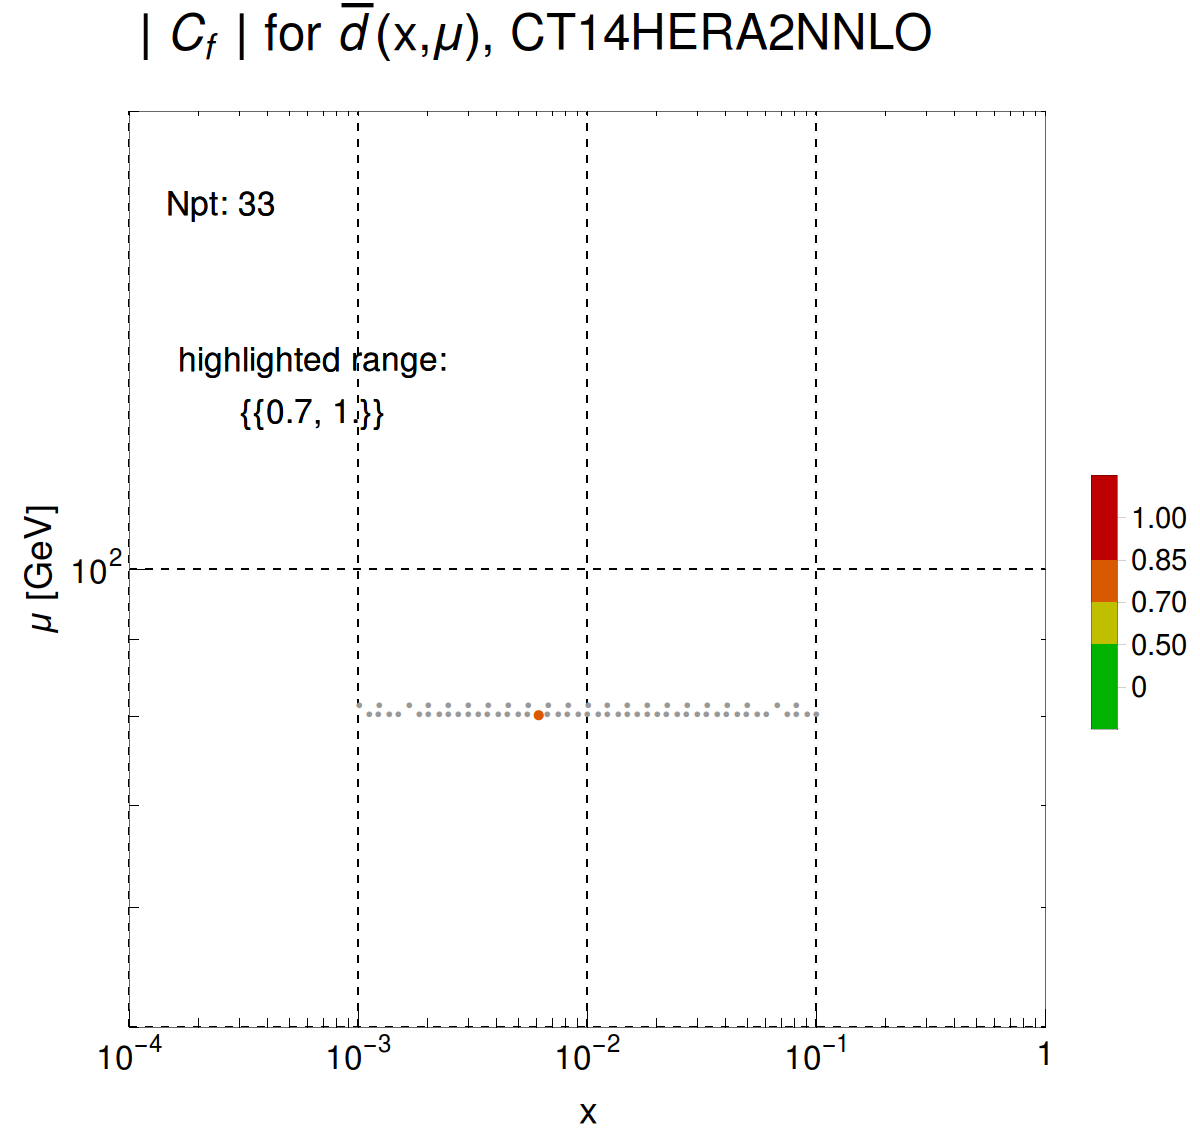
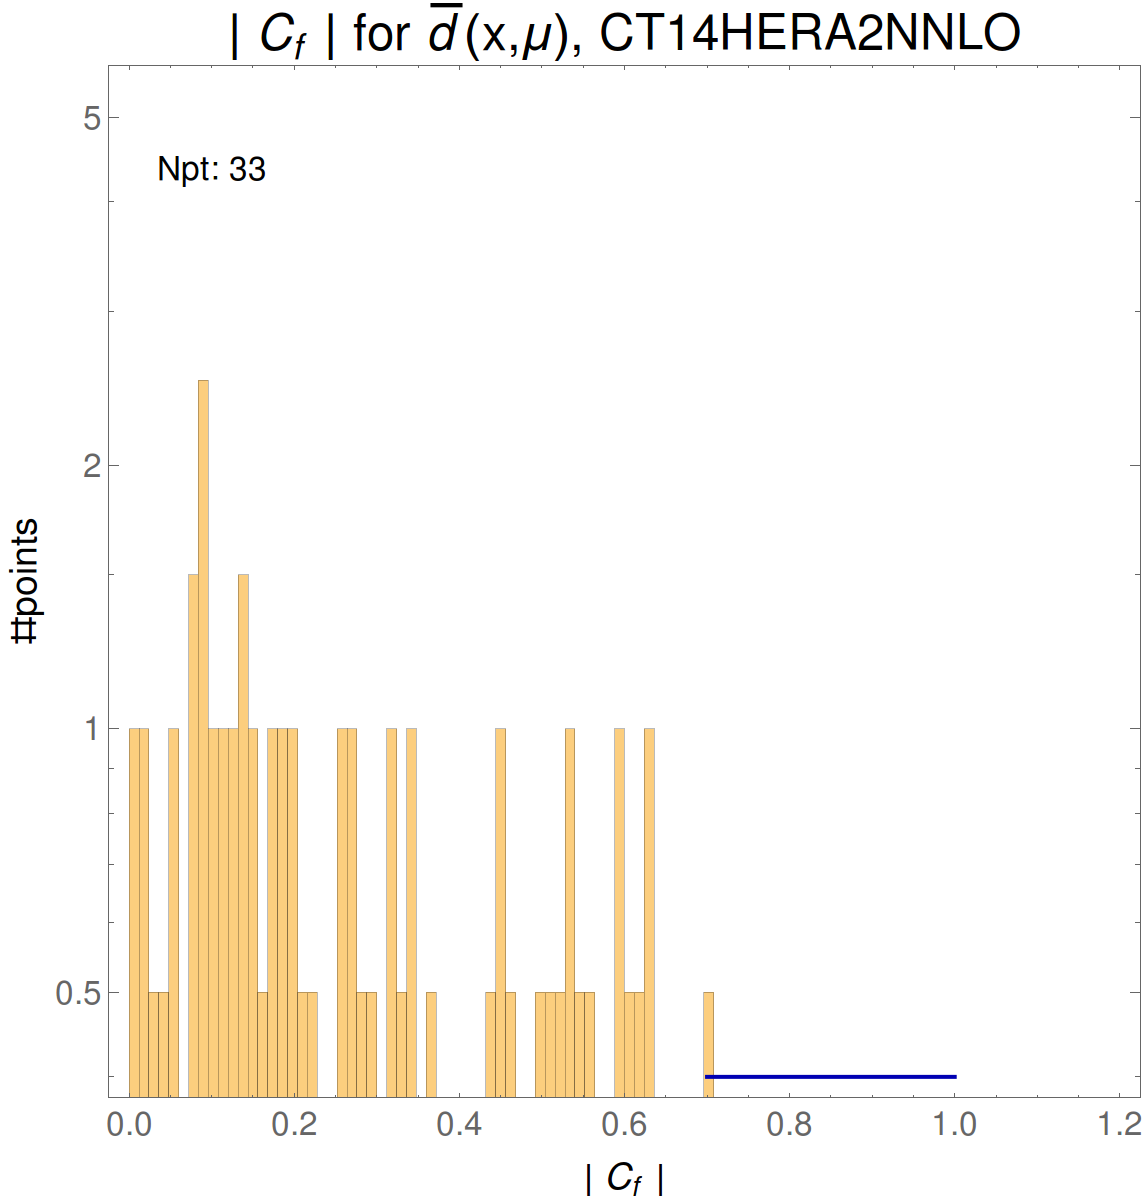
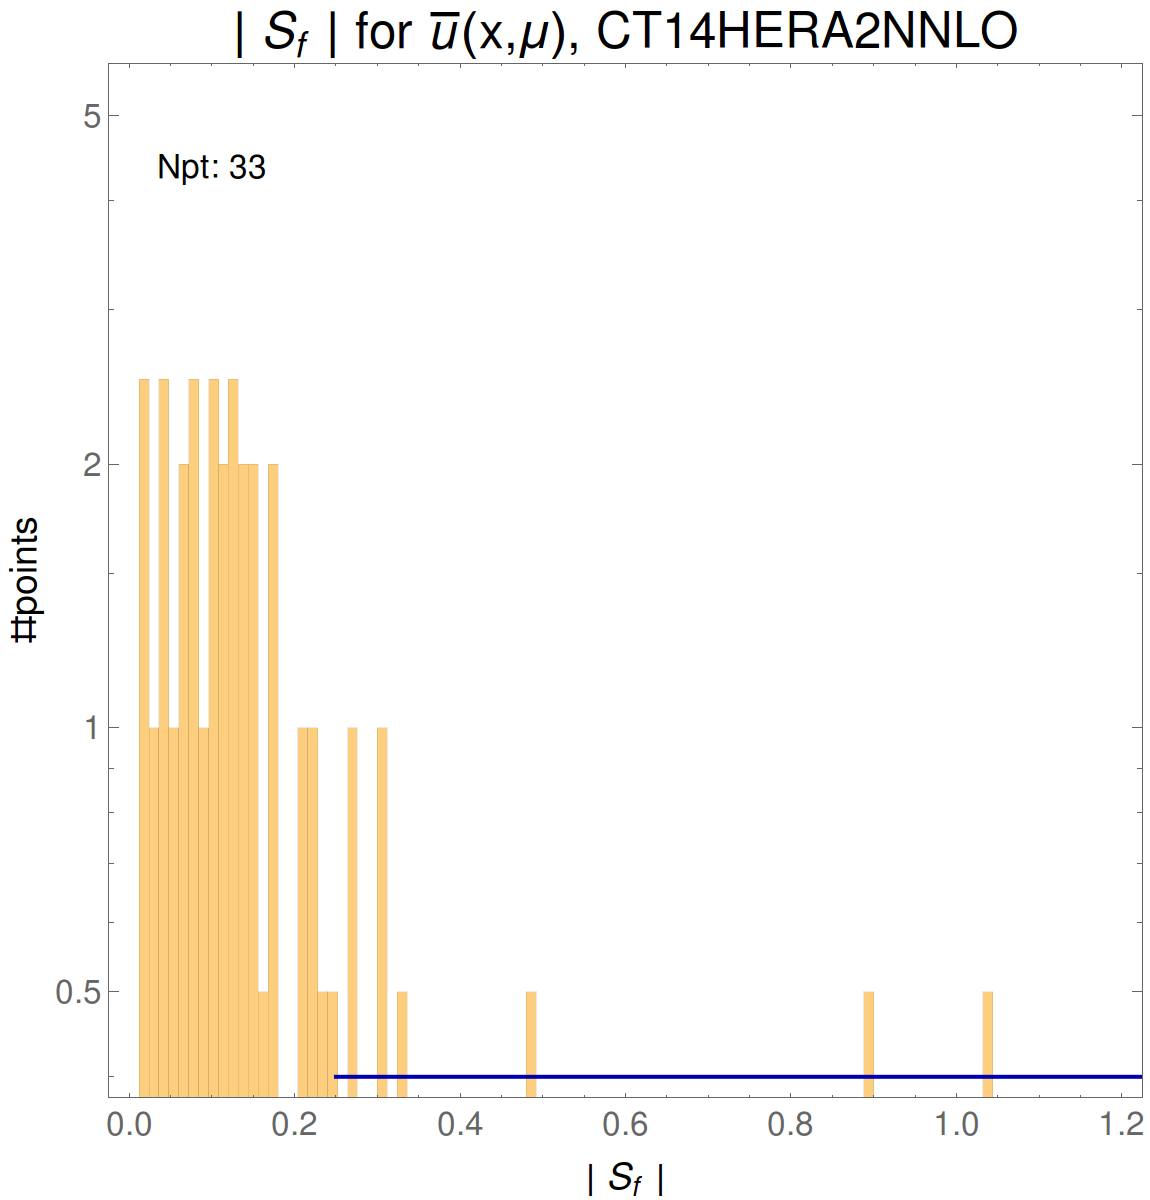
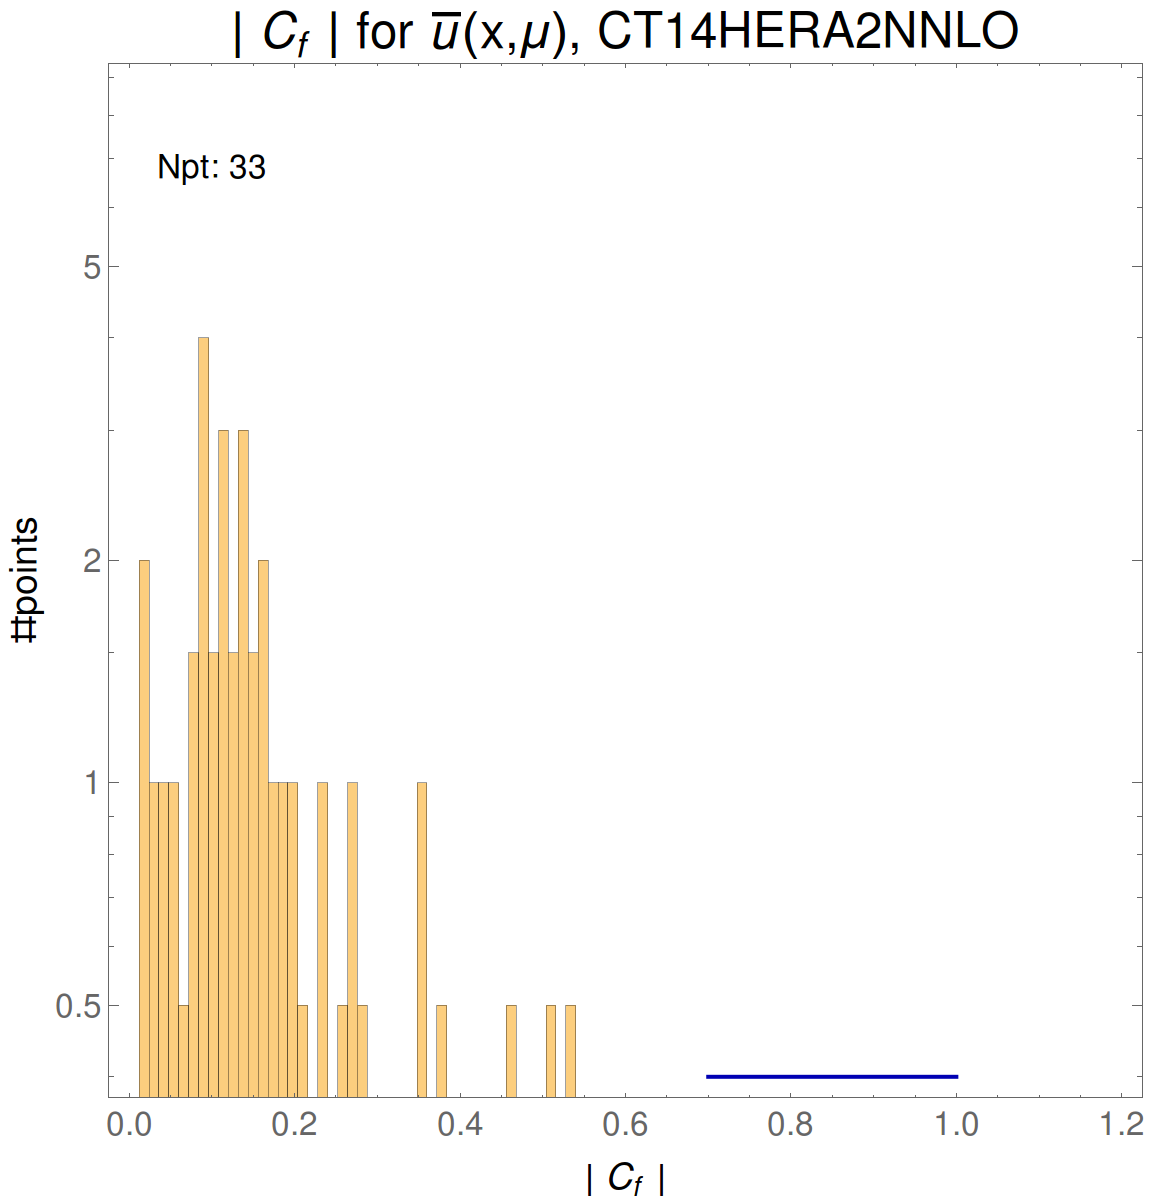
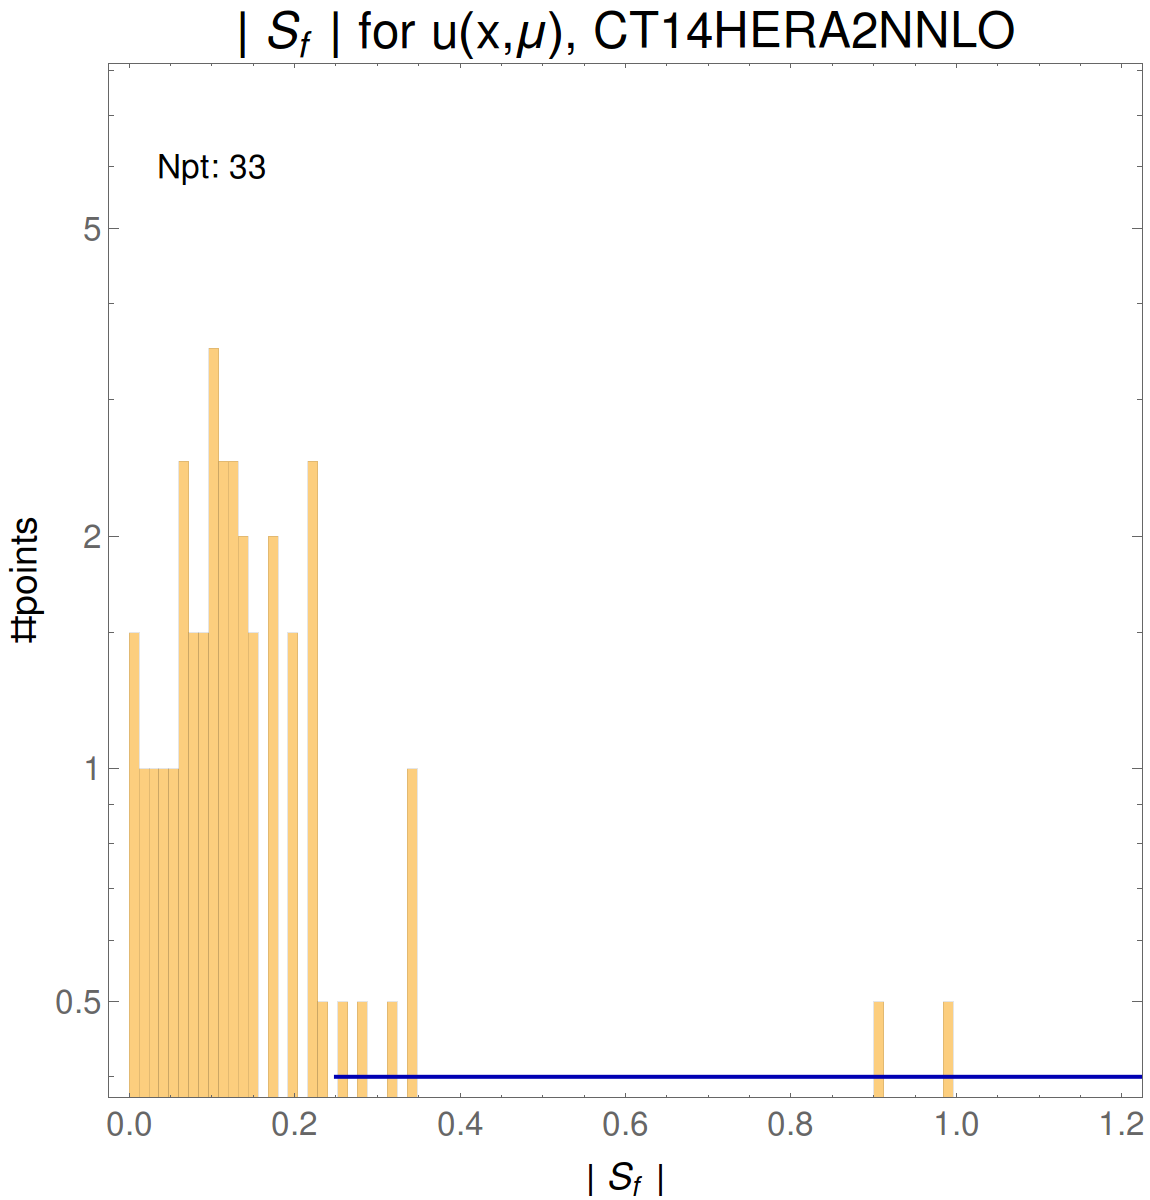
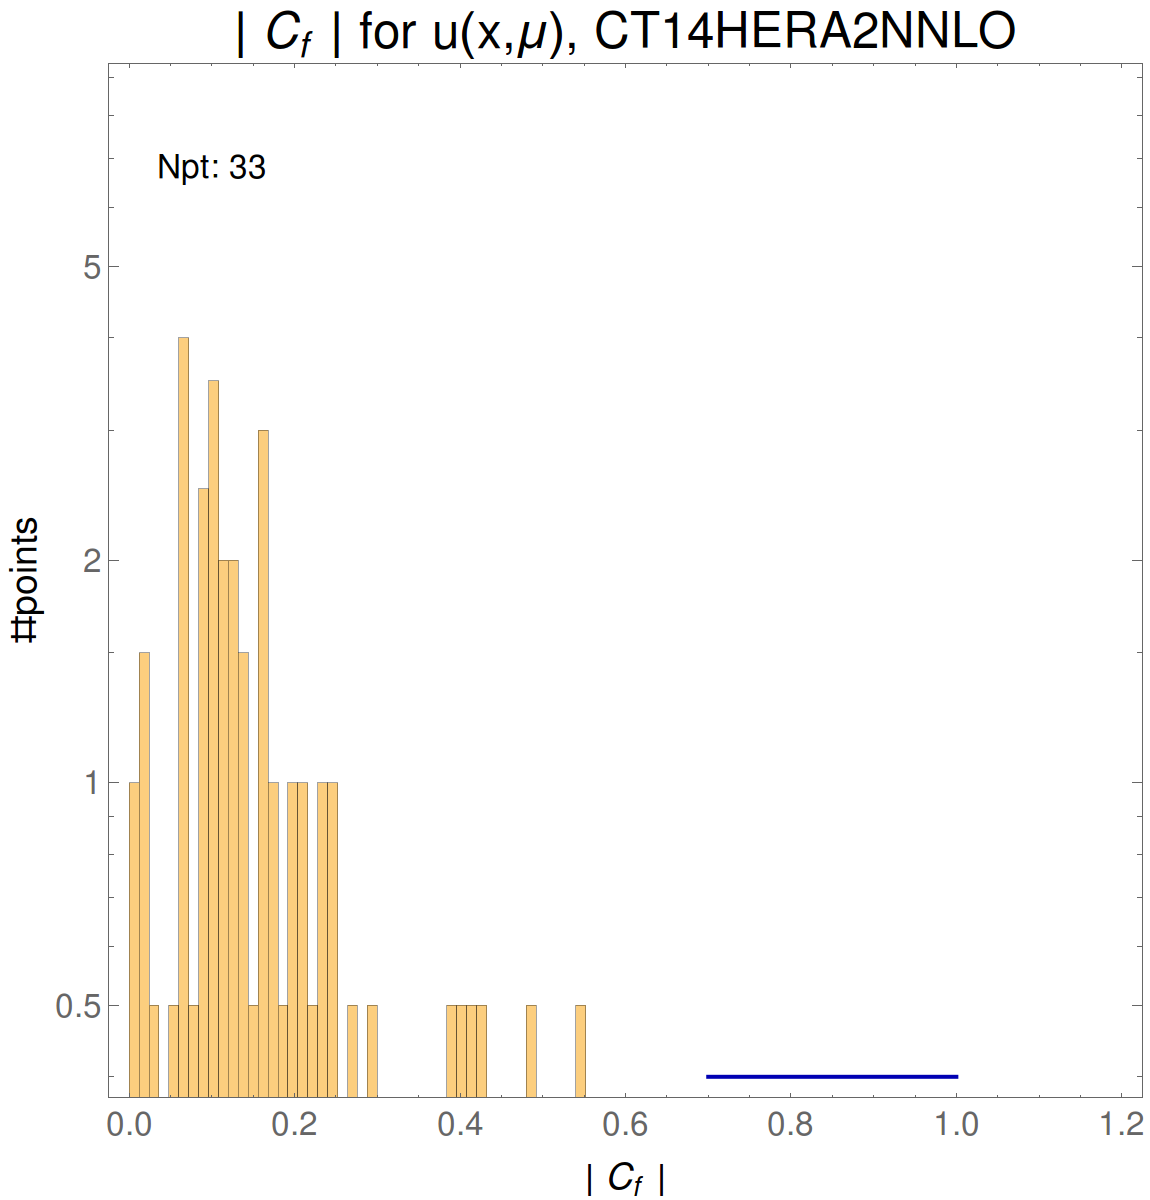
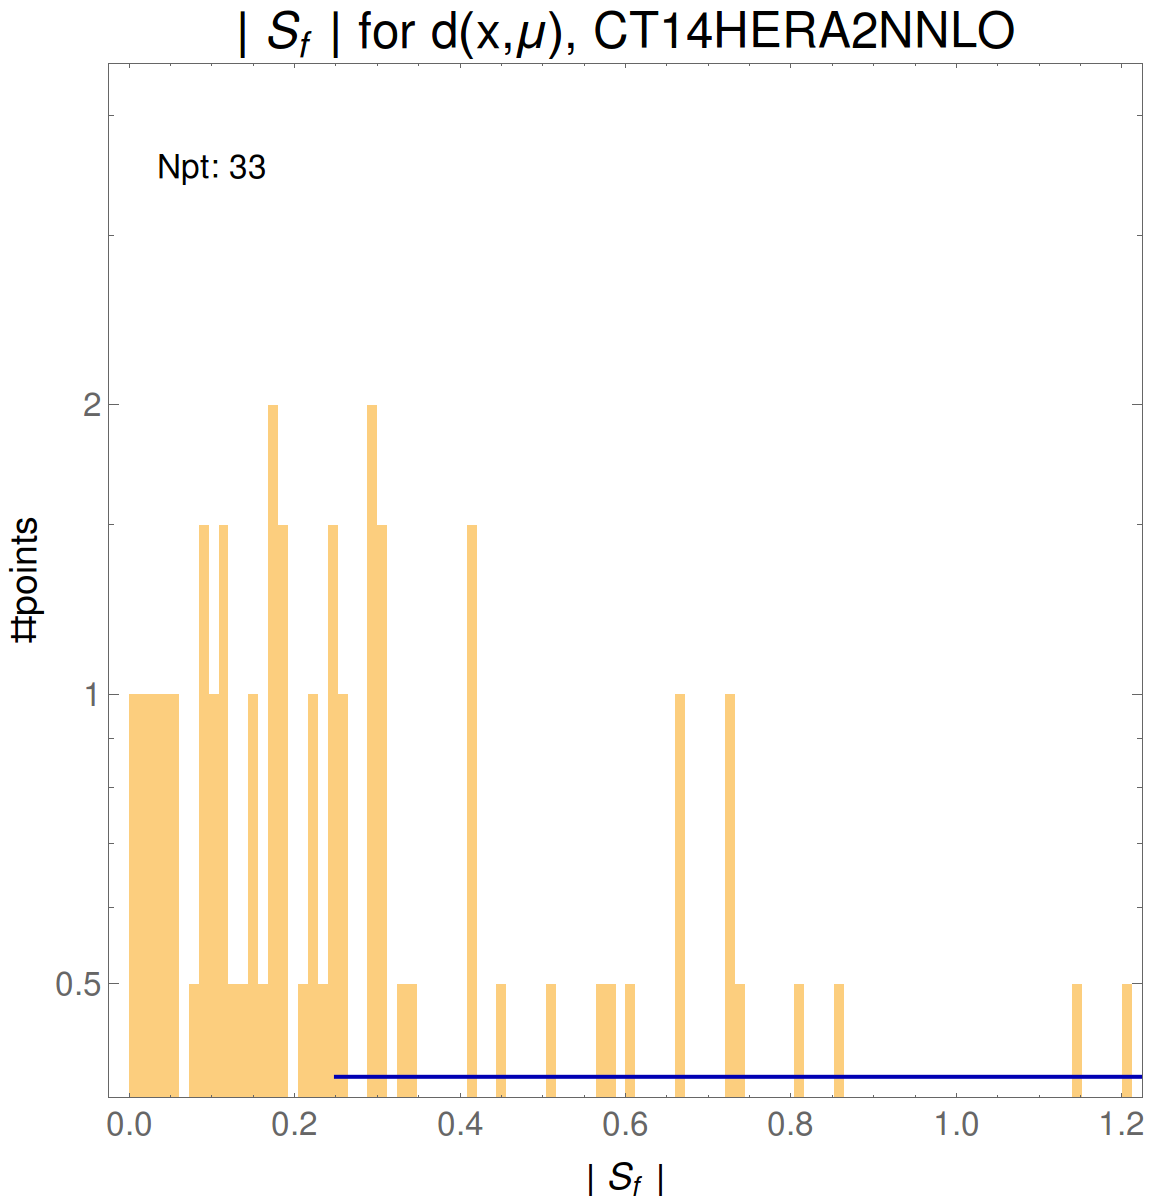
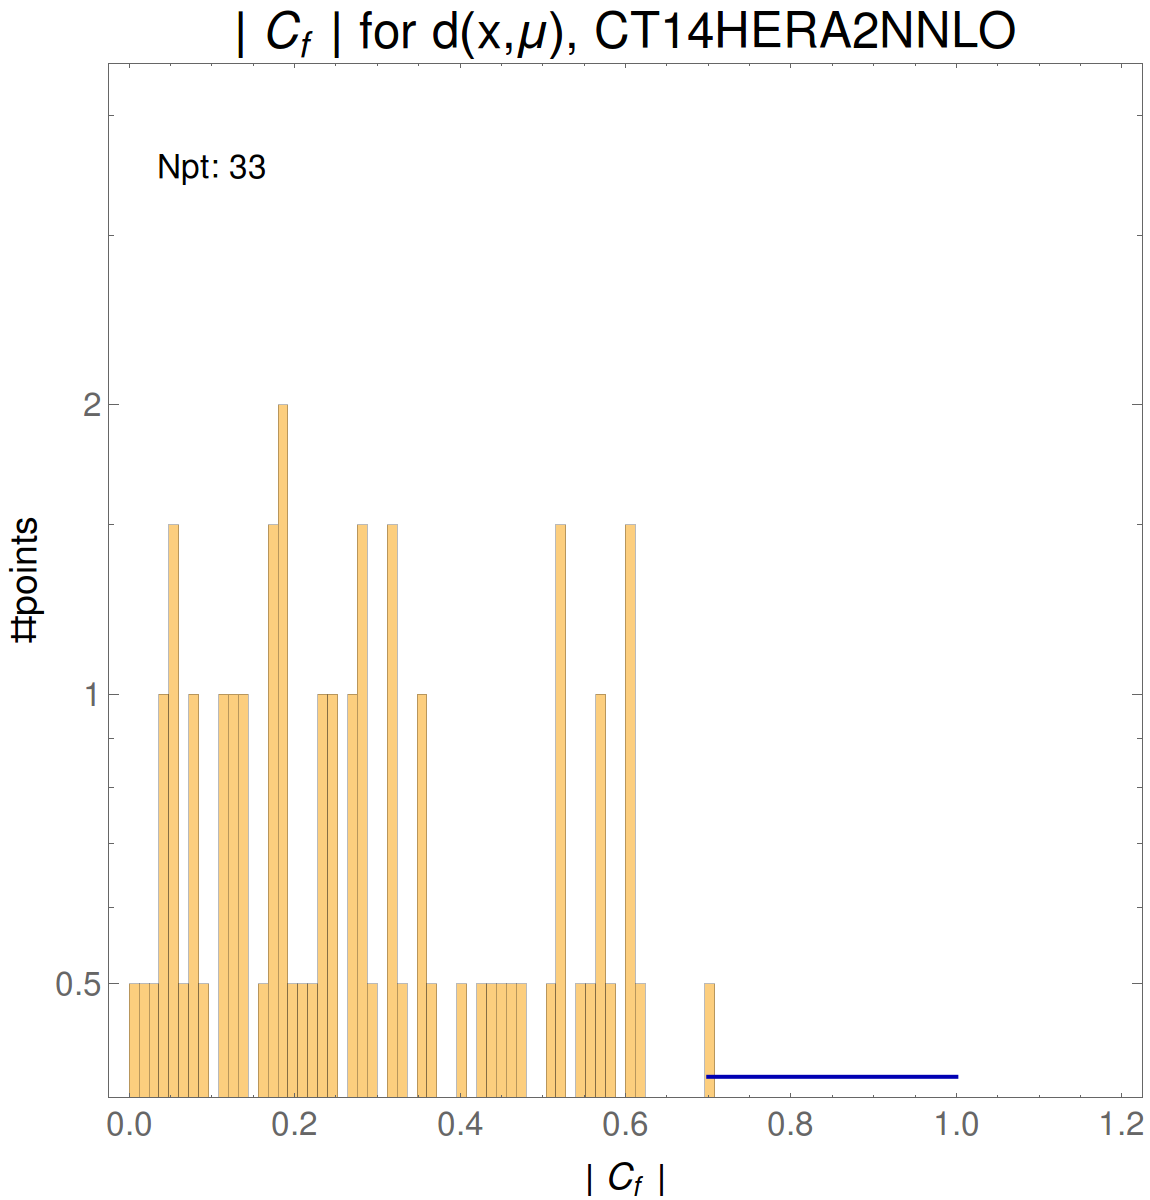
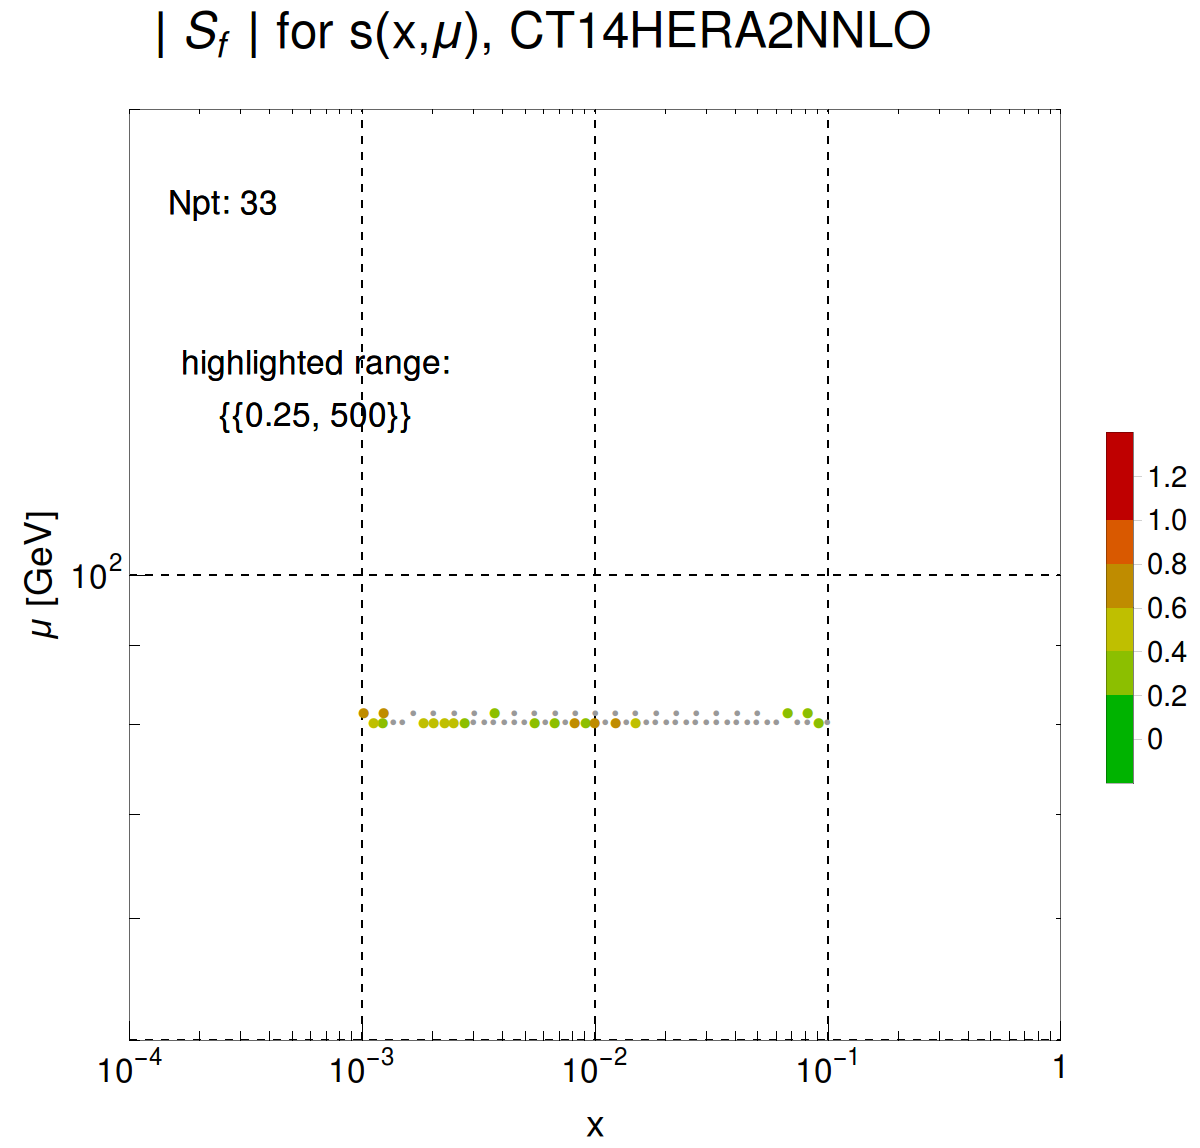
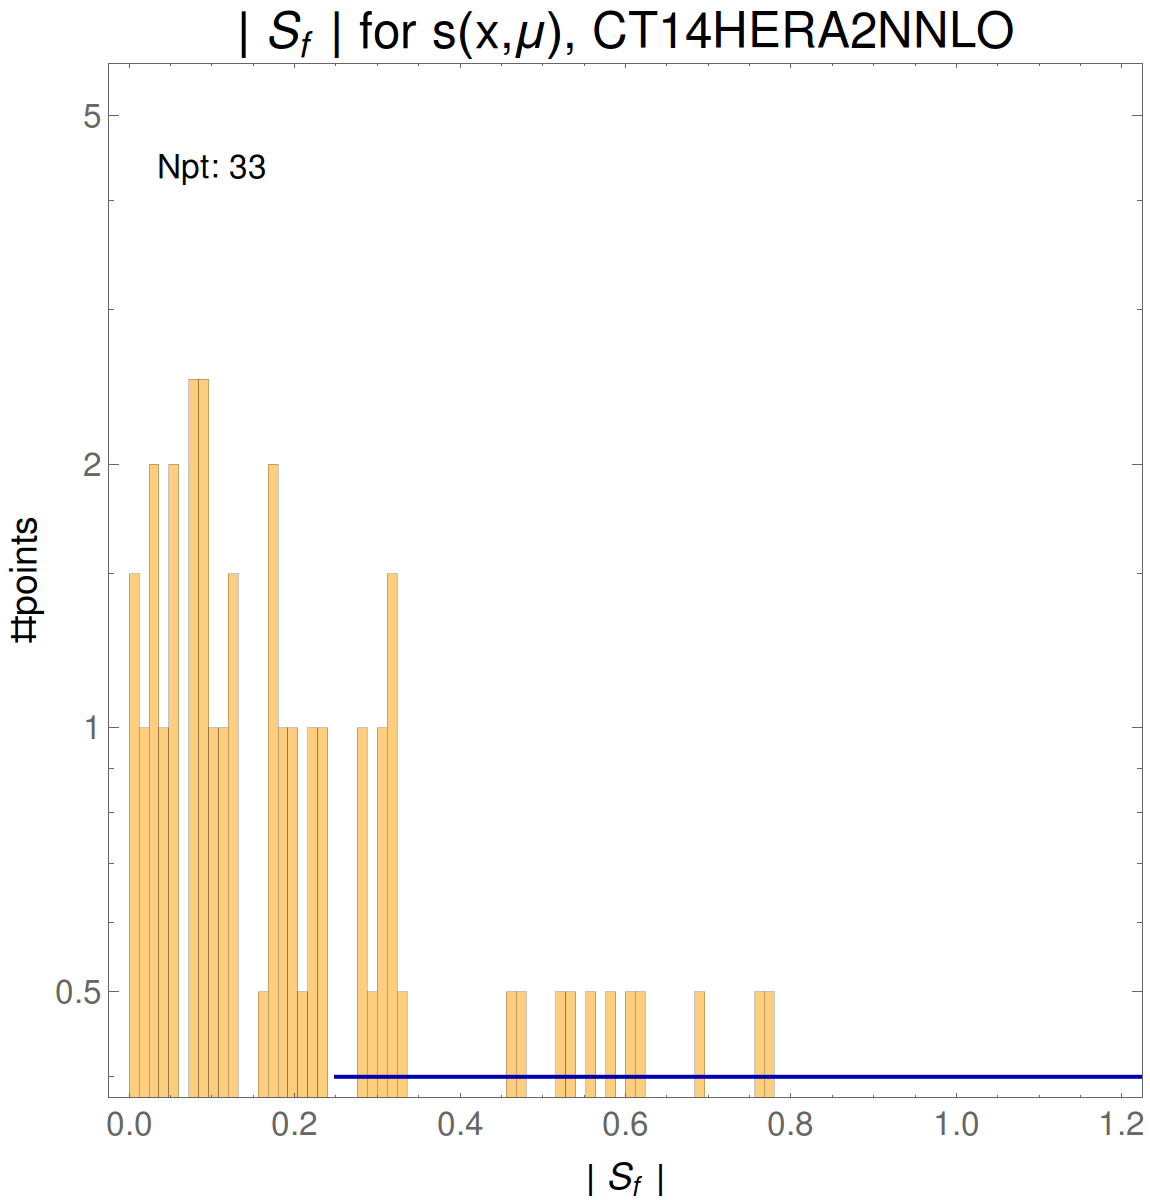
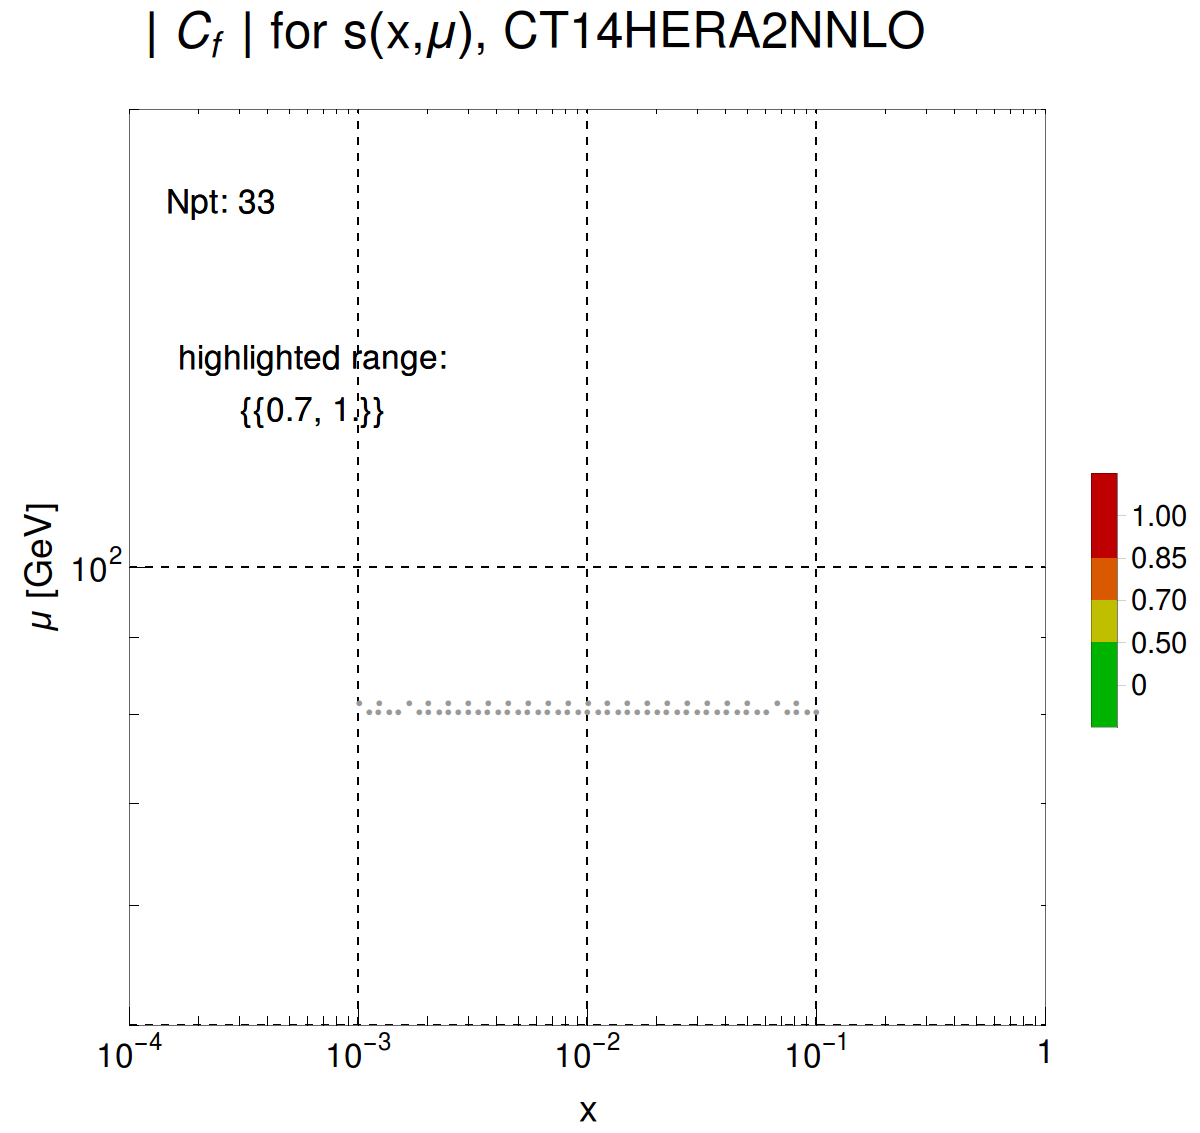
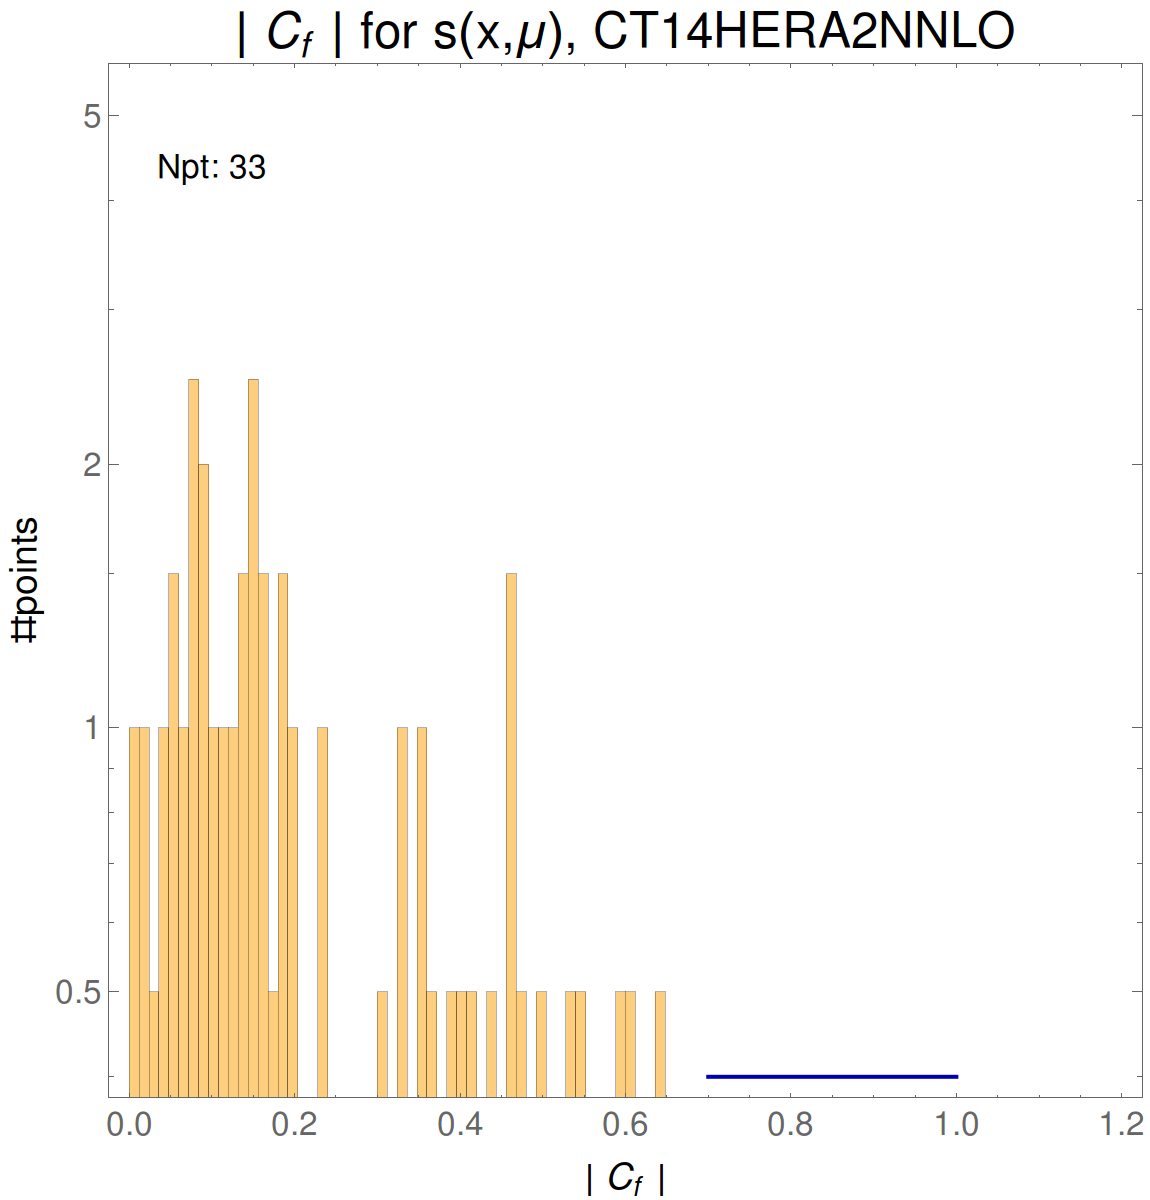
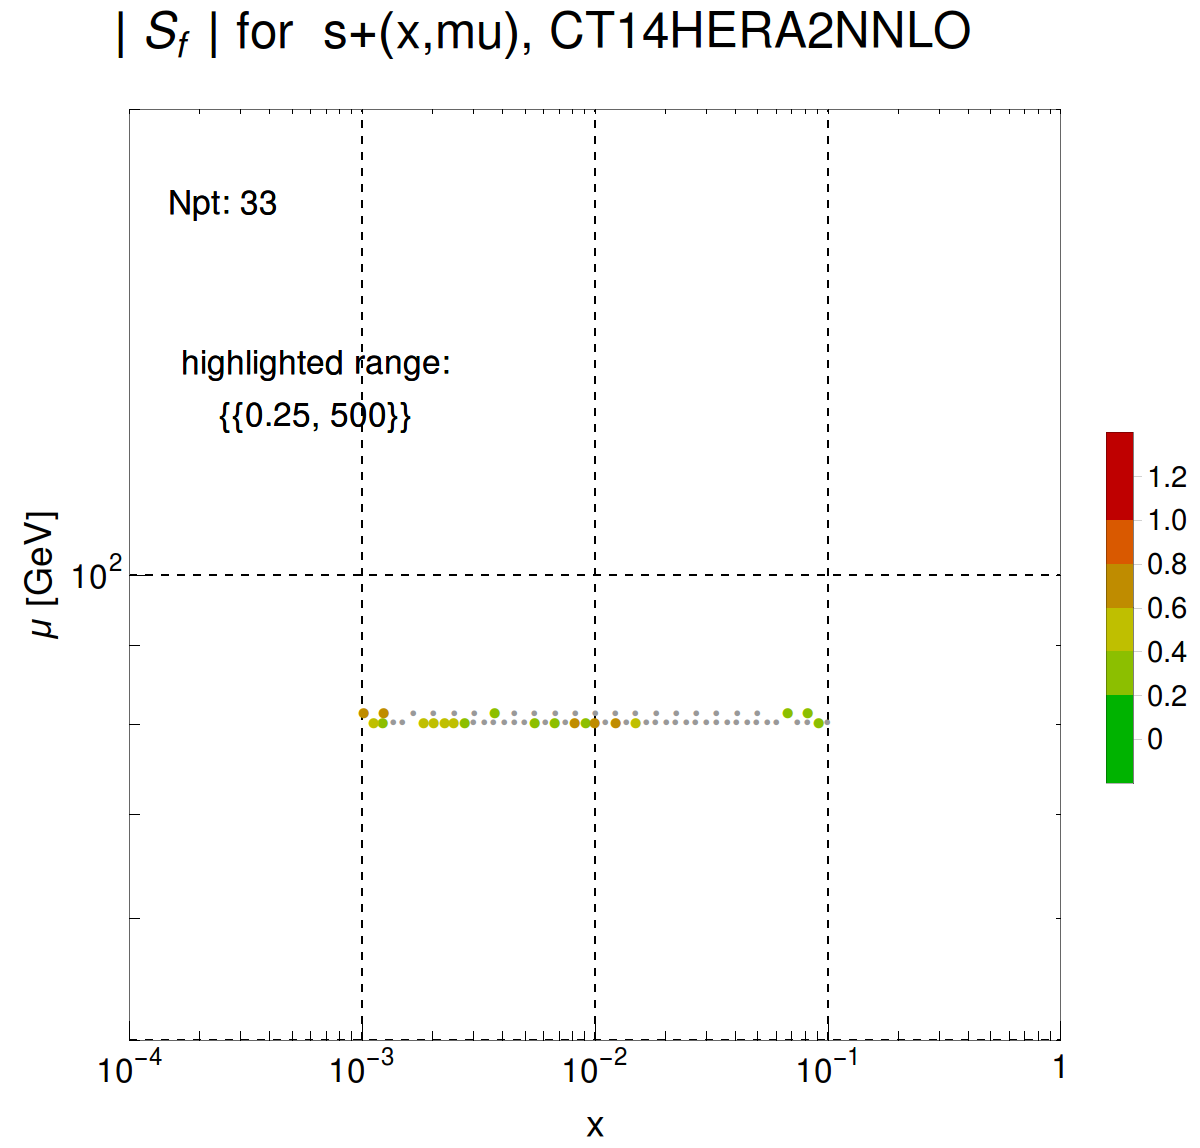
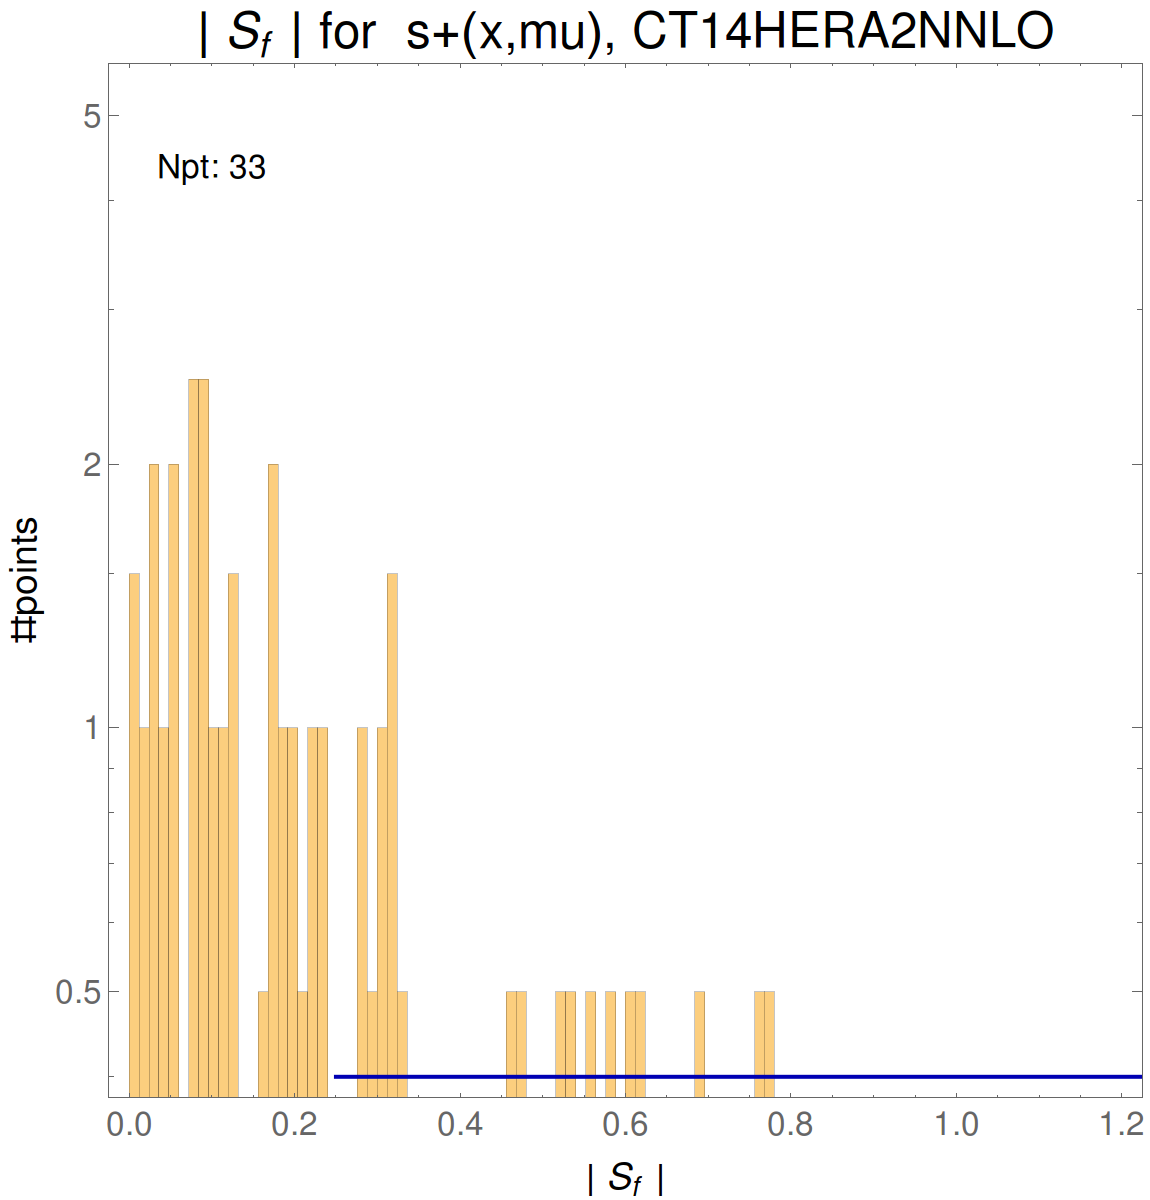
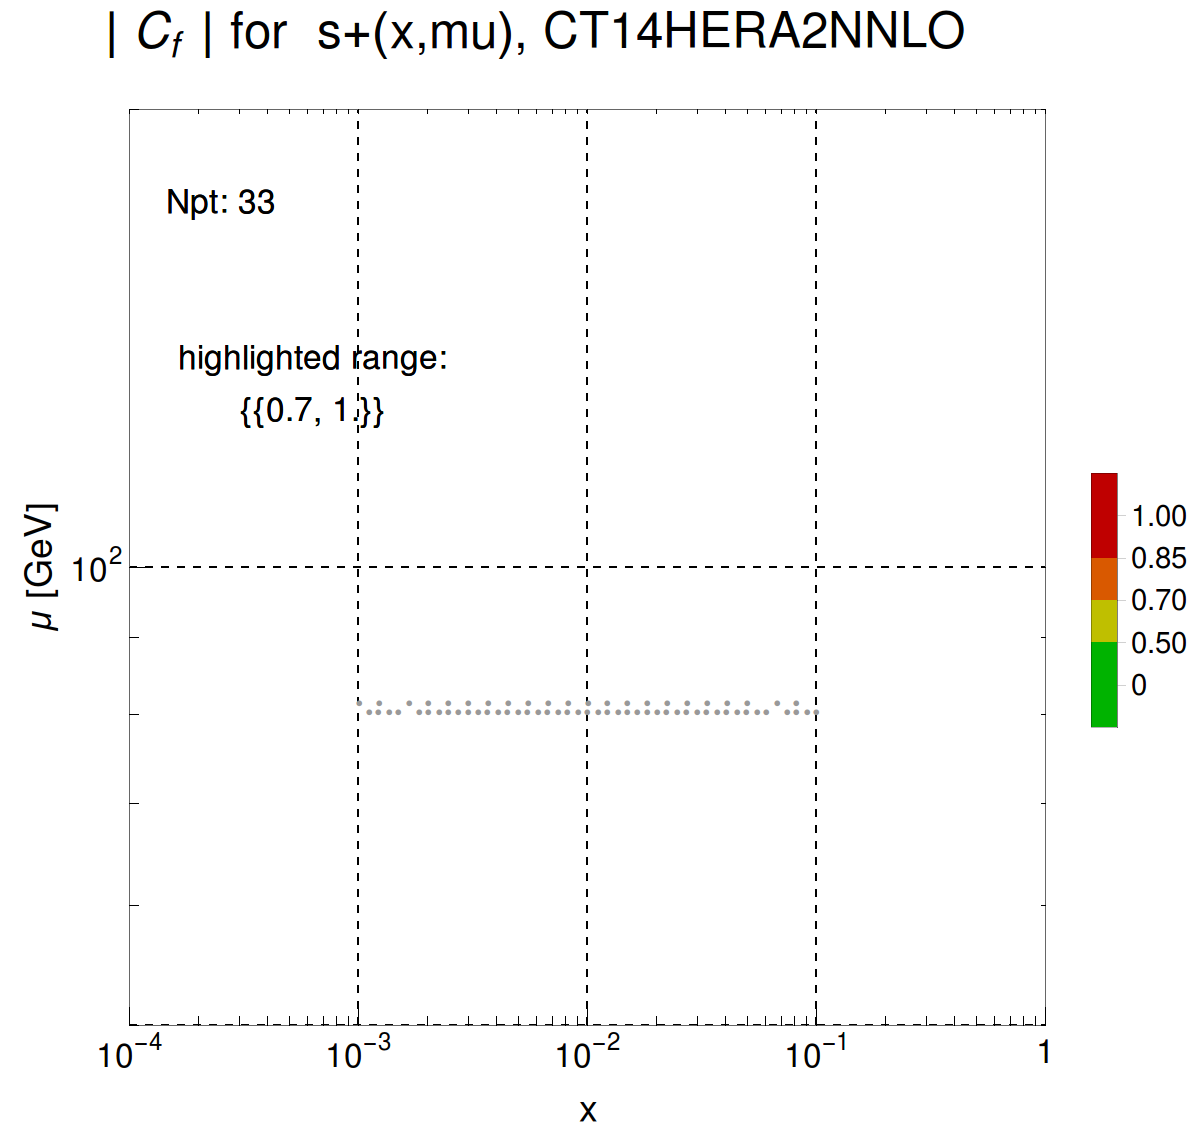
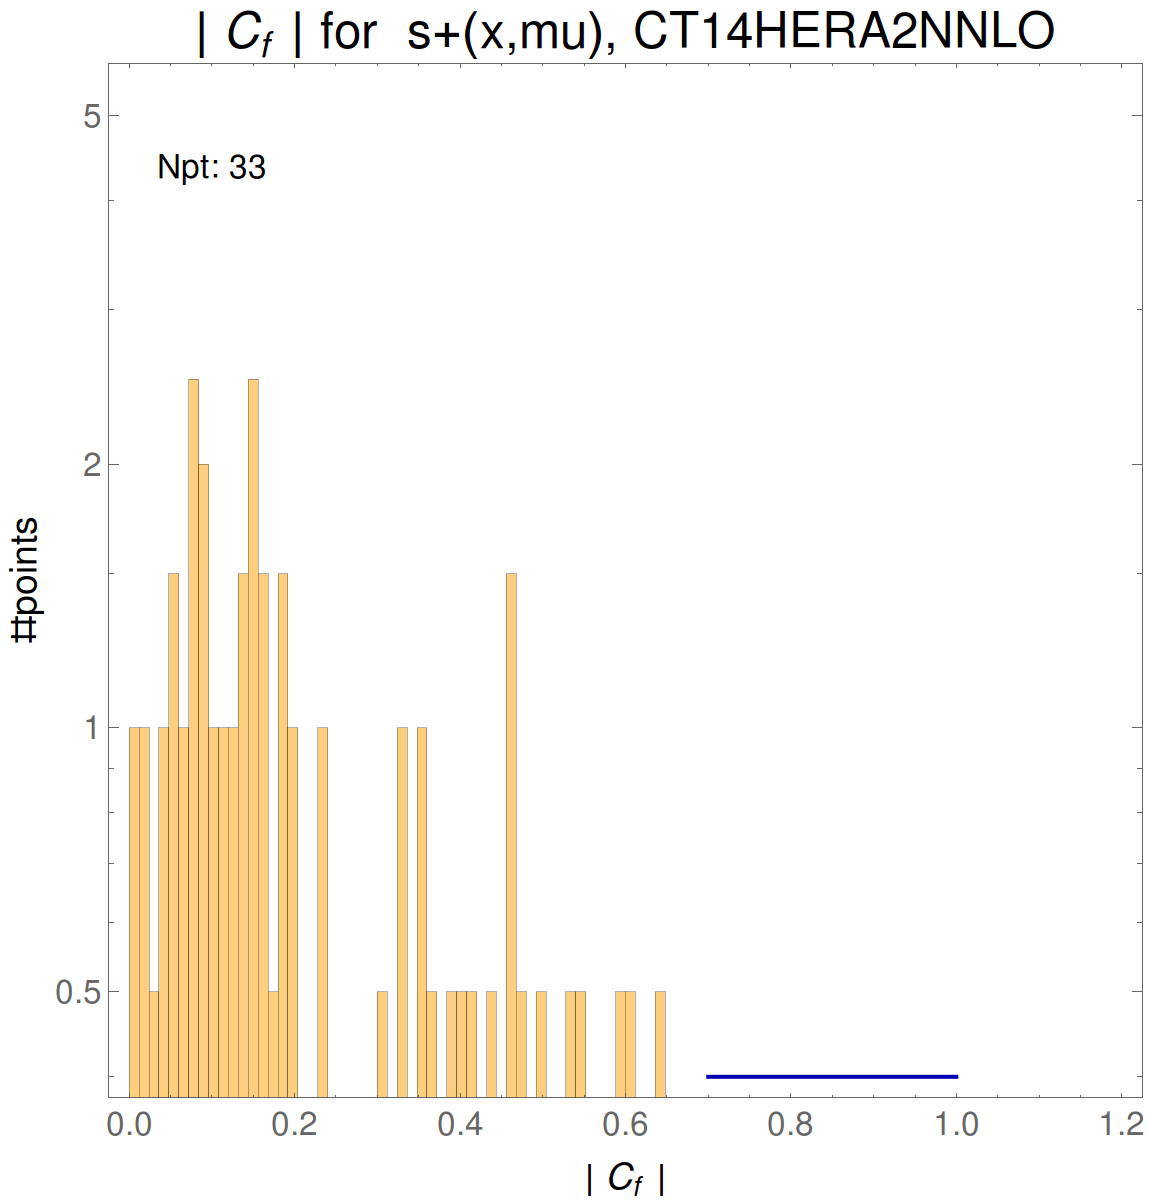
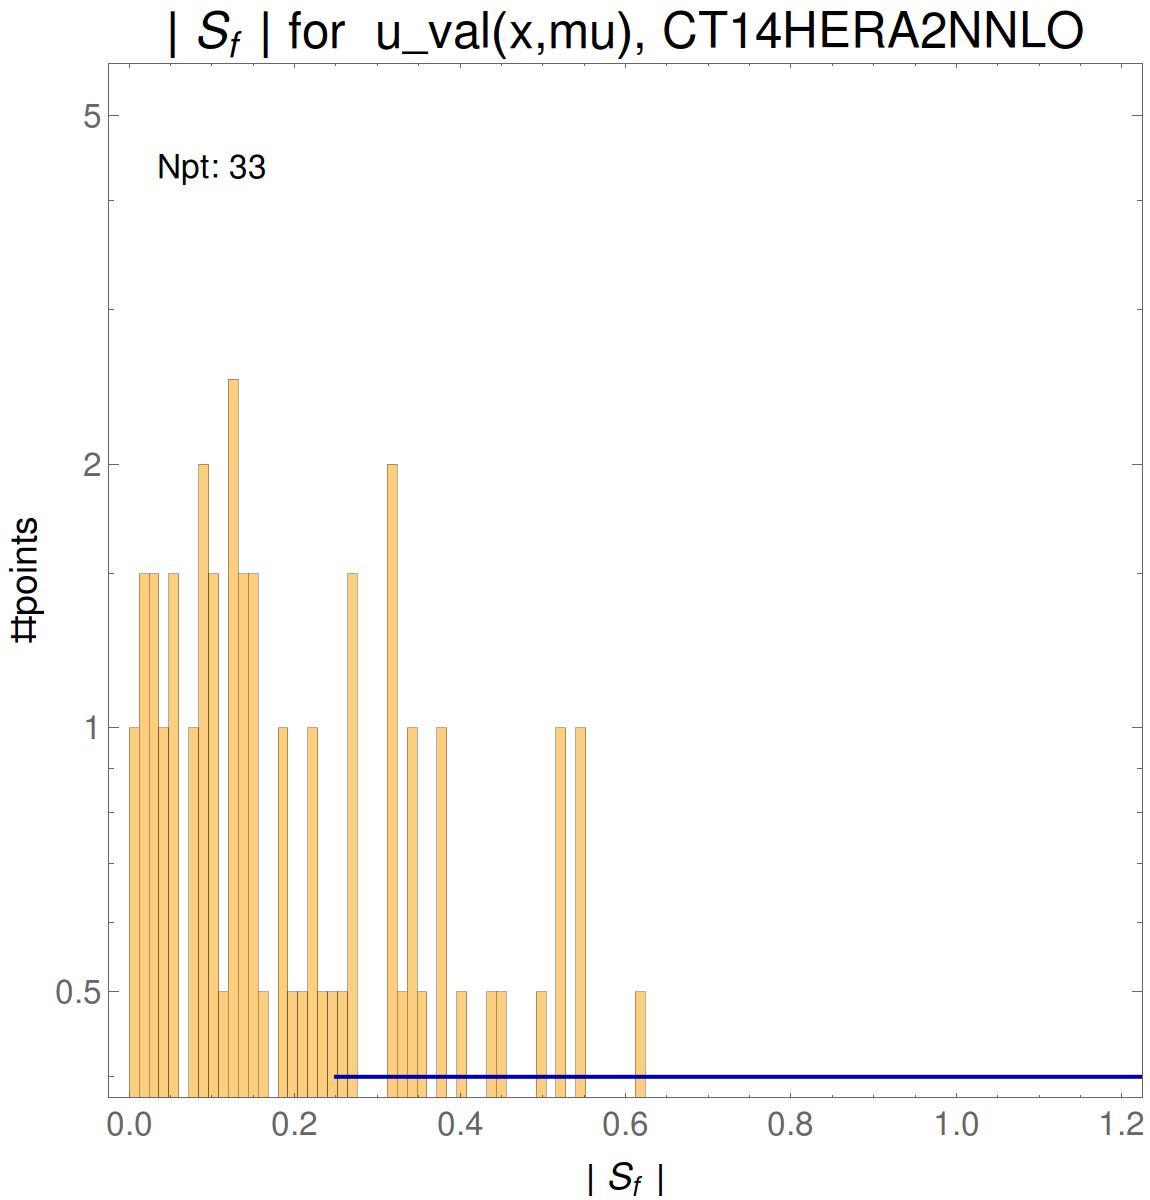
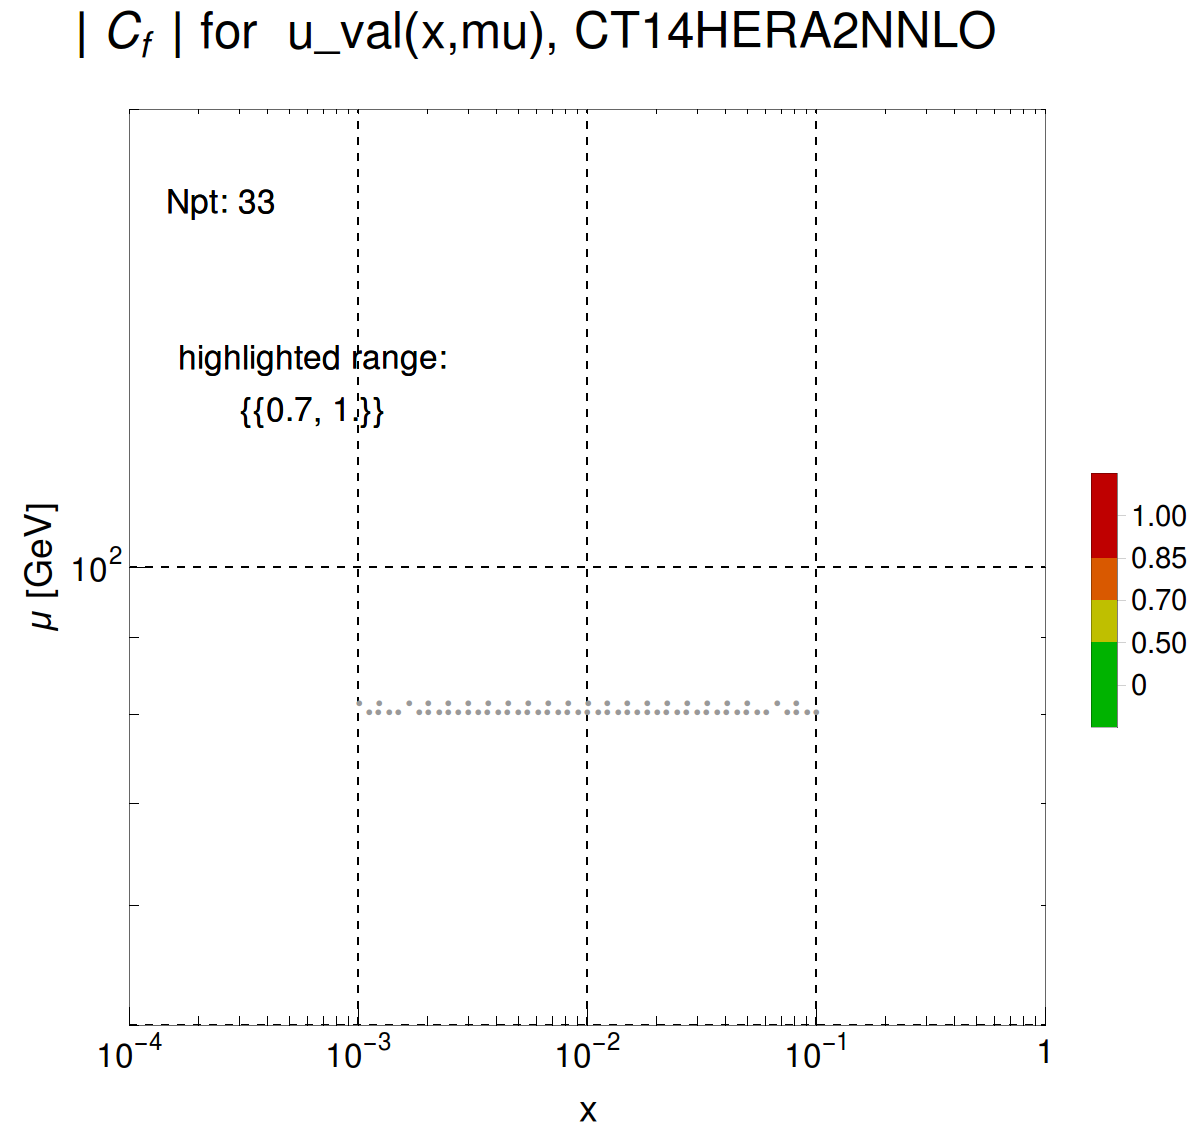
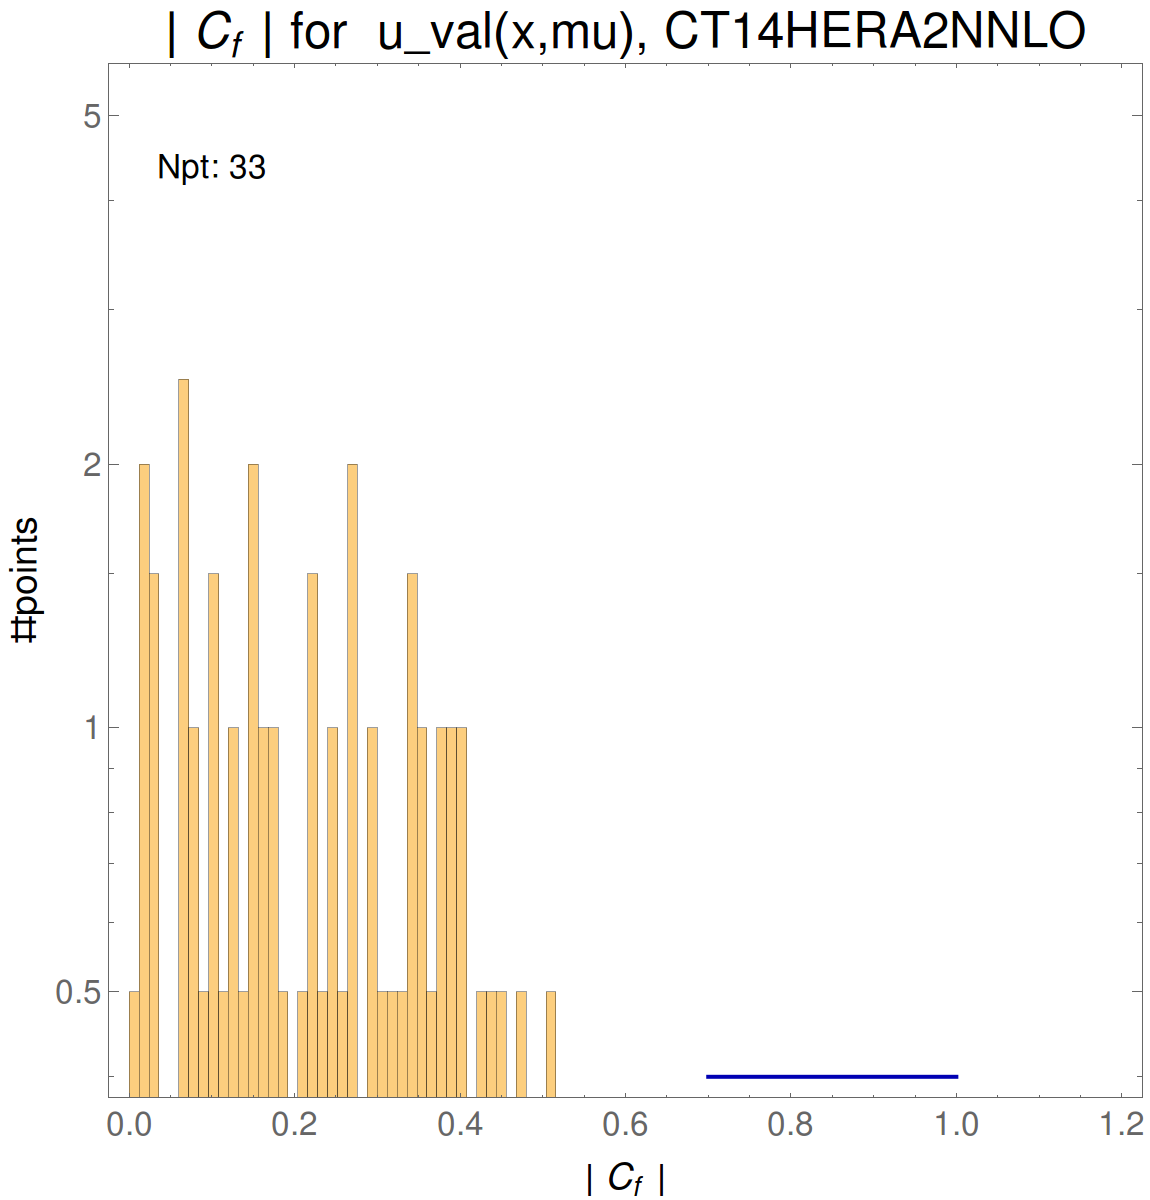
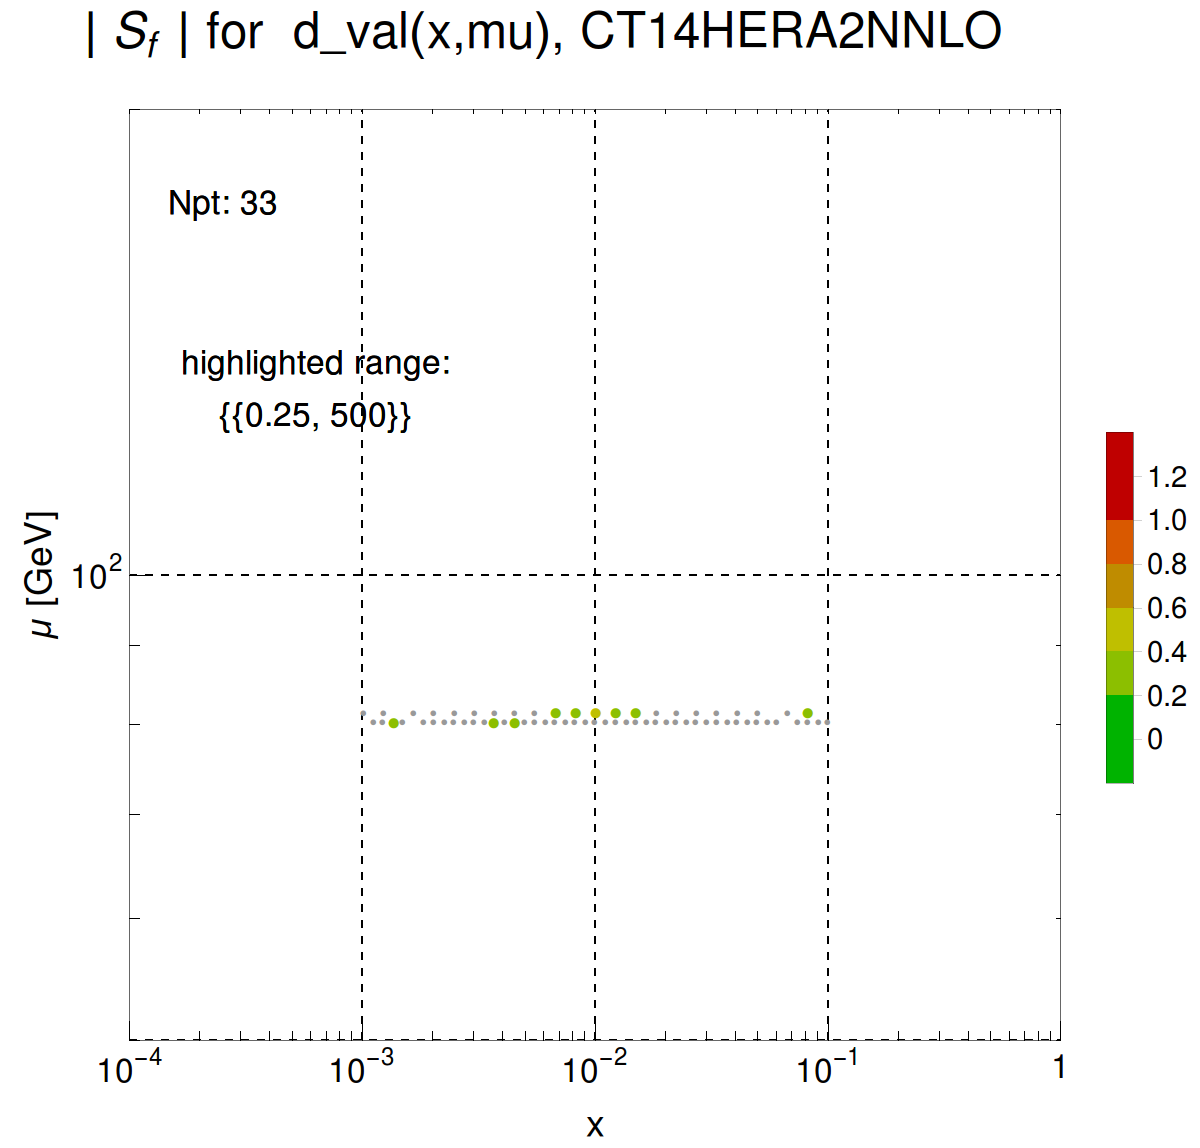
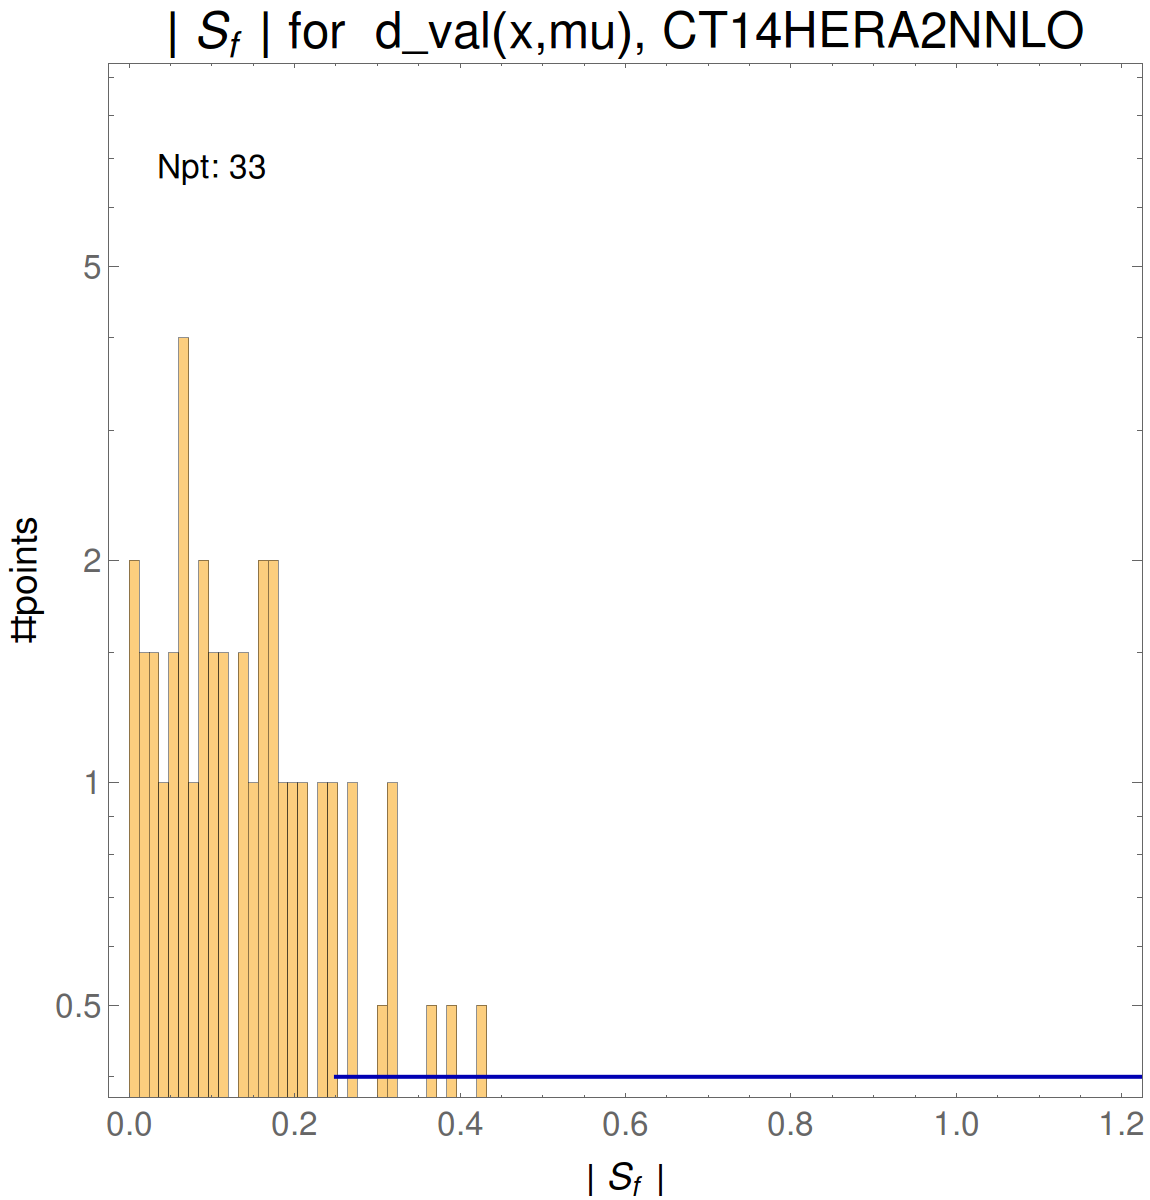
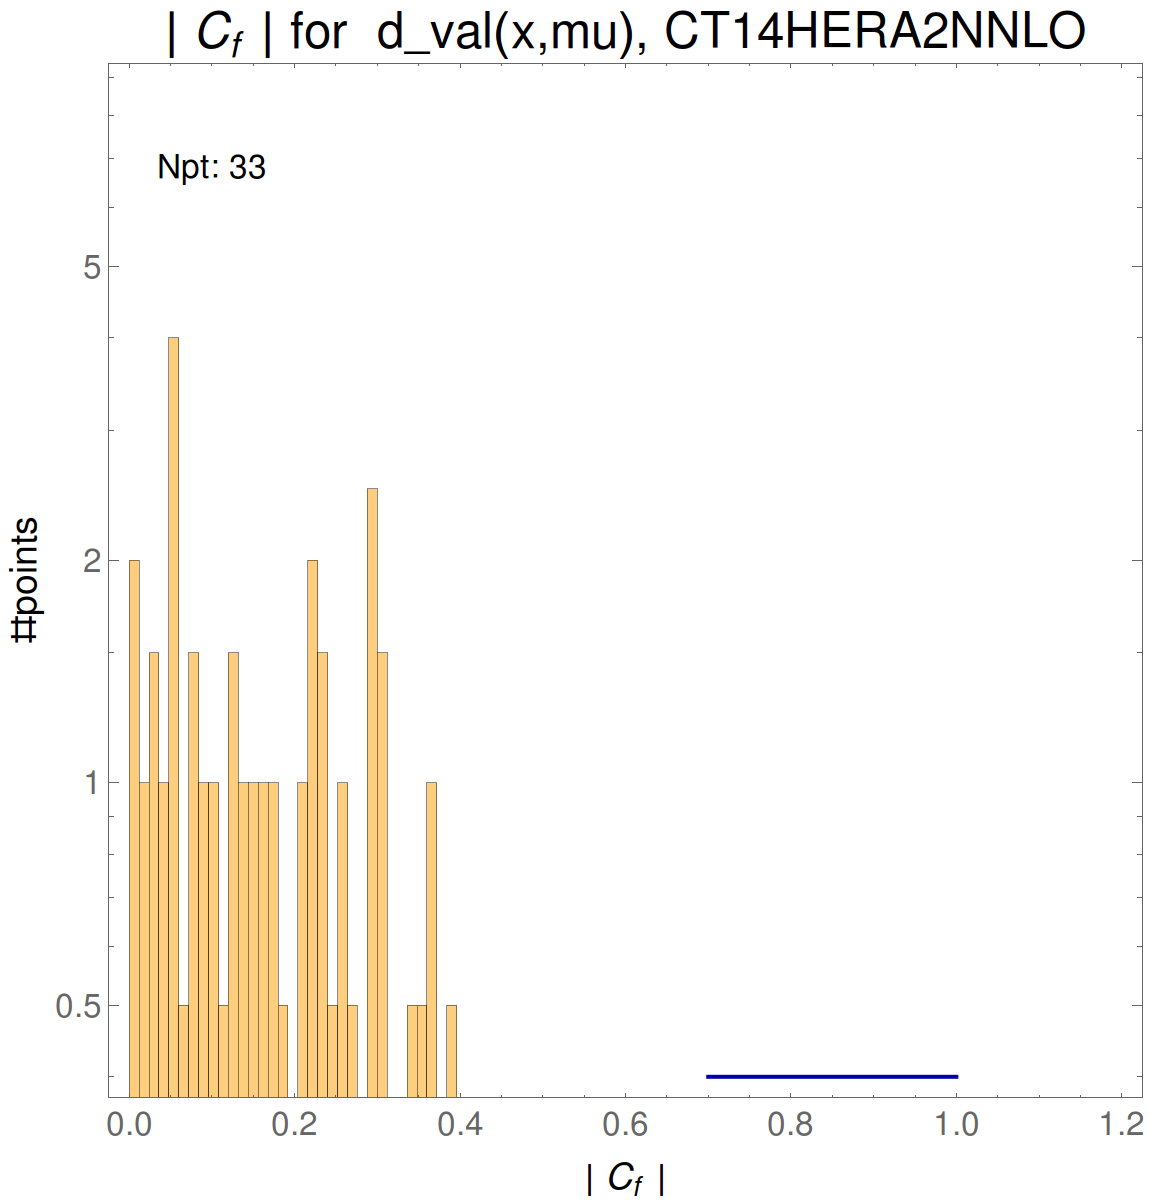
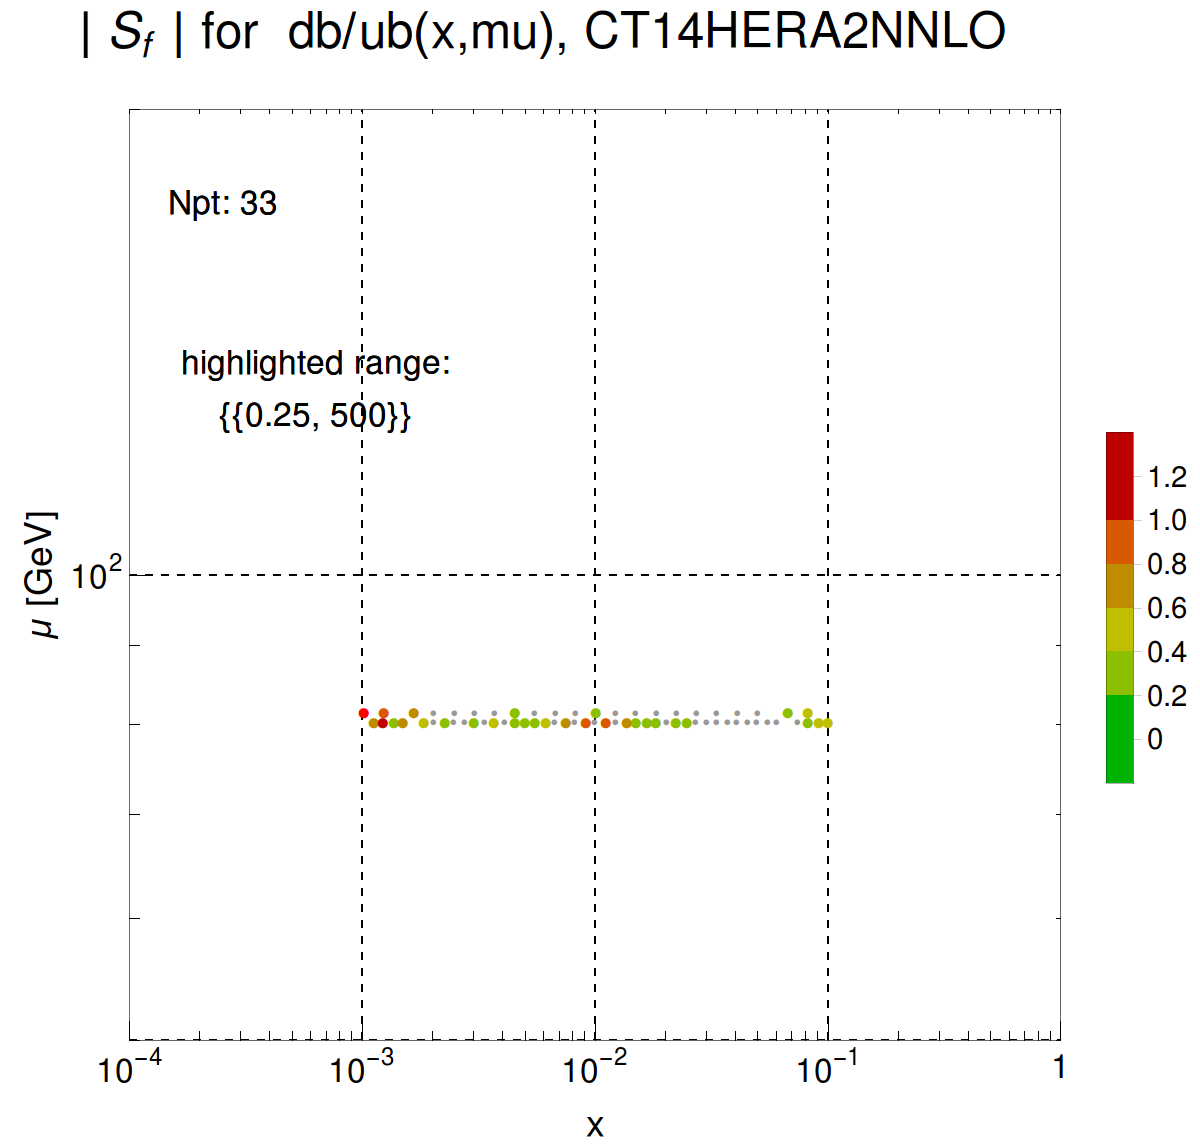
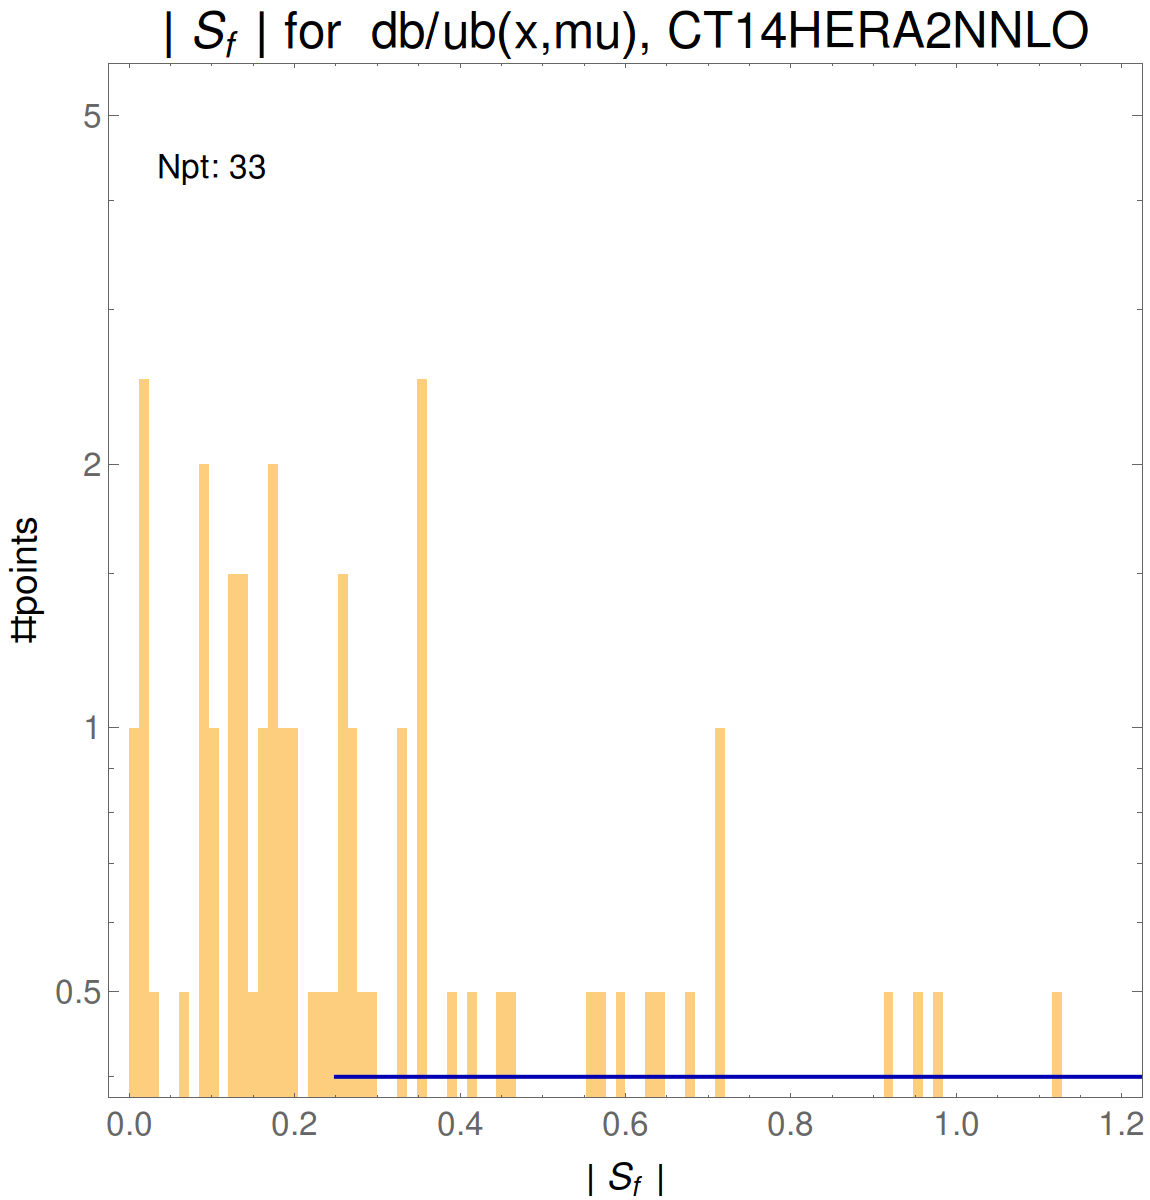
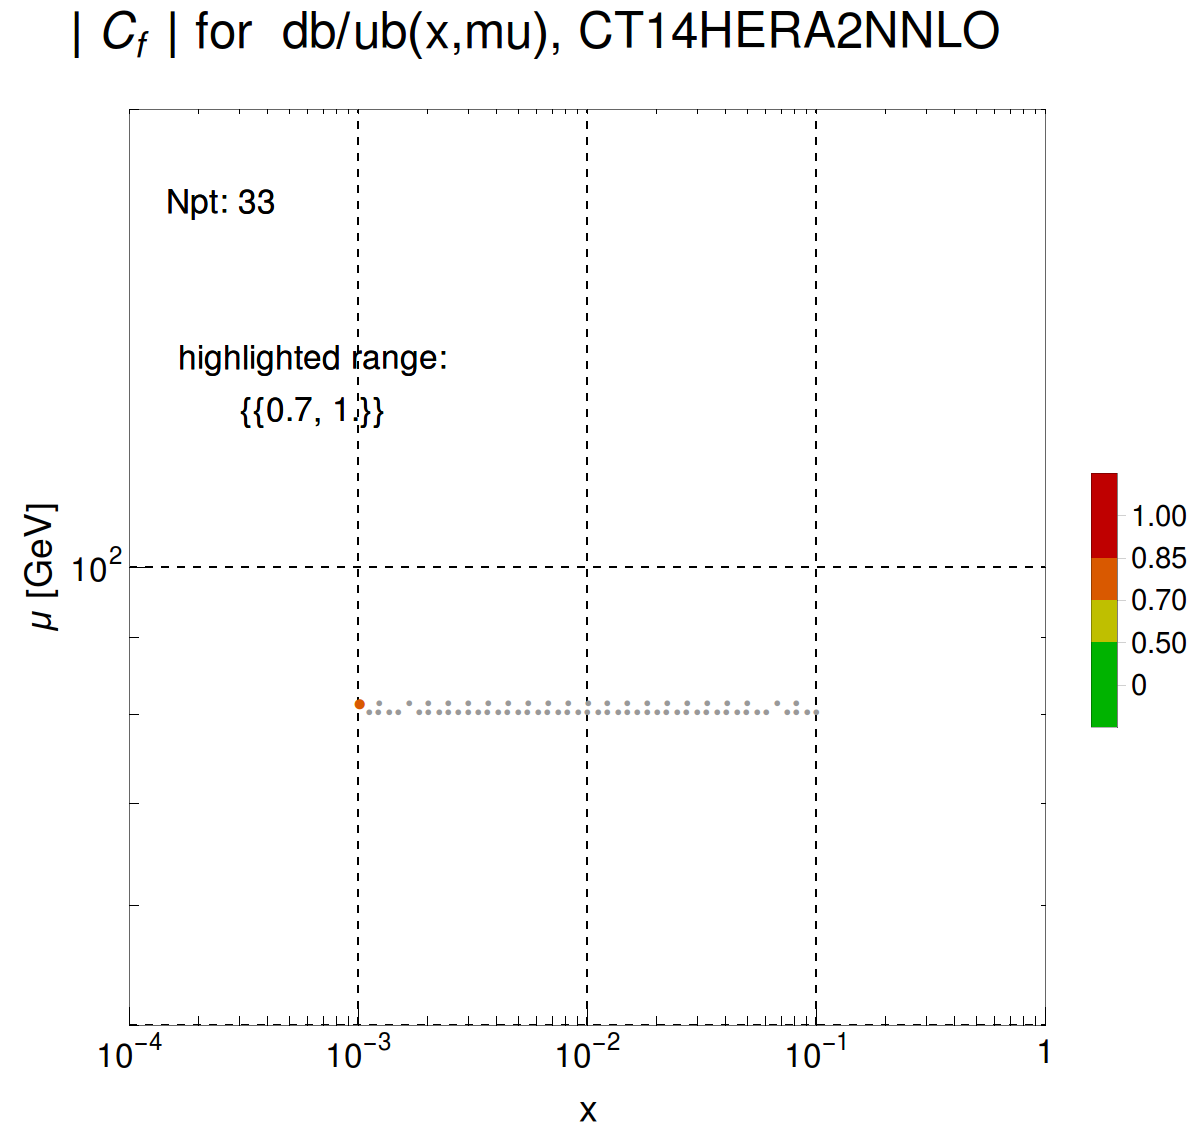
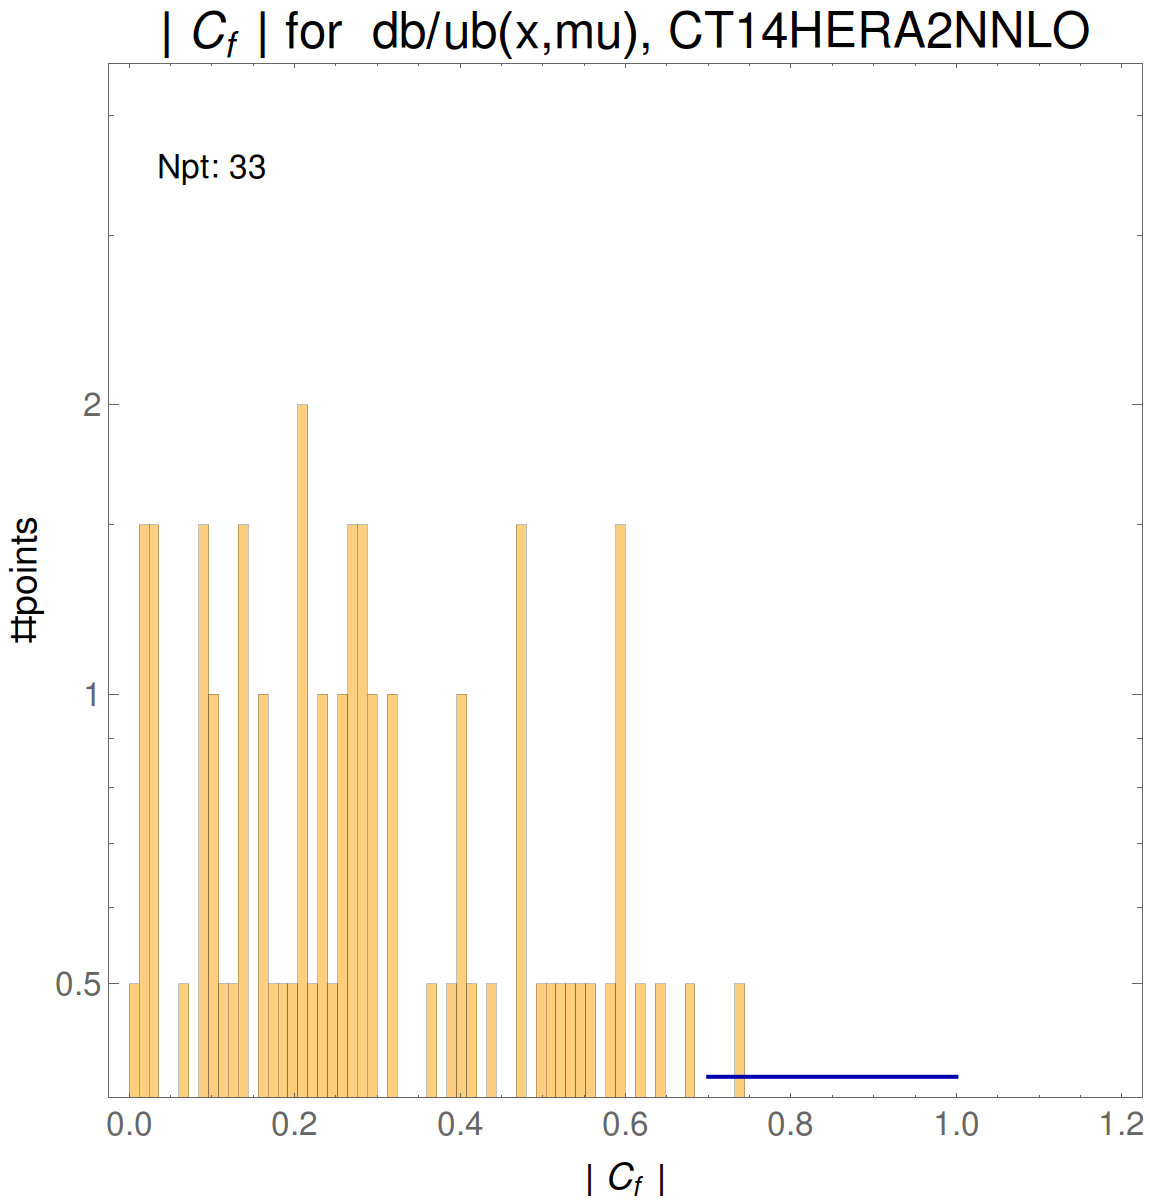
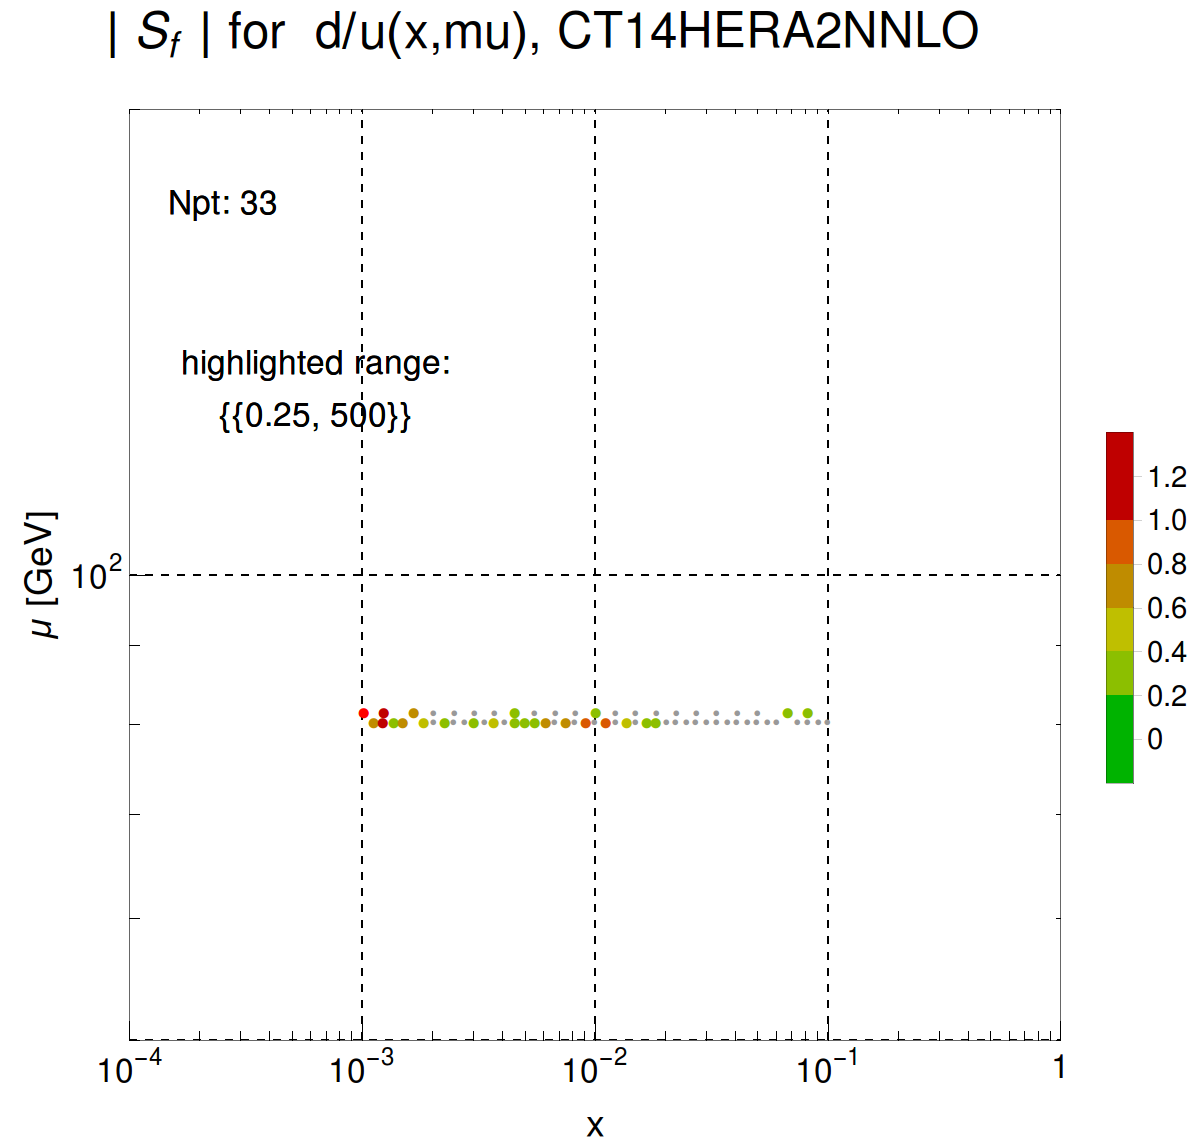
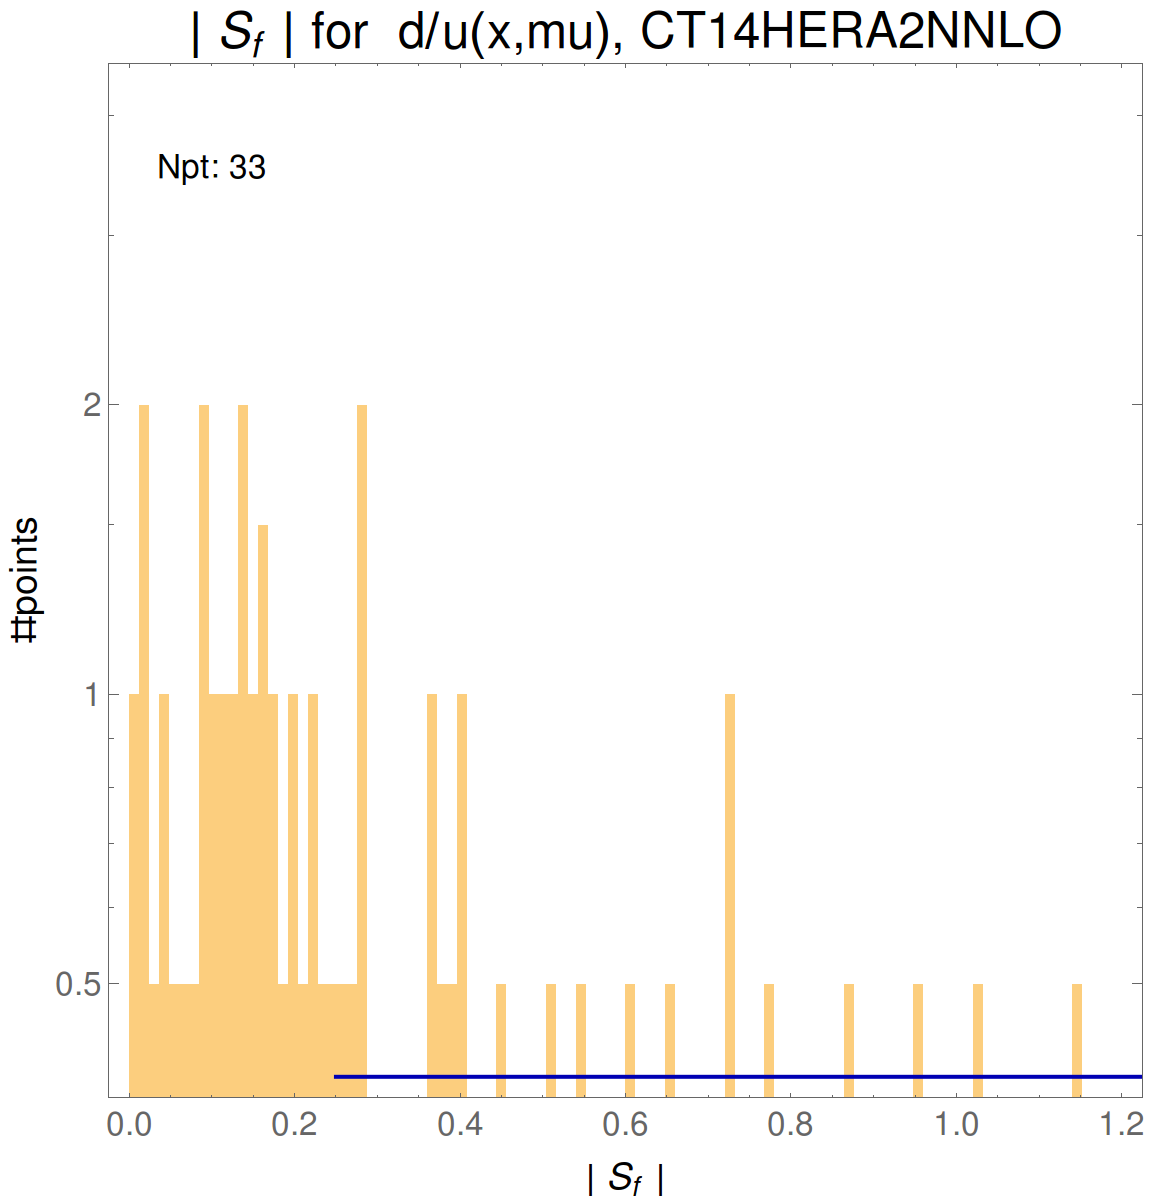
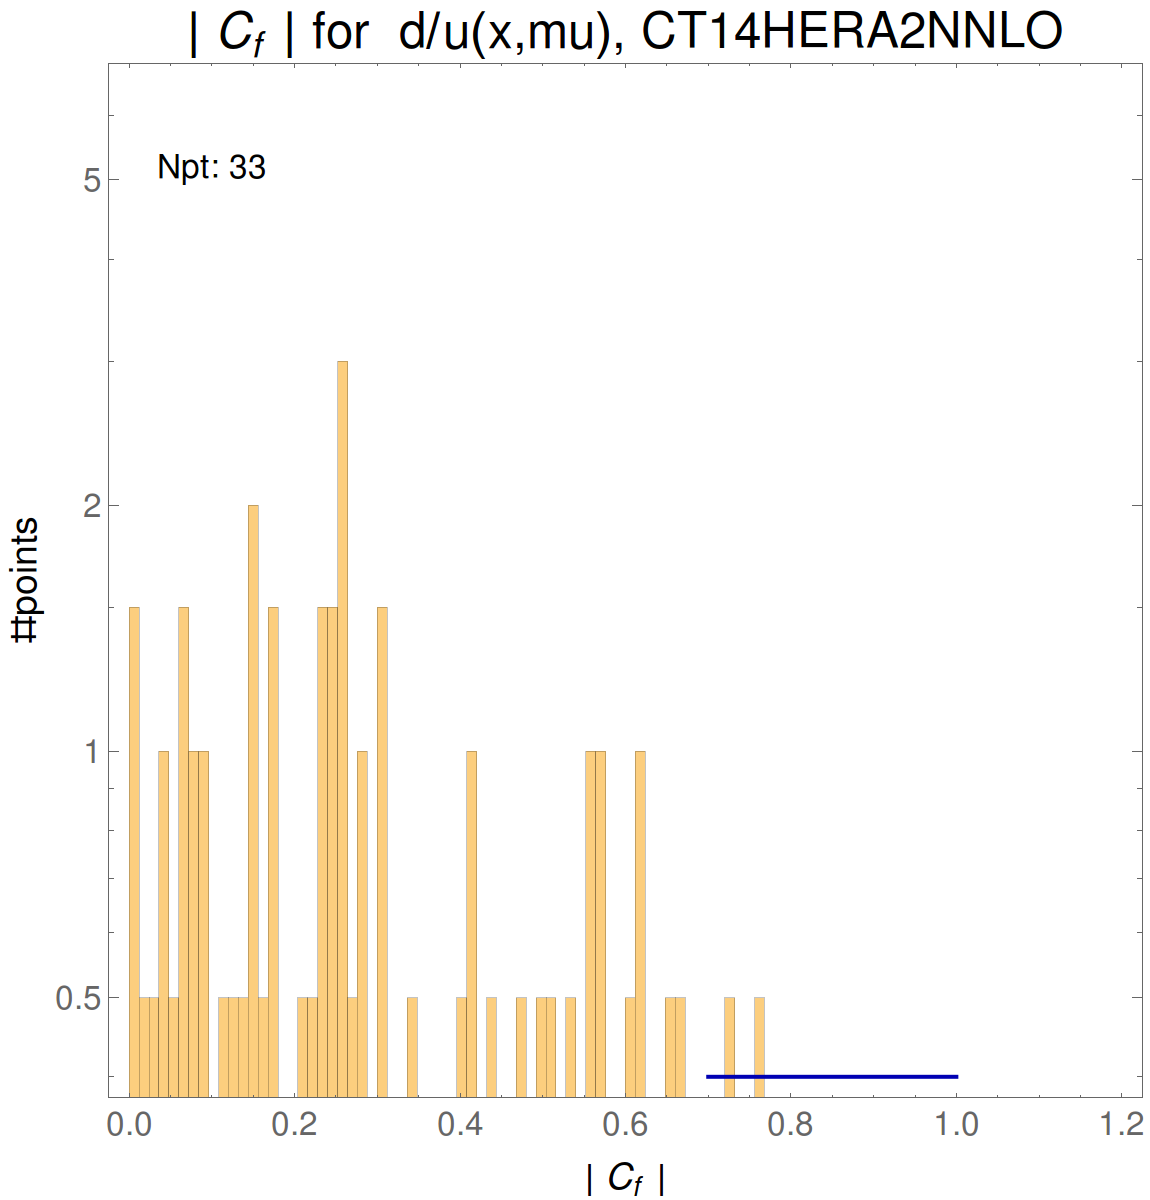
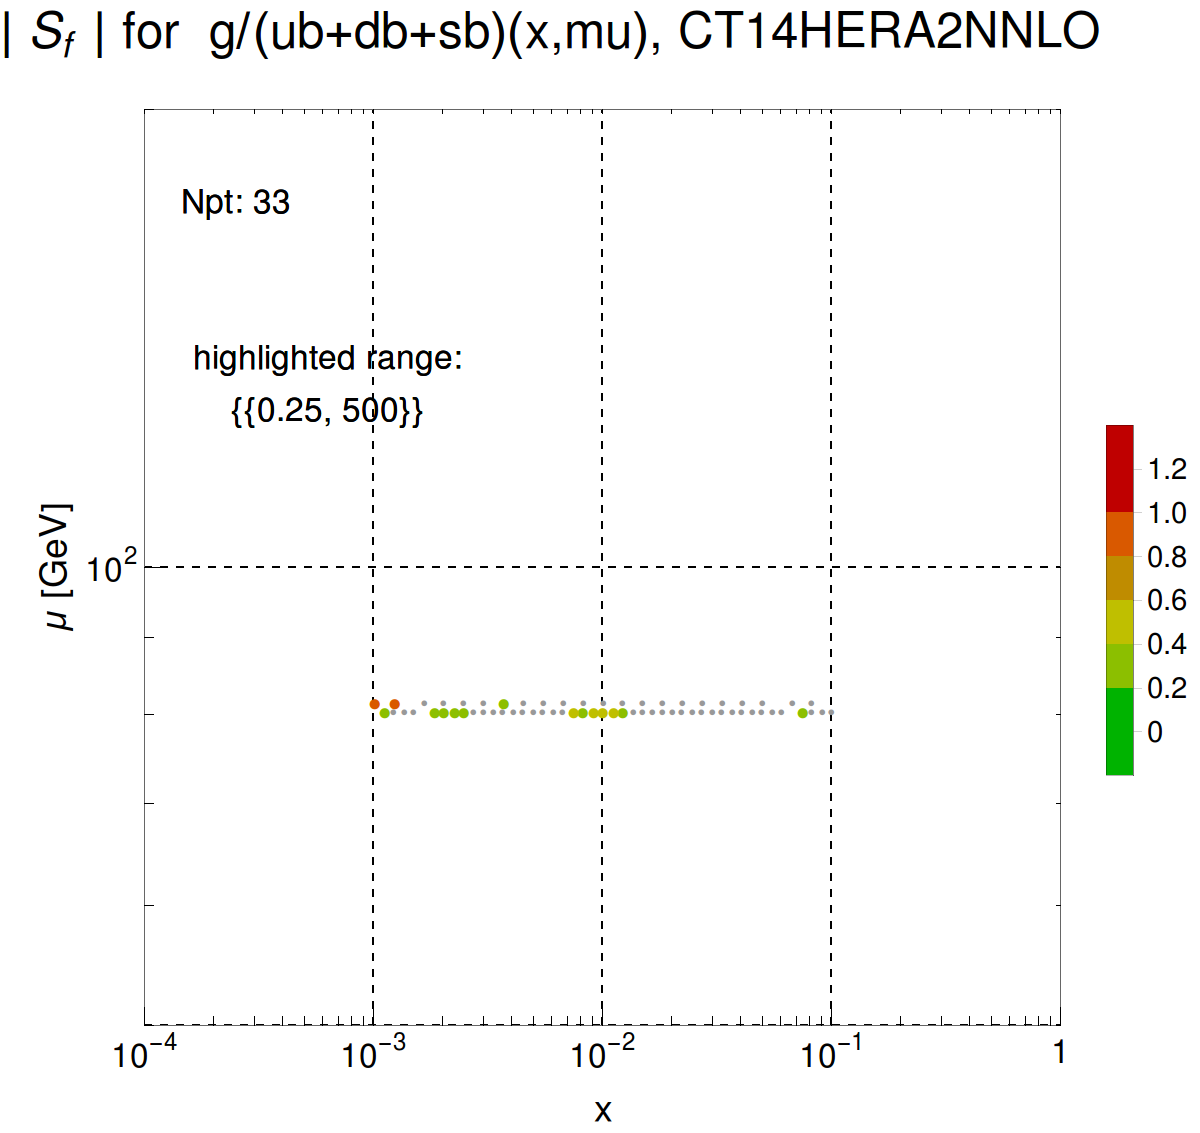
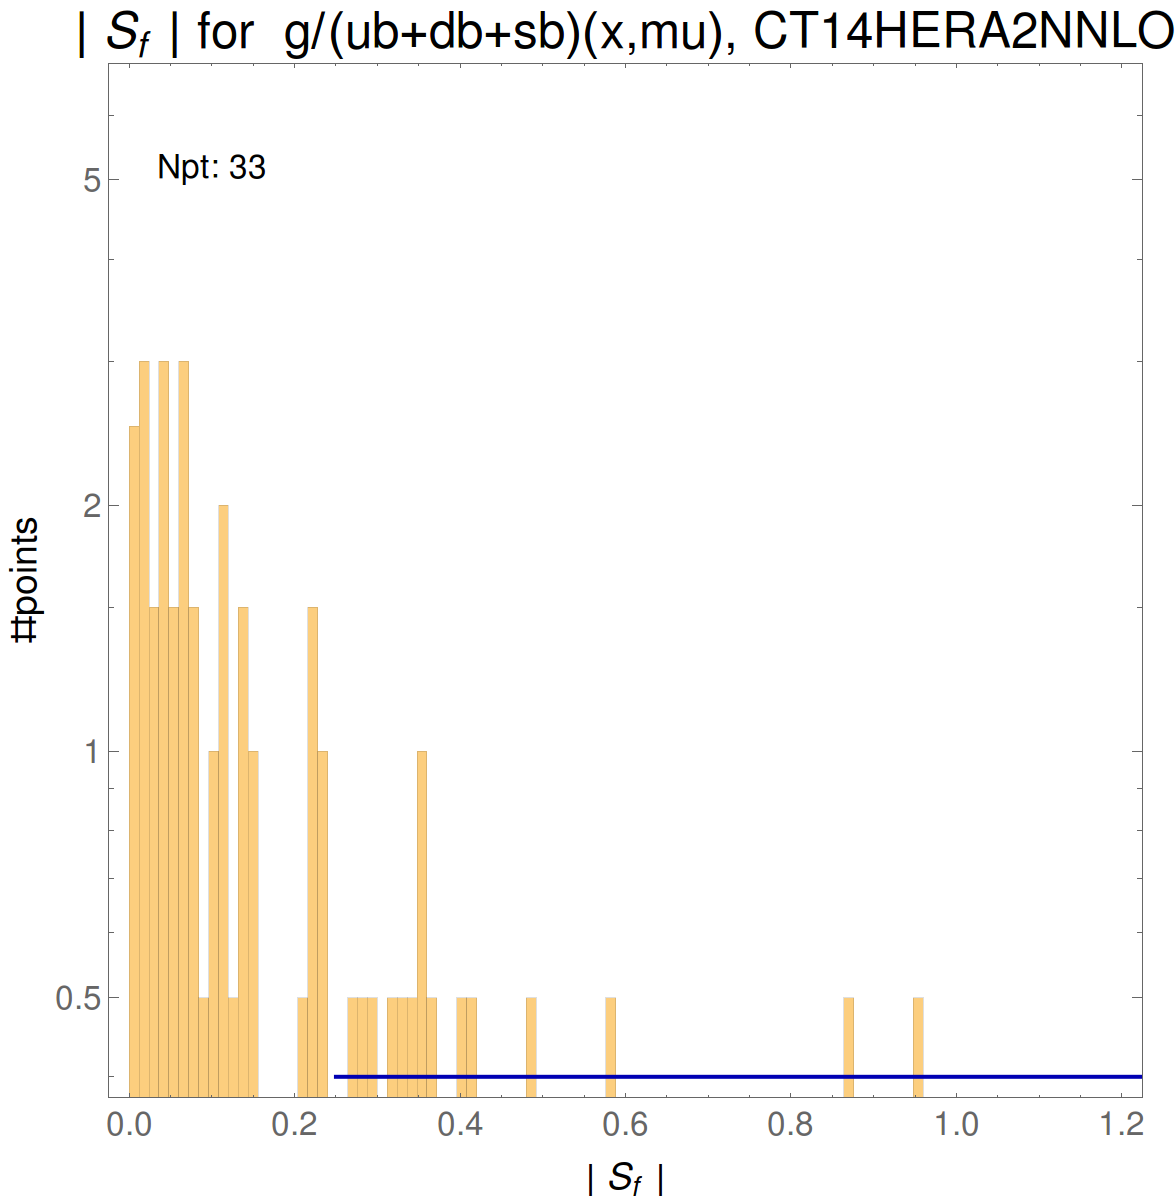
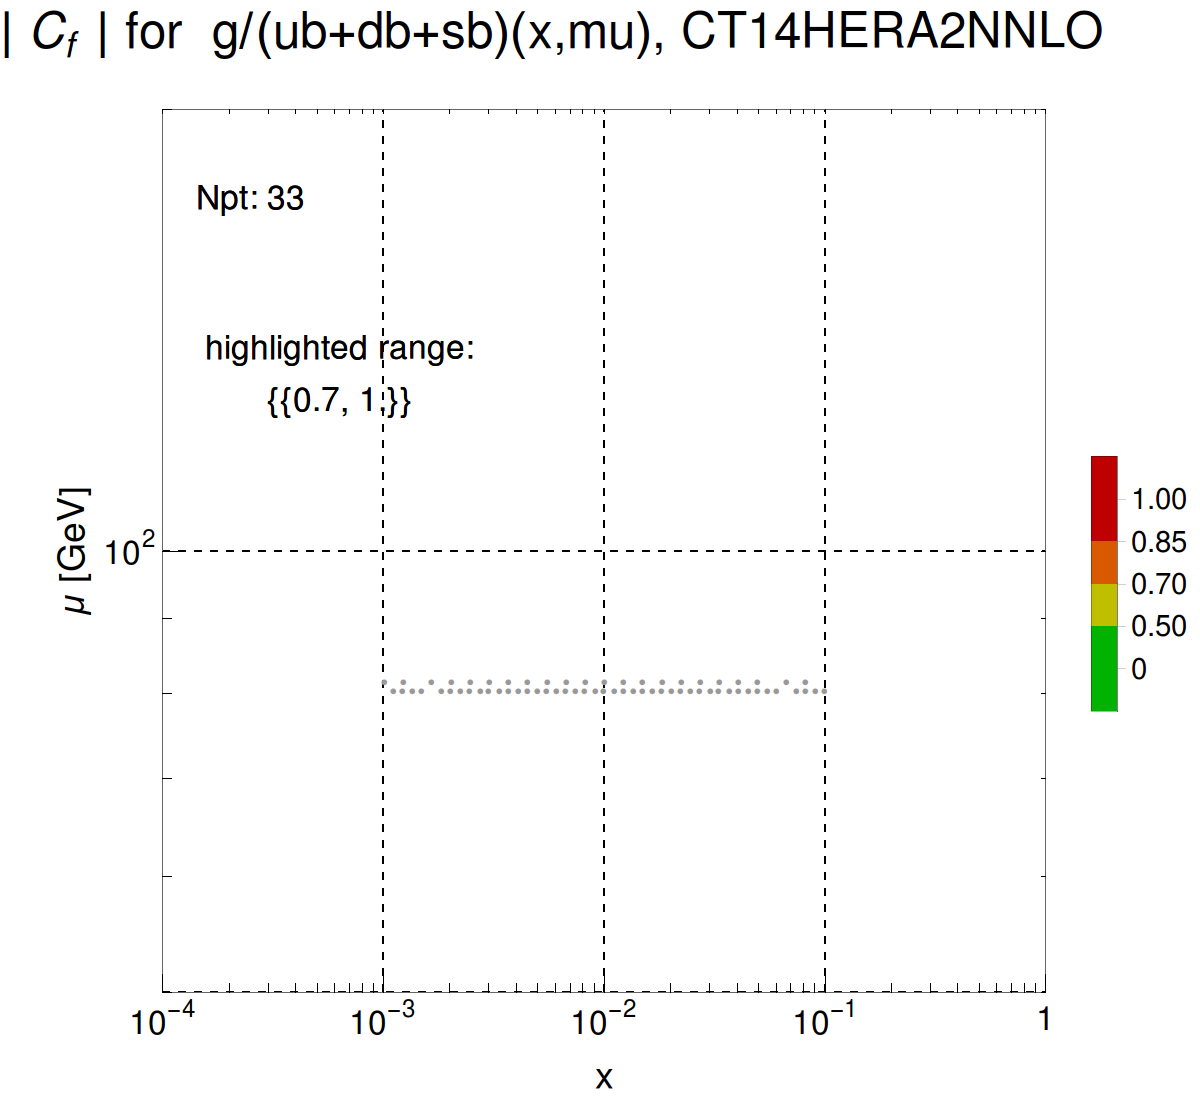
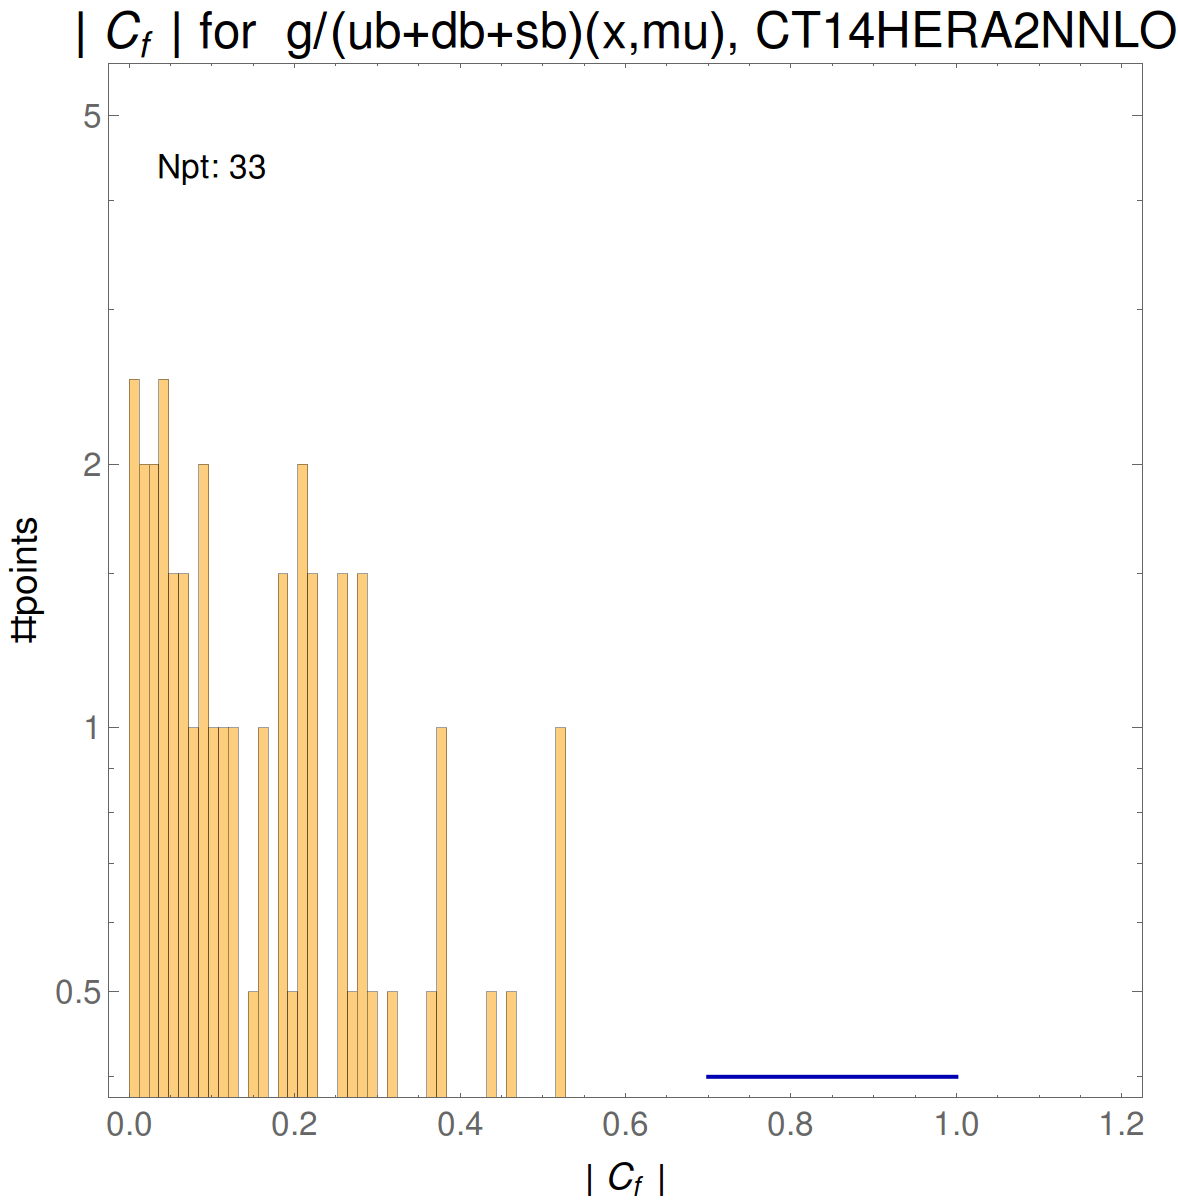
The figures show maps in (x, μ) space of absolute sensitivities |S_f| and absolute correlations |C_f| of experimental data points for the PDFs of the indicated flavors. The strength of |S_f| for a data point is indicated according the color legend on the right. We colorize only the points with |S_f| falling within the highlighted interval specified in the figure. The respective distributions of the correlations/sensitivities are also shown as histograms, with the blue lines on the x-axes indicating the highlighted ranges. The measurements taken by the experiments shown in our figures are distributed in a space of (x, μ) as shown below.
 [pdf]
[pdf]
|
all experiments
We only show the figures containing at least one data point with a high enough correlation (|Cf|>0.7) or sensitivity (|Sf|>0.25).The link1, link2 record the values of highlighted points and the statistical quantities (Npt, mean, total values, etc) of |Cf| and |Sf| in figures.
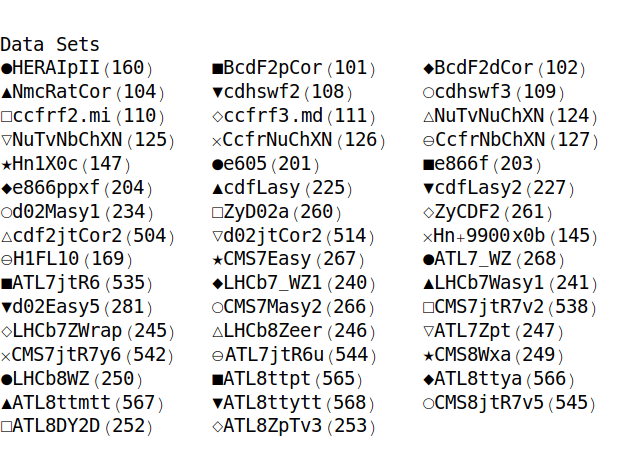
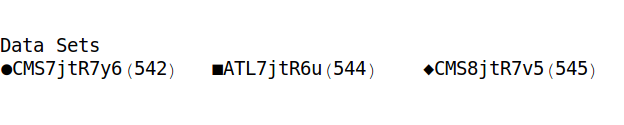
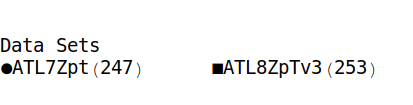
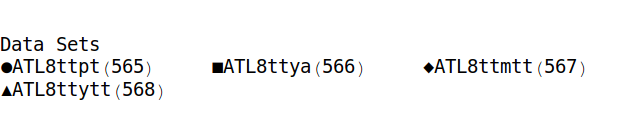
| The figures include the following experimental data sets: |
 [pdf]
[pdf]
|


Inclusive jet production at the LHC
We only show the figures containing at least one data point with a high enough correlation (|Cf|>0.7) or sensitivity (|Sf|>0.25).The link1, link2 record the values of highlighted points and the statistical quantities (Npt, mean, total values, etc) of |Cf| and |Sf| in figures.
| The figures include the following experimental data sets: |
 [pdf]
[pdf]
|


high-pT Z production at the LHC
We only show the figures containing at least one data point with a high enough correlation (|Cf|>0.7) or sensitivity (|Sf|>0.25).The link1, link2 record the values of highlighted points and the statistical quantities (Npt, mean, total values, etc) of |Cf| and |Sf| in figures.
| The figures include the following experimental data sets: |
 [pdf]
[pdf]
|


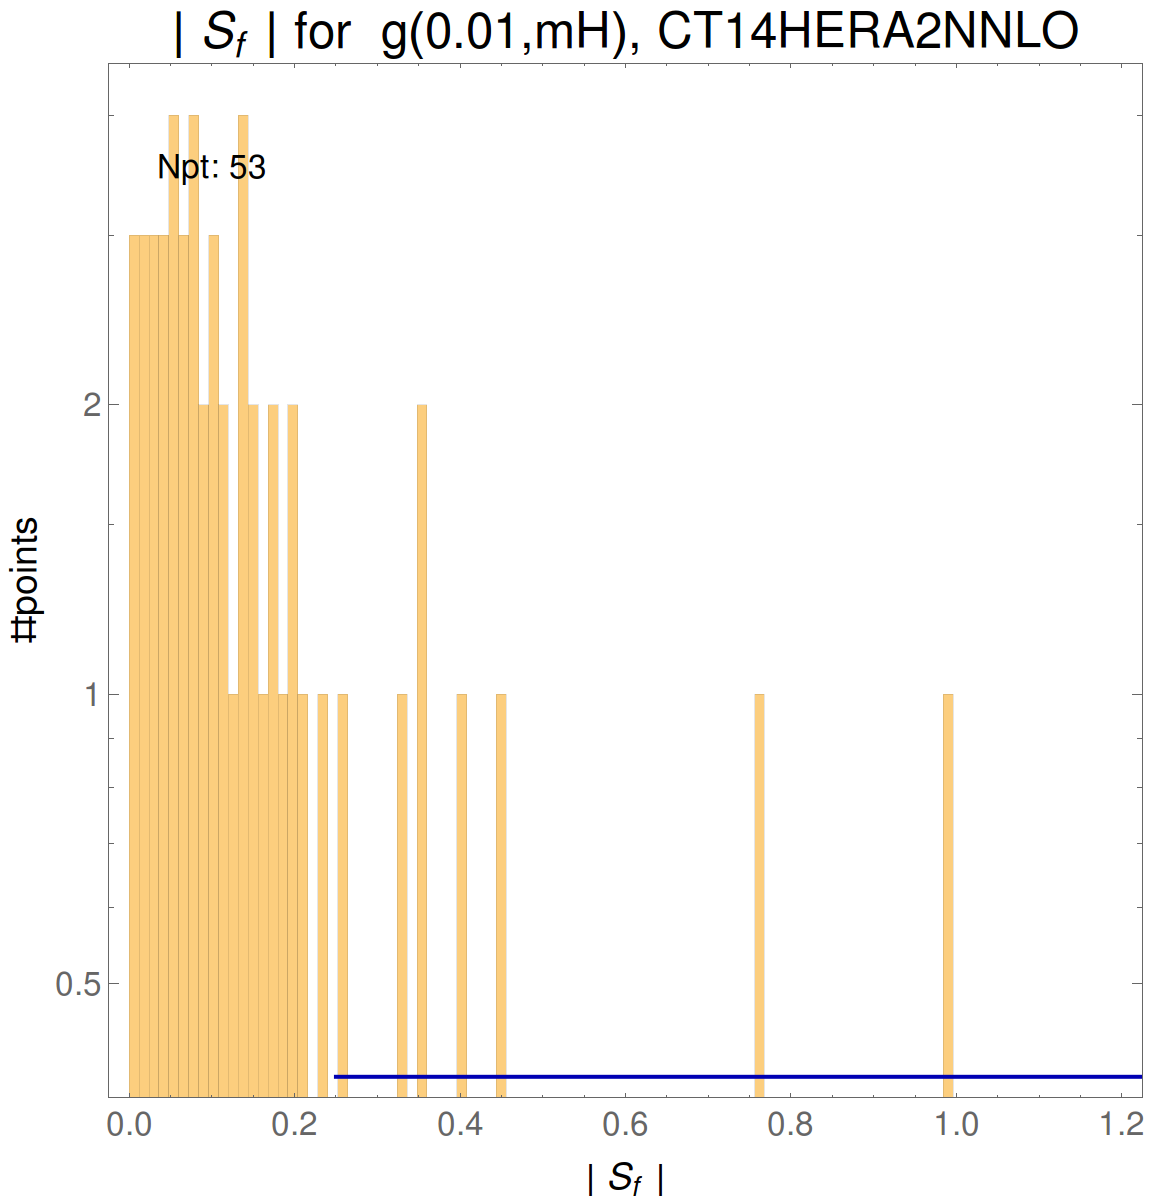
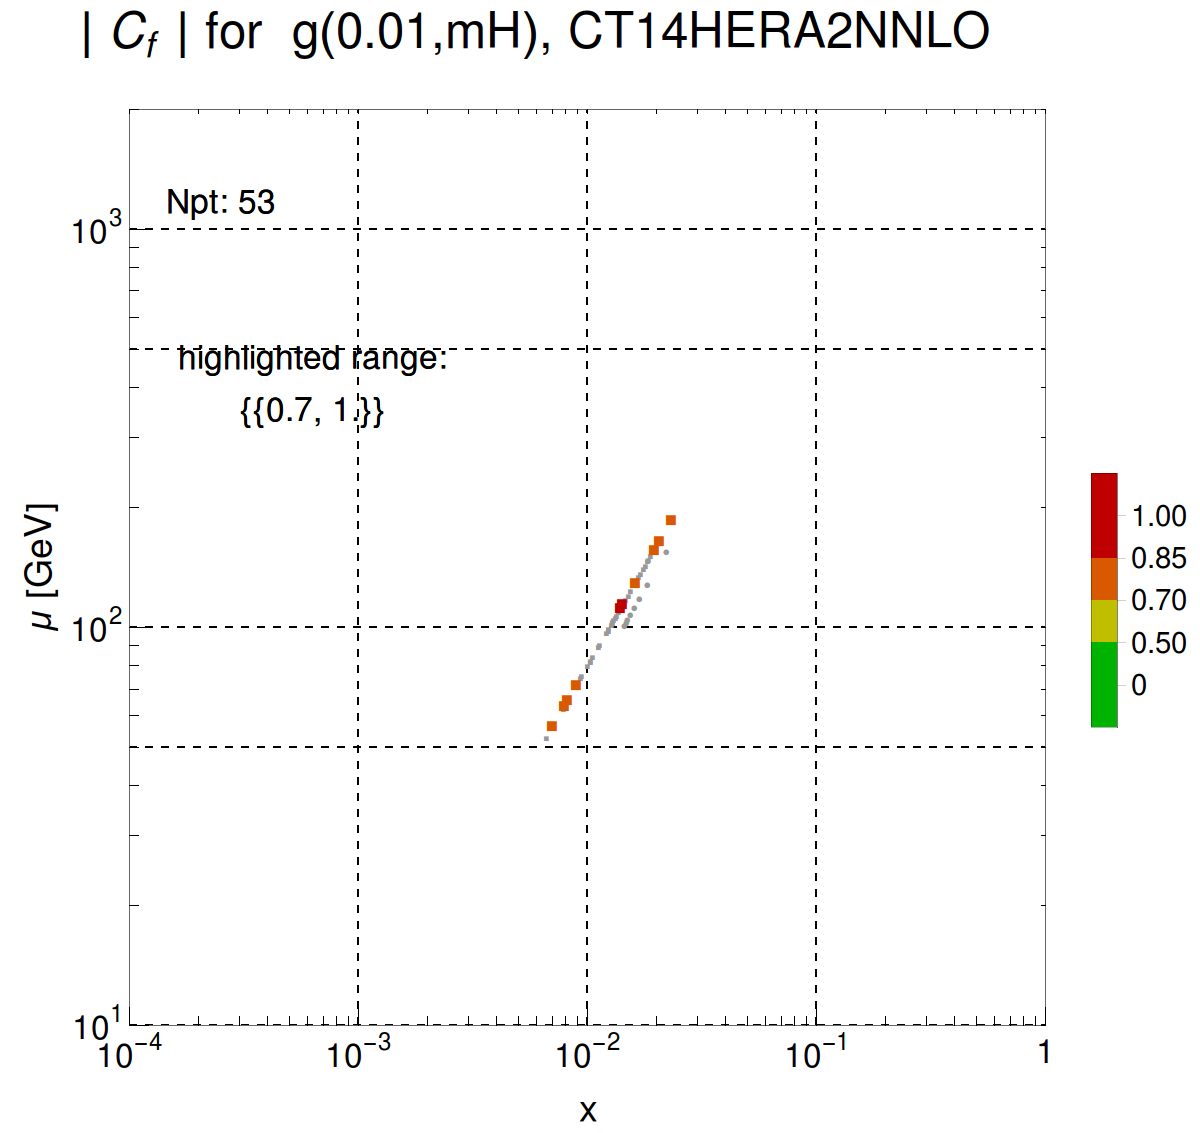
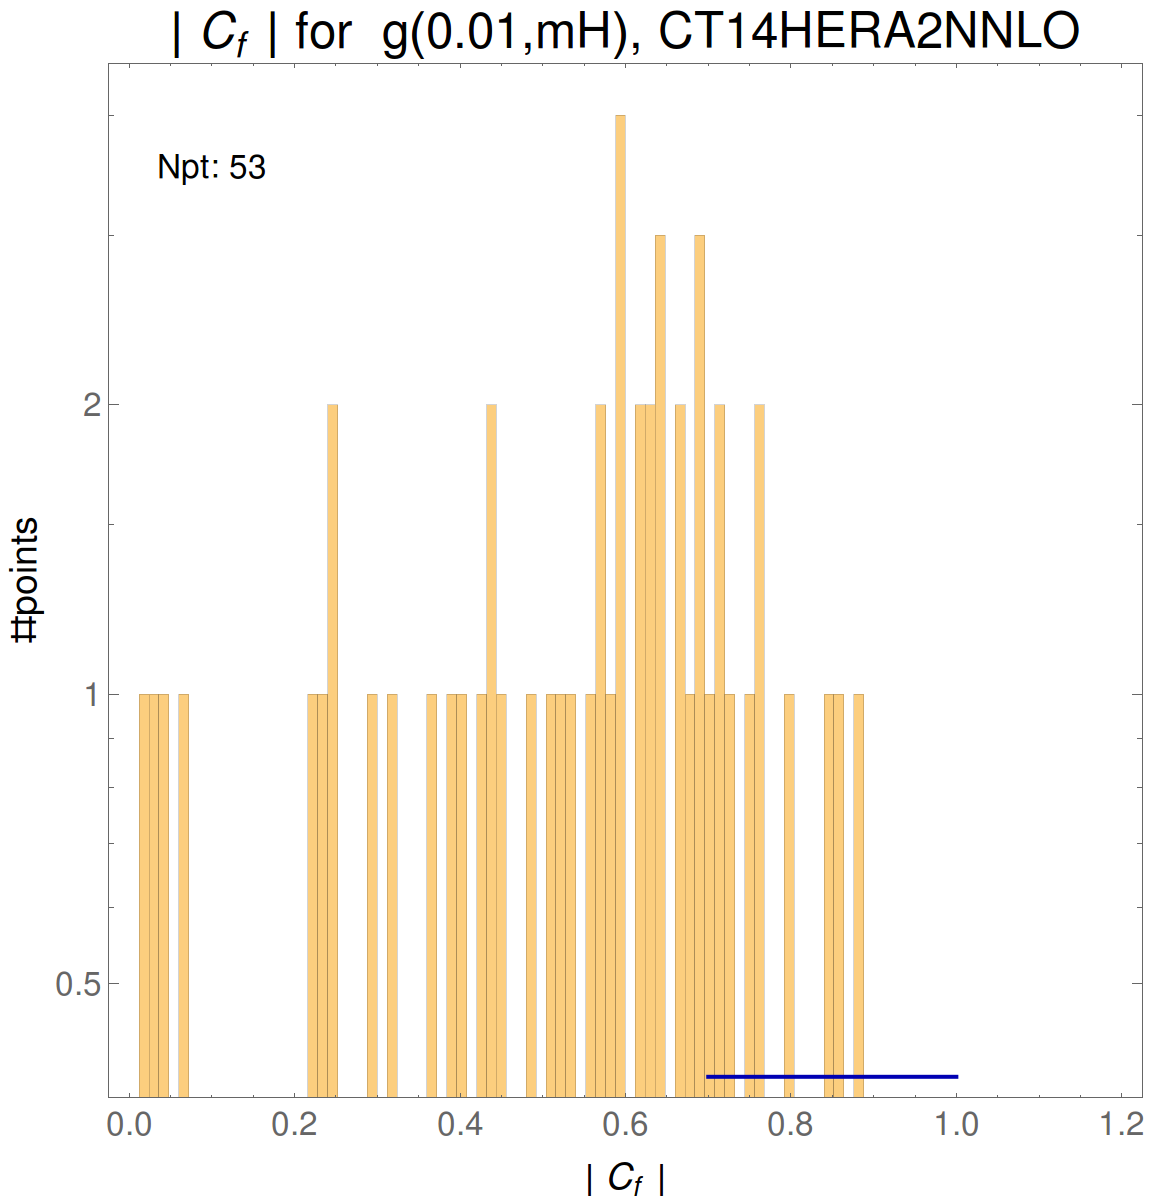
ttbar production at the LHC
We only show the figures containing at least one data point with a high enough correlation (|Cf|>0.7) or sensitivity (|Sf|>0.25).The link1, link2 record the values of highlighted points and the statistical quantities (Npt, mean, total values, etc) of |Cf| and |Sf| in figures.
| The figures include the following experimental data sets: |
 [pdf]
[pdf]
|
 [pdf]
[pdf]
|
 [pdf]
[pdf]
|
 [pdf]
[pdf]
|
 [pdf]
[pdf]
|
 [pdf]
[pdf]
|
 [pdf]
[pdf]
|
 [pdf]
[pdf]
|
 [pdf]
[pdf]
|
 [pdf]
[pdf]
|
 [pdf]
[pdf]
|
 [pdf]
[pdf]
|
 [pdf]
[pdf]
|
 [pdf]
[pdf]
|
 [pdf]
[pdf]
|
 [pdf]
[pdf]
|
 [pdf]
[pdf]
|
 [pdf]
[pdf]
|
 [pdf]
[pdf]
|
 [pdf]
[pdf]
|
 [pdf]
[pdf]
|
 [pdf]
[pdf]
|
 [pdf]
[pdf]
|
 [pdf]
[pdf]
|
 [pdf]
[pdf]
|
 [pdf]
[pdf]
|
 [pdf]
[pdf]
|
 [pdf]
[pdf]
|
 [pdf]
[pdf]
|
 [pdf]
[pdf]
|
 [pdf]
[pdf]
|
 [pdf]
[pdf]
|
 [pdf]
[pdf]
|
Charge lepton asymmetry in W boson production at the LHC
We only show the figures containing at least one data point with a high enough correlation (|Cf|>0.7) or sensitivity (|Sf|>0.25).The link1, link2 record the values of highlighted points and the statistical quantities (Npt, mean, total values, etc) of |Cf| and |Sf| in figures.
| The figures include the following experimental data sets: |
 [pdf]
[pdf]
|


LHeC DIS pseudo-data
We only show the figures containing at least one data point with a high enough correlation (|Cf|>0.7) or sensitivity (|Sf|>0.25).The link1, link2 record the values of highlighted points and the statistical quantities (Npt, mean, total values, etc) of |Cf| and |Sf| in figures.
| The figures include the following experimental data sets: |
 [pdf]
[pdf]
|