Lab 9 - The HR Diagram
The instructions for plotting the data are clear. We should circulate and check to be sure they are
actually following the instructions. For assessing the plots, I have transparencies (prepared by
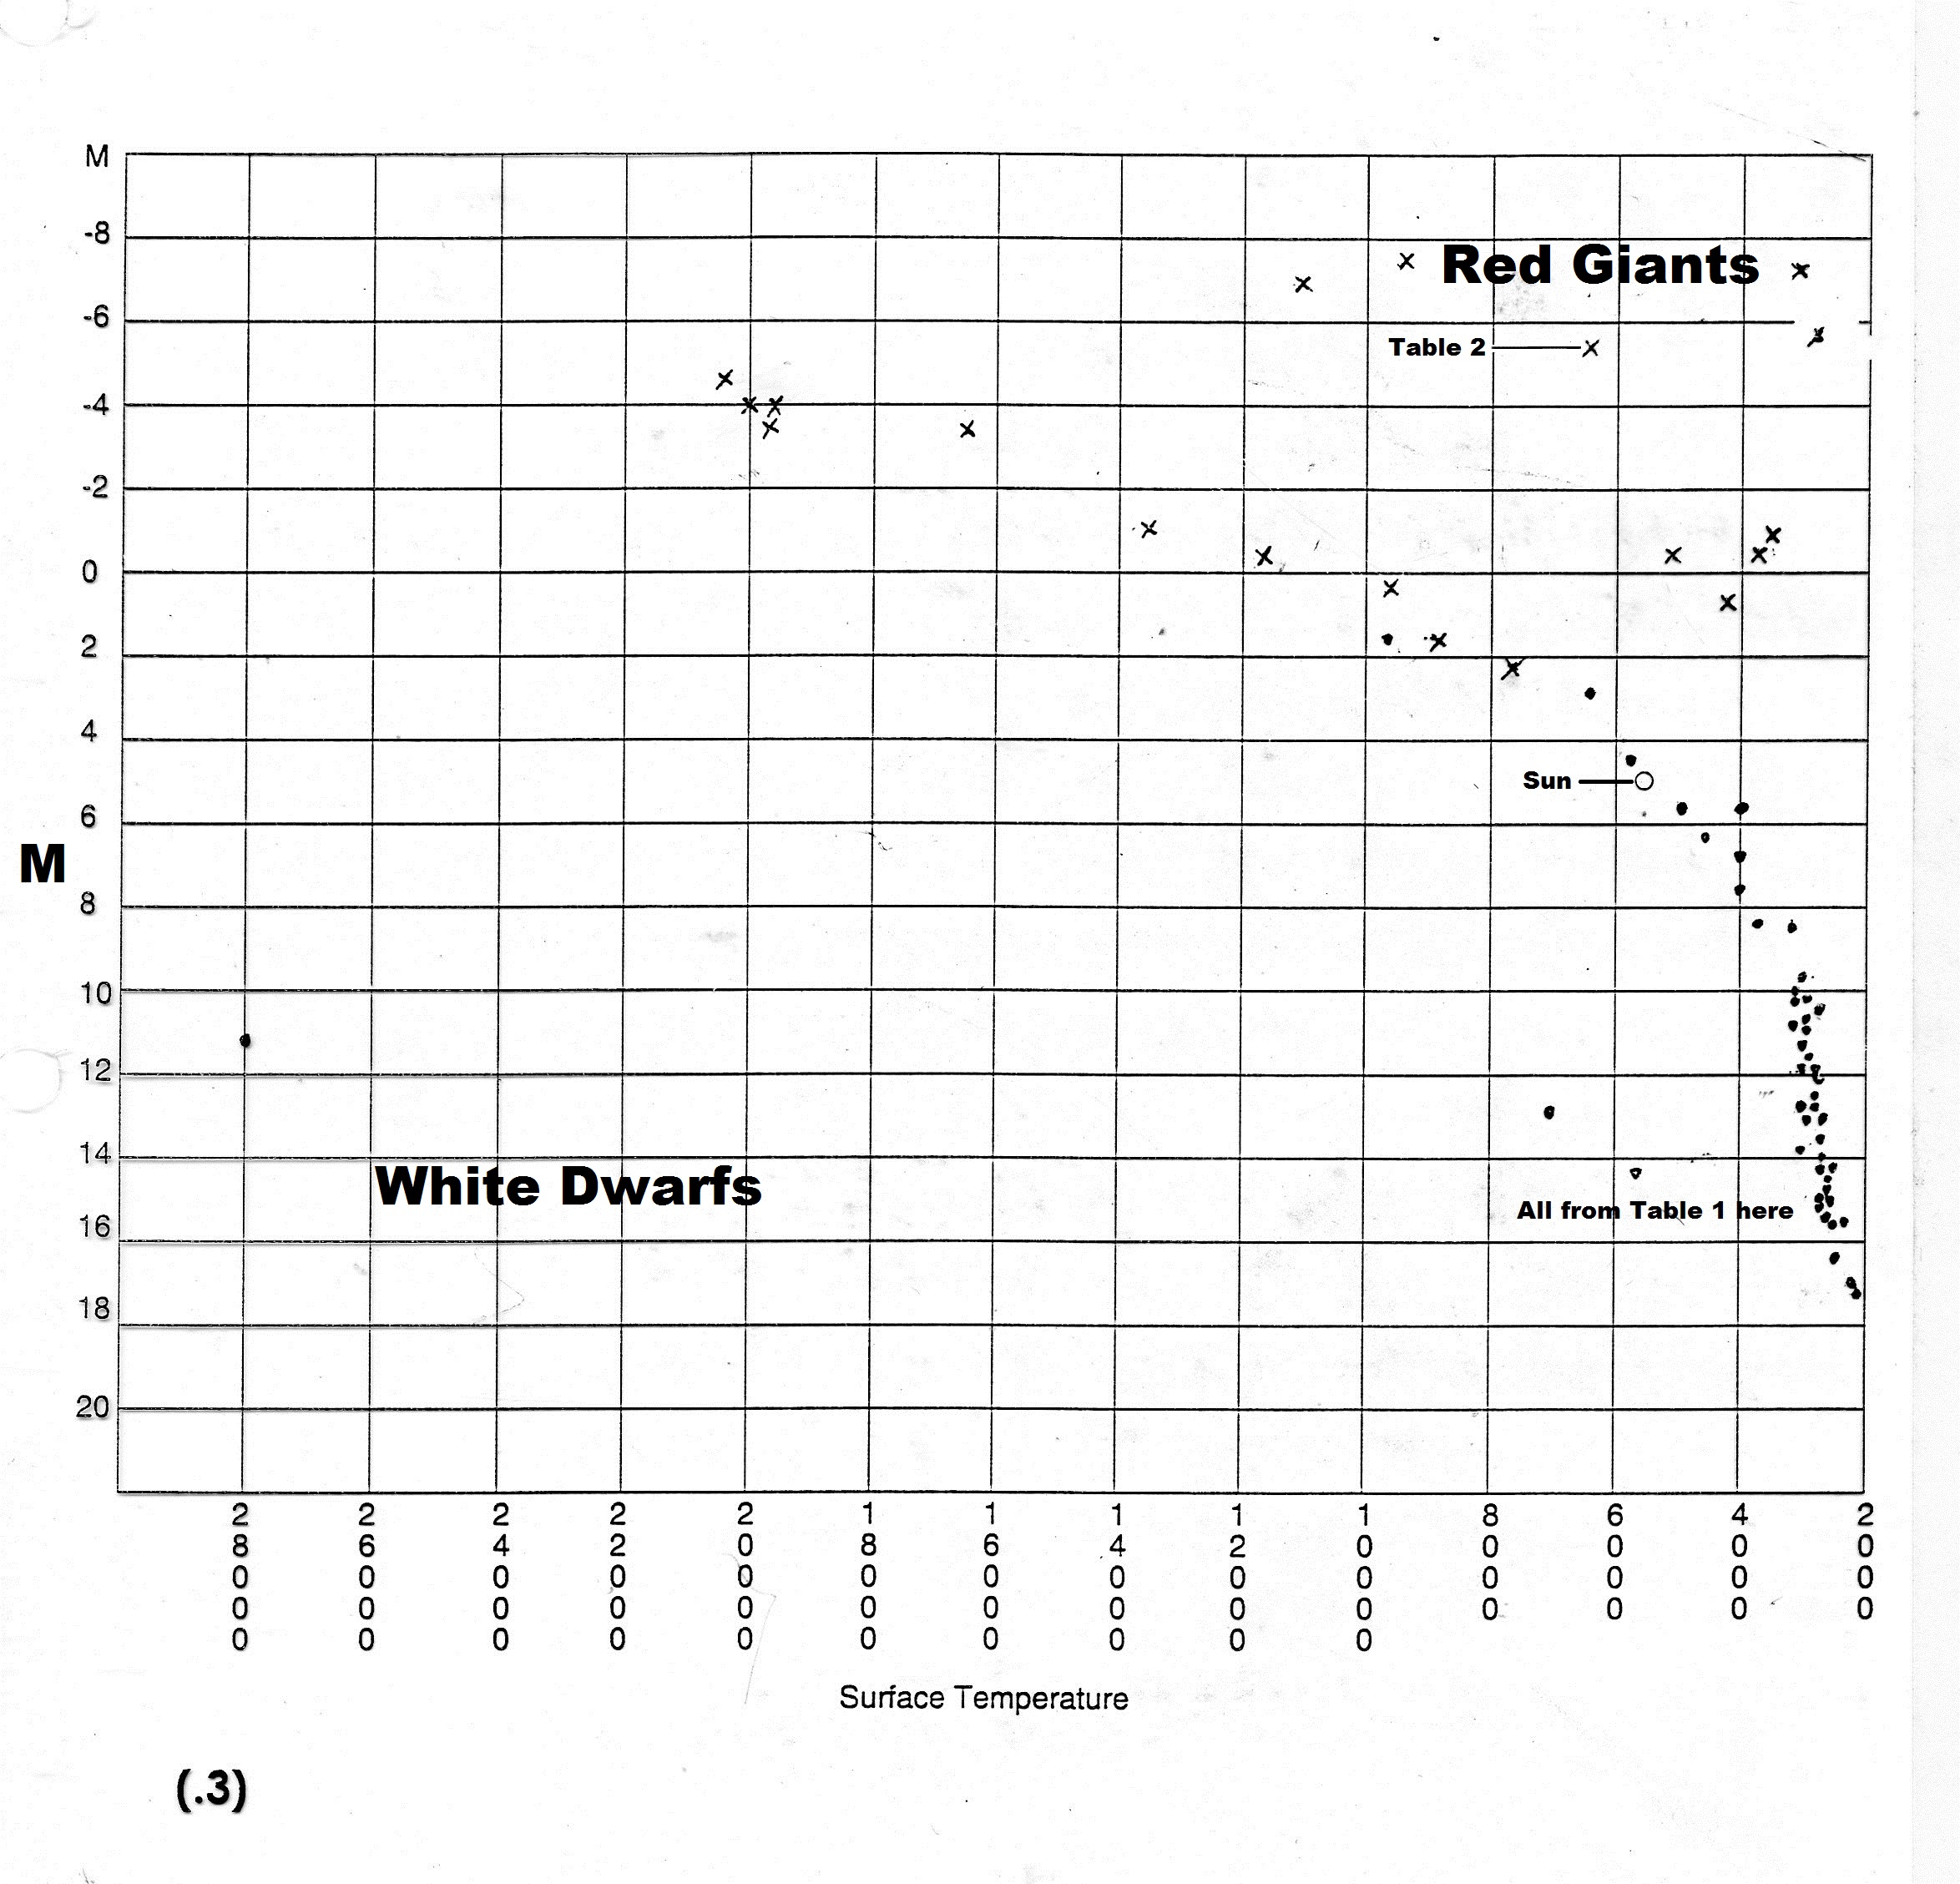
Prof. Scalise) that you can use to compare their work to really accurate plotting. There's one of
these for each of you. Return them when done - we'll need them again. I have scanned one of these
plots for you. Here's the image; I added a few notes.
The equation they will use for magnitude calculations is m-M=5log(d/10). "m" is the apparent
magnitude (brightness) of the star on the sky, "M" is what the apparent magnitude would be if the
star were exactly 10 parsecs away, and "d" is the star's distance in parsecs. Magnitude numbers
are not intuitive: a larger number means a fainter star. The brightest star (Sirius) is mag -1.5.
The text of Lab 9 has this solved for each variable, plus more background.
Analysis and Measurements
- Most Numerous: The most numerous stars on the plot will be at the lower right.
These are the cool, red dwarfs (type M)
- More/Less Luminous: In Table 1 only three stars are more luminous than the Sun (M < 4.85).
- Diameter: The larger star will be 4 times more luminous. Surface area (4 pi r2)
of the larger one is 4 times that of the smaller.
- Luminosity Difference: Deneb is most luminous (M= -7.5). LP731-58 is least Luminous (M=17.3).
The difference is 24.8 magnitudes. This is approximately 8,300,000,000 times.
- Temperature/Luminosity: One of the stars should be in the Main Sequence band and the other
one some distance directly above it. The reason for different luminosities at the same temperature
is surface area; the brighter star is much larger.
- Sun Visibility: The apparent magnitude (m) will be 14.6. No chance of naked eye visibility.
Naked eye visibility means magnitude 6 or brighter (smaller number).
- Deneb: This distance is approximately 3800 parsecs.
- Sun Naked-Eye Distance: This distance is about 17 parsecs.