Diodes and Transistors
ALL THE TABLES ON ONE PAGE FOR EASY PRINTING
SPECIFIC OBJECTIVES
To determine some of the operating characteristics of semiconductor diodes
and transistors.
EQUIPMENT
Circuit board, D-cell batteries (2), wires, resistors,
multimeter,
diode, transistor, and probe leads.
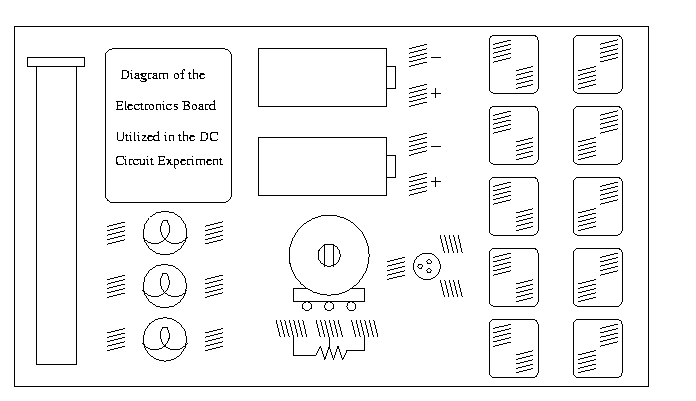
CIRCUIT BOARD DIAGRAM

PROCEDURE
The underlined passages below require an answer or a sketch in your
notebook.
Part 1 - Diodes
- When you are not taking data, please disconnect the battery; this
will increase its lifespan.


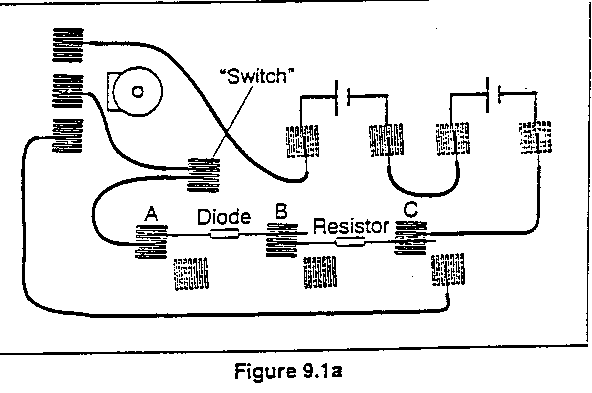
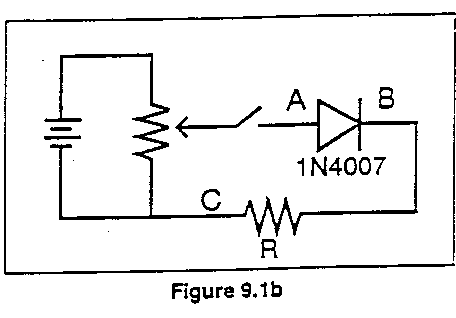
- Connect the circuit shown above using the 1000-ohm resistor. Orient the
diode with its band closer to point B. Record this data under "Forward Bias".
- With the switch closed and the current flowing, adjust the potentiometer
until there is voltage of 0.05 volt across the resistor. Measure the voltage
across the diode. Record your values in the table below.
- Adjust the potentiometer to attain voltages across the resistor between
0.10 volts and the maximum battery voltage. For each of these settings,
measure the voltage across the diode. Record your values in the table
below. Plot the points as you go. Take more data where the plot is
interesting, less where it is predictable.
- Reverse the orientation of the diode. Record this data under "Reverse
Bias".
- Set the diode voltage (not the resistor voltage this time) to values
between 0.50 volts and the maximum battery voltage. For each of these
settings, measure the voltage across the resistor. Record your values
in the table below. Plot the points as you go. Take more data where
the plot is interesting, less where it is predictable. (Sometimes zero is the
correct answer.)
- Calculate the current flowing in this series circuit by dividing the
resistor voltage by the resistance. Record your values in the table
below. This must also be the current flowing through the diode.
- Graph the current through the diode (vertical axis) vs. voltage
across the diode (horizontal axis). Plot the forward bias voltages
on the positive horizontal axis and the reverse bias voltages on the
negative horizontal axis. This graph is called the current-voltage
characteristic of the diode.
- Repeat the exercise with the 330-ohm resistor in place of the 1000-ohm
resistor.
- Discuss the shape of the graph. Describe in words how a diode
behaves.
- Plot the 1000-ohm and the 330-ohm graphs on top of each other. Is
there any difference in the two curves? What does this tell you about the
diode?
- Sketch the current-voltage characteristic of a resistor and compare
it to that of the diode. Does the diode obey Ohm's Law?
- Suggest an application for a diode.
These tables are for illustrative purposes only; the tables on the separate
printable page have more rows for data entry.
R = 1000 ohms
Forward Bias
R = 1000 ohms
Reverse Bias
R = 330 ohms
Forward Bias
R = 330 ohms
Reverse Bias
Part 2 - Transistors
- When you are not taking data, please disconnect the battery; this
will increase its lifespan.

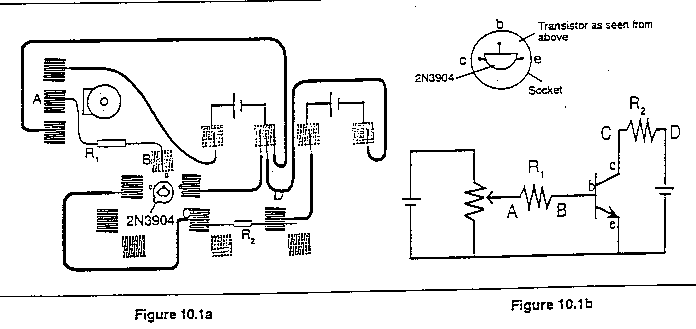
- Connect the circuit shown above using R1 = 1000 ohms and
R2 = 100 ohms. Be sure that the transistor is seated properly
in its socket.
- Adjust the potentiometer until the voltage across the large resistor
VAB is approximately 0.002 volts (=2 millivolts). Measure the
voltage across the small resistor VCD. Record your values
in the table below.
- Adjust the potentiometer to attain voltages VAB between 0.000
volts and 0.250 volts. Record the corresponding VCD in the
table below. Plot the points as you go. Take more data where the
plot is interesting, less where it is predictable.
- Note that VAB divided by R1 gives the current
flowing into the base of the transistor IB, while VCD
divided by R2 gives the current flowing out of the collecter
IC. Record your current values in the table below.
- Graph the collector current IC (vertical axis) vs. the
base current IB (horizontal axis).
- Repeat the exercise with R2=330 ohm instead of 100 ohm.
- Discuss the shape of the graph. Describe in words how a transistor
behaves.
- Find the slope of the straight-line region near the origin.
This ratio IC / IB is referred to as the "current
amplification" of the transistor.
- What does the leveling off of the graph indicate? This
region is called "saturation" of the transistor.
- Plot the 100-ohm and the 330-ohm graphs on top of each other. Is
there any difference in the two curves? What does this tell you about the
transistor?
These tables are for illustrative purposes only; the tables on the separate
printable page have more rows for data entry.
R1 = 1000 ohms; R2 = 100 ohms.
R1 = 1000 ohms; R2 = 330 ohms.
Bonus: "b" stands for "base"; "c" stands for "collector".
What does "e" stand for on the transistor? (See why it pays to read the
lab ahead of time?)
 Back to the Electricity and Magnetism Manual


 Back to the Electricity and Magnetism Manual