Index of Refraction
SPECIFIC OBJECTIVES
To become familiar with the use of a spectrometer;
to understand how the index of refraction varies with the wavelength of light.
EQUIPMENT
Spectrometer, glass prism, mercury light source, high-voltage power supply.
BACKGROUND
A spectrometer is designed to measure the angle between two beams of
light. One beam goes straight through the spectrometer and the other
beam is deviated by some device such as a glass prism or a
diffraction grating. The angle between these two beams is called the
angle of deviation (D). A spectrometer consists of the following parts:
- light source
- collimator and slit
- table
- telescope
- angle scale
The light source must involve whatever material is being
investigated and that material must be excited to produce (visible, in this
case) electromagnetic radiation (light). A frequently used source consists
of a sample of the substance to be investigated kept at a very low pressure
in a capillary tube. When this tube is provided with a high enough voltage
across its ends, a current will flow through the tube. The current
electrons will interact with the atomic orbital electrons and the latter
will gain energy. When the orbital electrons release this excess energy,
it is in the form of electromagnetic radiation which may or may not be
visible. What startled early spectroscopists was that the emitted radiation
consisted not of every color, but of discrete wavelengths
( )
and every chemical element had a unique set of wavelengths (called the
spectrum of the element) which could be used to identify that element with
certainty.
The collimator is simply a tube of adjustable length which is used
to make the light rays from the source parallel. On the end of the
collimator, facing the source, is a variable width slit which is
used to allow more or less light into the spectrometer.
The prism (this lab) or diffraction grating (next lab) is mounted on the
table which can be rotated to adjust the angle of incidence of the
beam from the collimator.
Within the telescope is a hairline which facilitates centering the
telescope on the image of the slit. Both the slit and the hairline must be
well focused to accomplish this. The telescope is mounted in such a way
that it can be rotated about a central, vertical axis.
Attached to the telescope is an angle scale which allows the angle
through which the telescope rotates to be directly measured. The angle
scale is calibrated to read 0.0o when the hairline is centered
on the straight through beam. There is a vernier scale to provide reading
precision to the nearest tenth of a degree (0.1o).
If the angle of incidence of the light beam on the prism is changed by
rotating the table on which the prism sits, the image of the slit will move
toward 0.0o. If the table is rotated further, the image of the
slit will stop for an instant then begin to move away from 0.0o.
Thus, the angle of deviation has passed through a minimum value,
Dm.
The formula relating the angle of minimum deviation of a particular
wavelength to the index of refraction (n) for that wavelength is
n = sin[(A+Dm)/2] / sin(A/2)
where "A" is the apex angle of the prism.
PROCEDURE
Calibrating the Spectrometer
- Place the power supply on the base (2-kg mass) so that the narrow,
bright part of the light source capillary tube is aligned with the
collimator. Turn on the power supply.
- Open the slit on the end of the collimator by turning the silver knob.
Look through the telescope while moving it back and forth until you find
the illuminated slit. Focus the slit by moving the barrel of the telescope
in and out. Focus the hairline by moving the eyepiece in and out. Rotate
the slit until it is vertical. Rotate the eyepiece until the hairline is
vertical. You may need to move the light source (carefully!) so
that the slit is maximally bright.
- Open and close the slit while looking through the telescope. Notice
that only one side the slit moves; the other side is stationary. Place the
hairline over the side of the slit that does not move, on the boundary
between light and dark.
- While keeping the hairline on the stationary side of the slit, rotate the
angle scale until it reads 0.0o. Lock the angle scale by turning
the silver knob at the base of the spectroscope. The scope is now calibrated;
from now on the angle scale will move with the telescope as it is rotated.
Do not loosen the screw at the base of the scope at any point during the
lab.
Measuring the Apex Angle (A)
- Open the slit to its maximum width. Check to see that the slit is
vertical, well-focused, and at its maximum brightness.
- Handle the prism extremely carefully! It is very expensive and very
fragile.
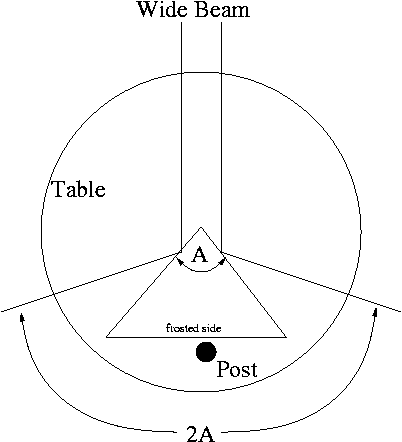
- Rotate the table until the post is in front of the telescope. Place the
prism on the table with the apex angle (A) facing the source, and with the
apex near the center of the table. The frosted side of the prism opposite
the apex angle should touch the post. Clamp the prism in place. The prism
must be located such that the wide beam from the fully opened slit is split
by the apex. Each part of the beam will be reflected from the two sides of
the prism. The law of reflection may be applied to show that the total
angle between these two reflected beams is 2A.

- By eye, adjust the prism so that the frosted side is perpendicular to
the beam and the apex is in the middle of the beam. Place the black cloth
over the table.
- Swing the telescope to both sides of zero and locate both beams. Do
not take any angle measurements until both beams are visible. If neither
reflected beam appears, it may be because the light source is not directly
in front of the slit. Try moving the source slightly from side to side.
If one beam appears, but the other does not, the reason may be that the
prism is misaligned and all the beam from the source is reflecting from one
side of the prism, while none is reflecting from the other side of the
prism. Remove the cloth and rotate the table slightly to place the apex
in the center of the beam. Lock the table in place using the set screw
under the table. Replace the black cloth.
- Once the reflected beams are visible on both sides of zero, measure the
angles on both sides by aligning the hairline with the side of the slit
that does not move. But remember, this is a reflection so left and right
will be reversed. Measure each angle to the nearest tenth of a degree.
- Average the two angles away from zero to find the apex angle (A) of the
prism. It will be necessary first to subtract one angle from 360o.
Minimizing the Angle of Deviation
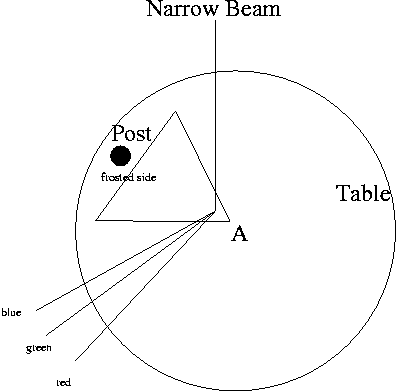
- Remove the black cloth, loosen the table set screw, and rotate the table
so that the frosted side of the prism and the post are near 10 o'clock (with
the source at 12 o'clock). One of the clear sides of the prism should be
perpendicular to the beam from the source, and the apex should be near the
center of the table. Replace the black cloth.

- Move the telescope to the left of zero and find the refracted beams.
- Once you locate the mercury spectrum, narrow the slit until it is just a
few times wider than the hairline. You may need to reposition the light
source so that the slit is maximally bright.
- Reach under the black cloth and rotate the table. The spectral lines
will shift to the right, stop, and shift to the left. Find the table position
which puts the lines at their rightmost extent and lock the table in place.
The angle of deviation has been minimized. Do not touch the table or the
prism for the remainder of the experiment.
Measuring the Angle of Minimum Deviation (Dm)
- Move the telescope until the hairline is aligned with the stationary
side of the narrow slit (this is NOT a reflection) for each color. Record
the angle away from zero to the nearest tenth a degree for each color listed
in the table below. Repeat your measurements more than once and average.
| Wavelength (Angstroms) | Color | Intensity |
| 5790.66 | Yellow | Strong |
| 5769.60 | Yellow | Strong |
| 5460.74 | Green | Strong |
| 4916.07 | Blue-Green | Weak |
| 4358.33 | Violet | Stronger |
| 4077.83 | Violet | Weak |
| 4046.56 | Violet | Less Strong |
- The yellow lines form a doublet, a pair of lines very close
together. If you can only distinguish one yellow line, narrow the slit
and make sure that it is in sharp focus. The separation between the two
yellow lines will be roughly the width of the hairline.
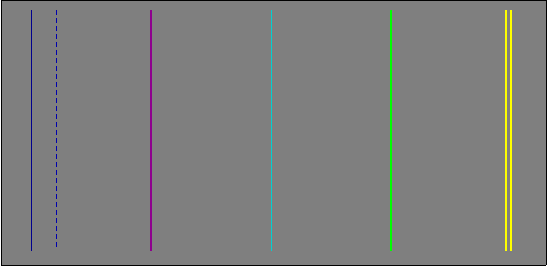
- The two yellow lines, the green line, and the stronger violet line are
easily visible with the room lights on. Viewing the other lines may
require complete darkness. It often helps to look slightly to one side of
the line because the rod photoreceptor cells in your eyes are more numerous
away from center. Below is a sketch of the relative line locations,
separations, and intensities.

- When the room is dark to accommodate seeing the faint spectral lines, it
is difficult to see the hairline. This can be illuminated periodically
with the flashlight.
- There should not be any red in the mercury spectrum. If colors other
than the ones listed in the table are visible, they are due to
the presence of singly ionized mercury, Hg II, or an impurity such
as nitrogen gas from the atmosphere leaking into the tube.
- Some spectrum tubes may give two blue-green lines. If this is the case,
measure the one closer to the violet side of the spectrum. The spurious
line is due to the presence of singly ionized mercury, Hg II.
Analysis
- Use Dm for each color to calculate n for each color. The
error in n and the number of significant figures in n are determined by
finding the largest and smallest n's consistent with your measured
Dm. That is, Dm can range from a low value of
(Dm - its error) to a high value of (Dm + its error).
Each end of this range corresponds to a different n.
- Plot n (vertical axis) vs.
 (horizontal axis) for
the seven visible mercury lines.
- Fit the best function through your data points. It is not expected that
the curve will be any particular function; you will merely determine an
empirical relationship between the index of refraction and the wavelength.
DO NOT FIT A STRAIGHT LINE THROUGH THE DATA POINTS. It will be obvious
from your plot that the data are not linear.
- The prism manufacturer asserts that the prism has n=1.65 for some
particular wavelength (not necessarily one of the seven mercury
wavelengths).
- What should be the angle of minimum deviation for this wavelength?
- Use your plot to determine the corresponding wavelength and color.
- Identify two sources of random error and two sources of systematic error.
 Back to the Electricity and Magnetism Manual


 Back to the Electricity and Magnetism Manual